GIS Data by MAPOG is a user-friendly platform that allows users to download clinic data in various GIS formats, including Shapefile, KML, and GeoJSON. The platform provides a seamless way to access and analyze healthcare facility locations, making it easier for planners, researchers, and policymakers to map and study clinic distributions worldwide.
How to get Clinic Data in MAPOG
MAPOG supports multiple data formats, ensuring compatibility with GIS tools. Users can access Shapefile, KML, CSV, GeoJSON and many more formats for their analysis. We can get 200+ countries 900+ datasets available here.
Download Clinic data of any countries
Note:
- All data is provided in GCS datum EPSG:4326 WGS84 CRS (Coordinate Reference System).
- Users need to log in to access and download their preferred data formats.
Step-by-Step Guide to Download Clinic Data
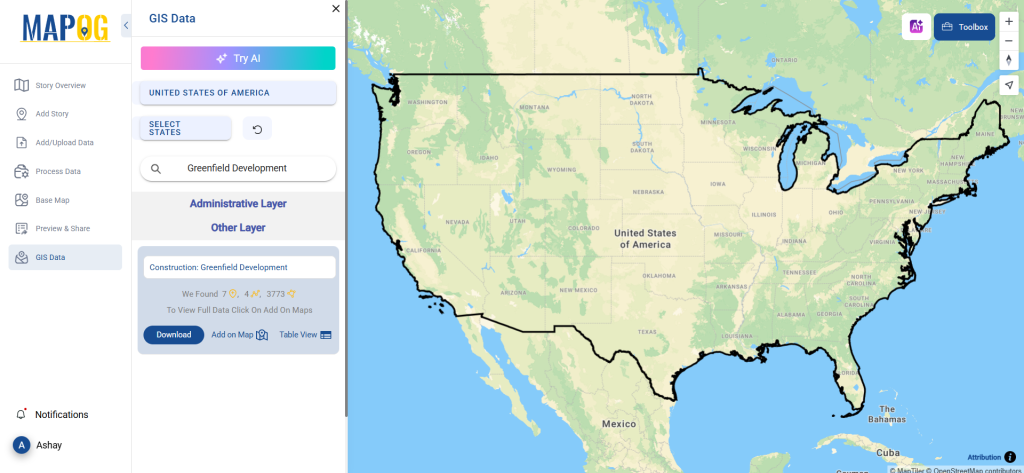
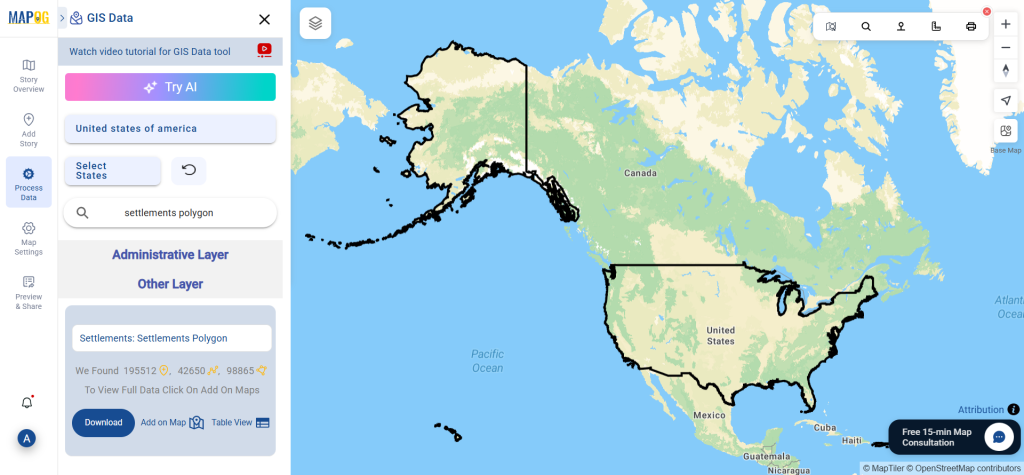
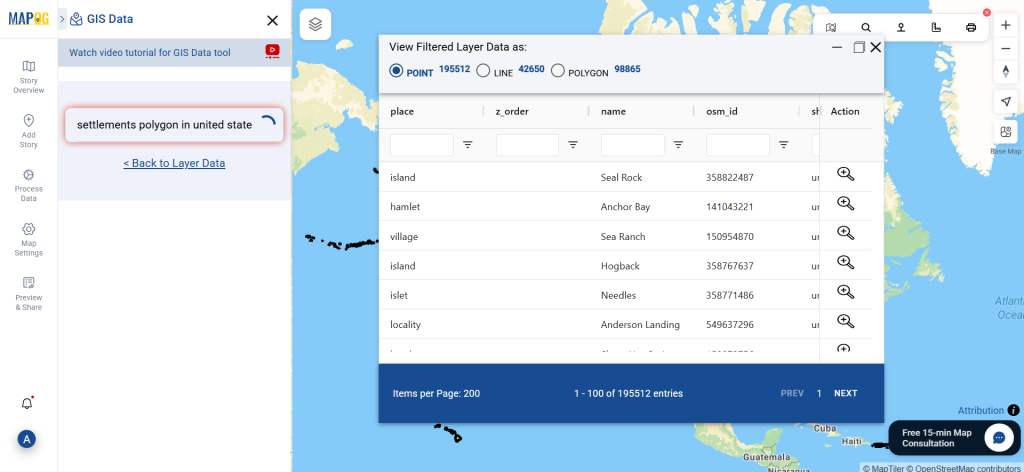
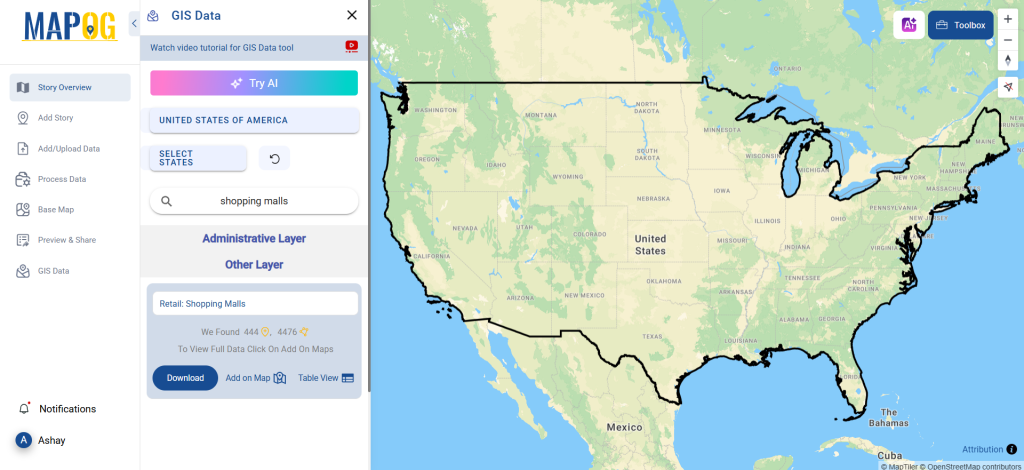
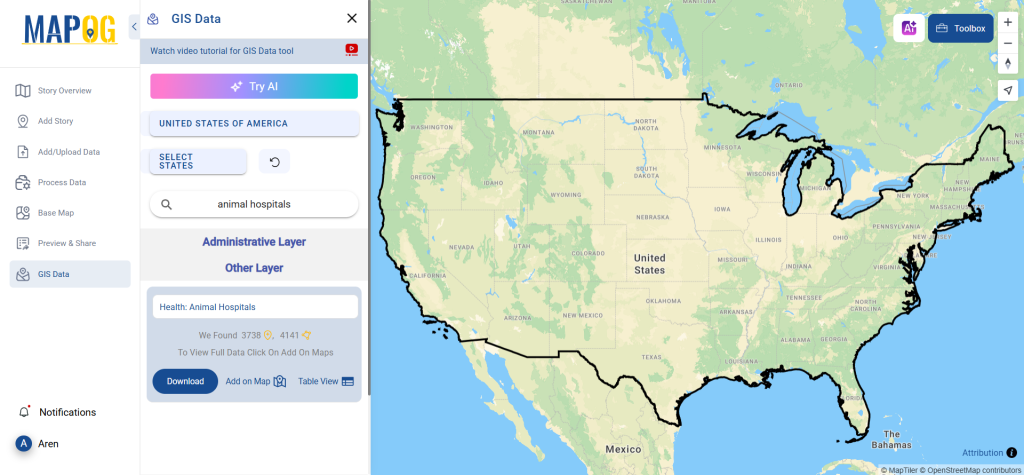
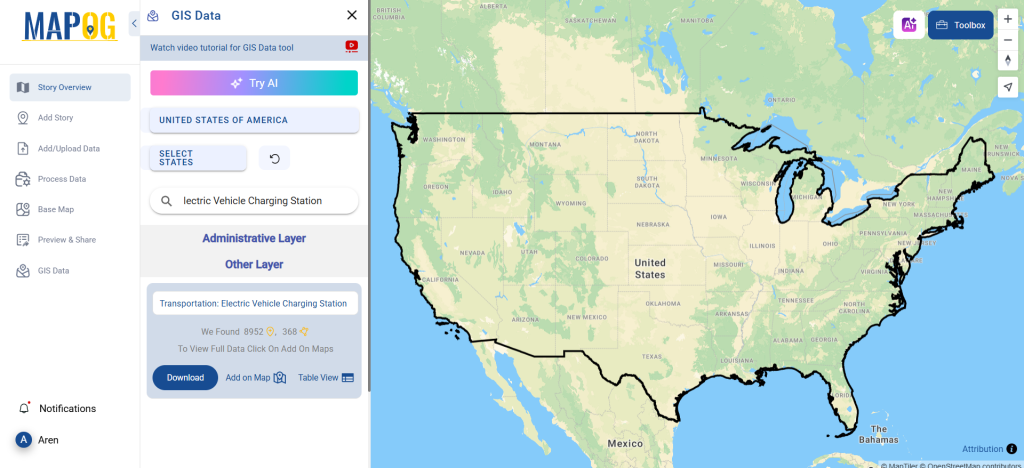
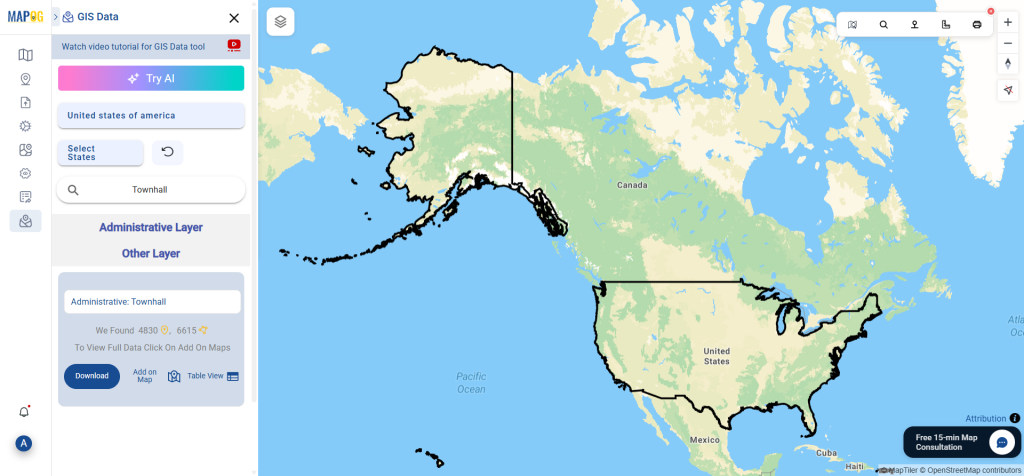
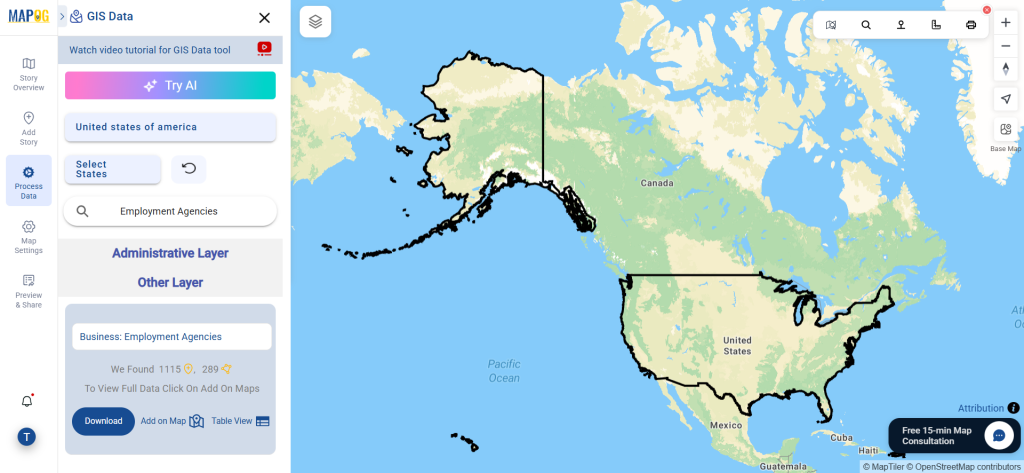
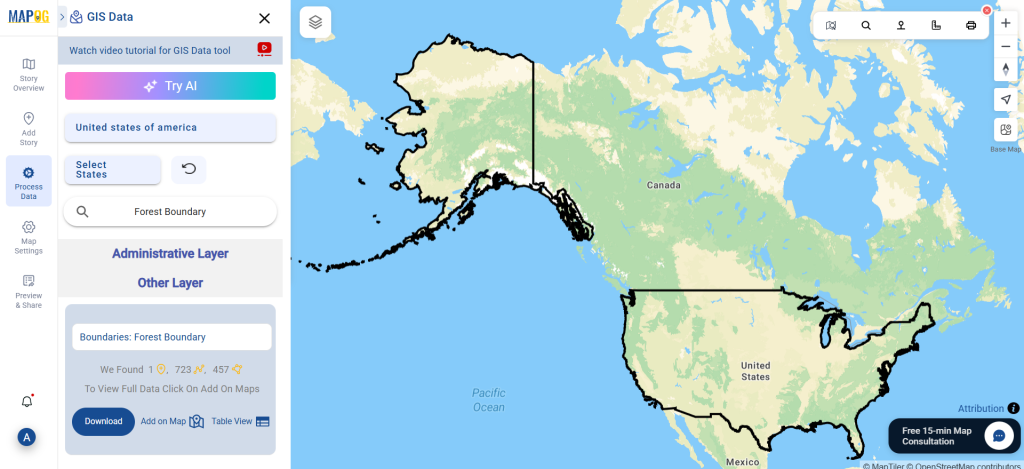
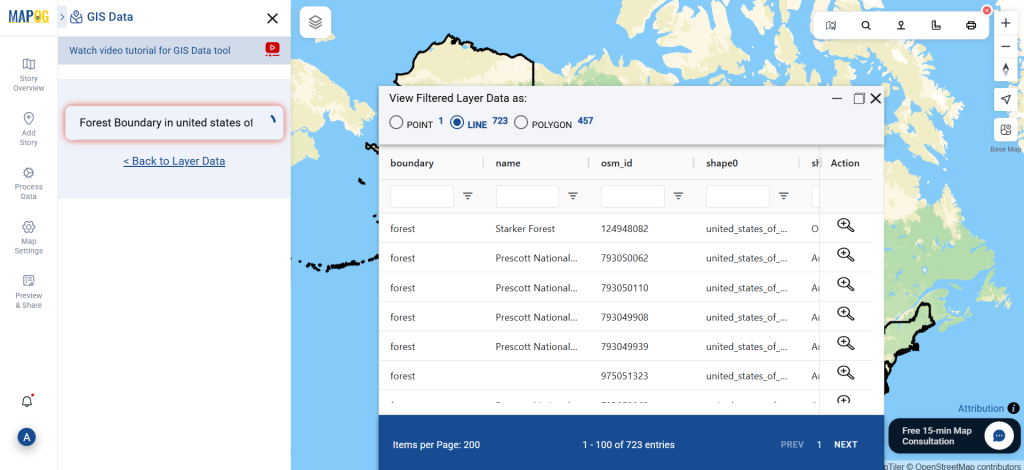
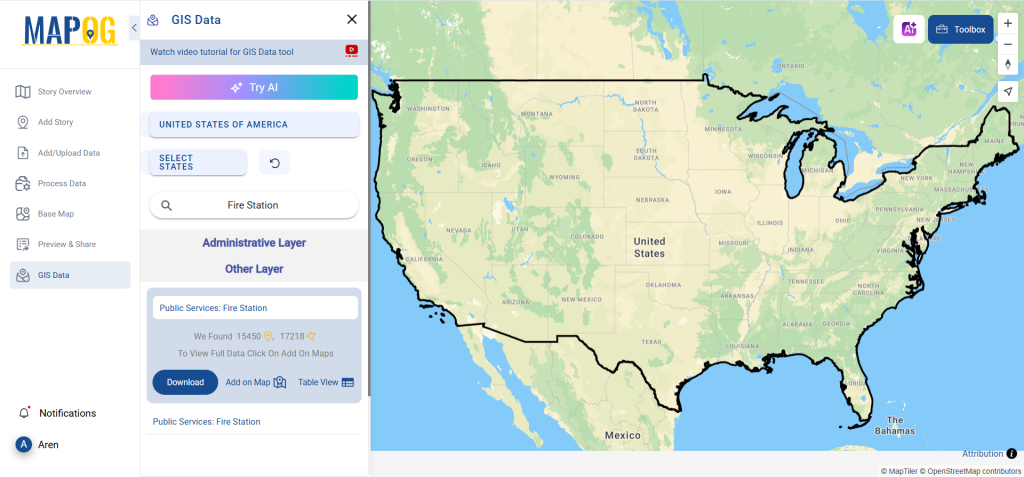
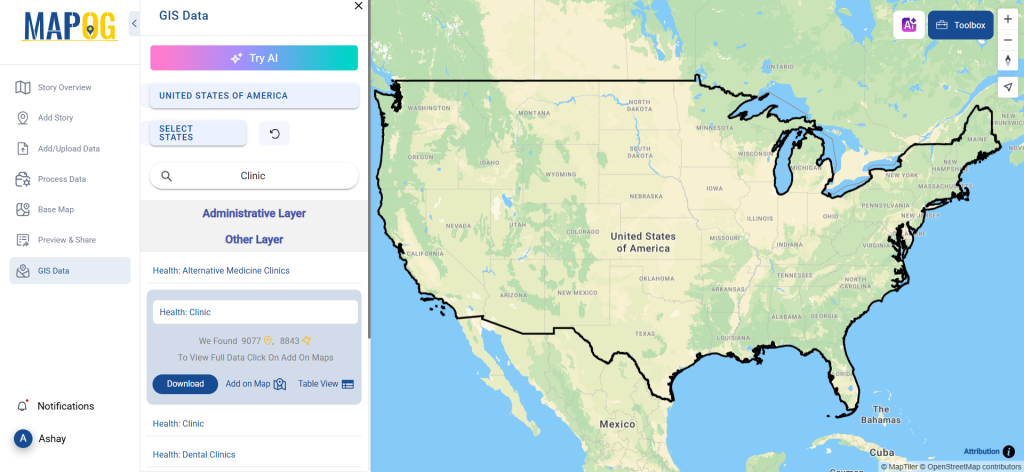
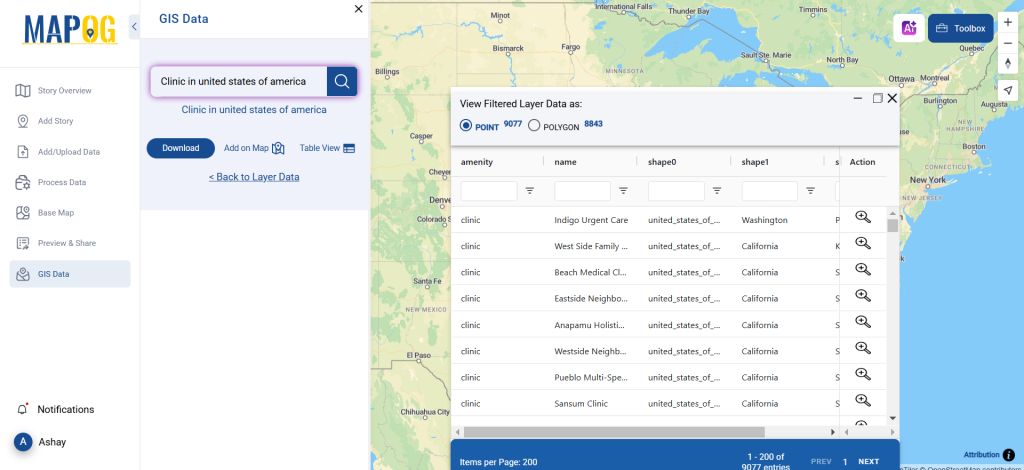
Step 1: Search for ‘Clinic Data’
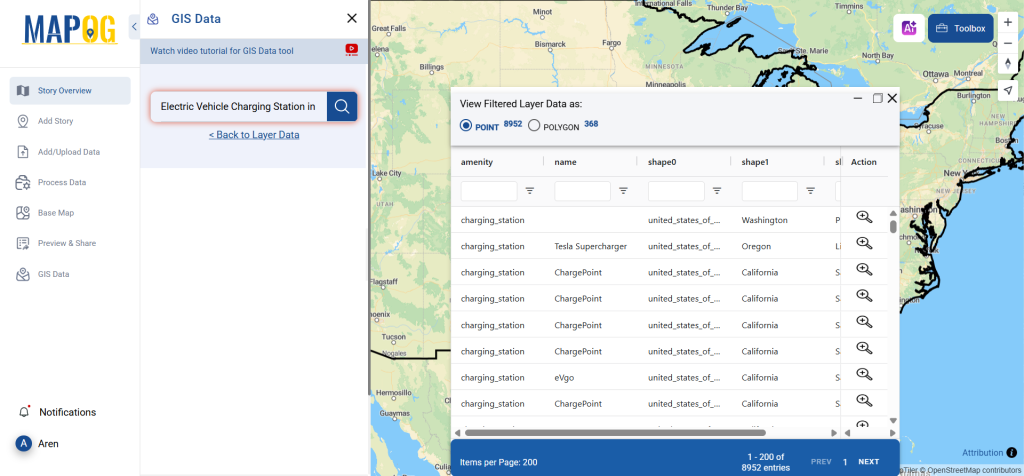
After accessing the GIS Data interface, select the desired country. Use the search layer option to locate Clinic data for specific locations. Review data attributes to check if they are formatted as points or polygons. For instance, users can search for medical centers in countries like the USA, UK, Canada, and Germany.
Step 2: Utilize the AI Search Tool
Try the AI tool, “Try AI,” in the upper left corner to simplify the search process. Just enter what data you need and from which region, and the AI will provide the most relevant results.
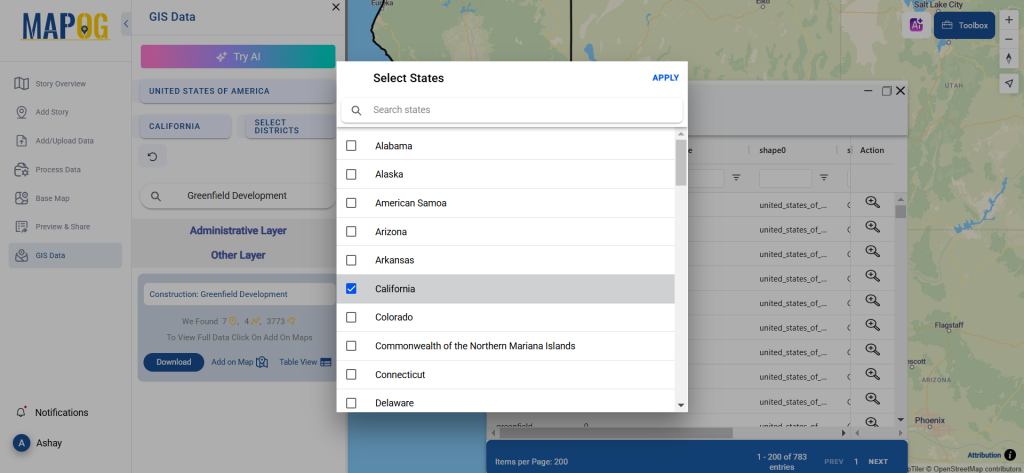
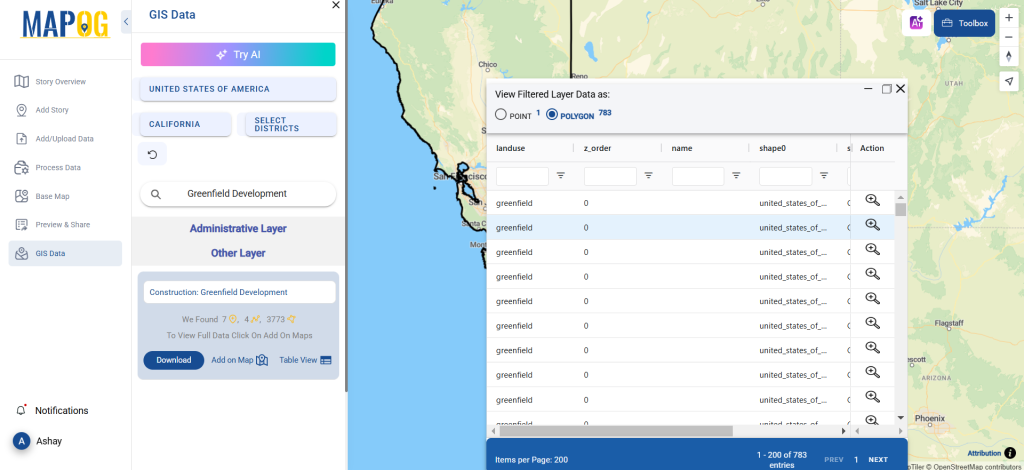
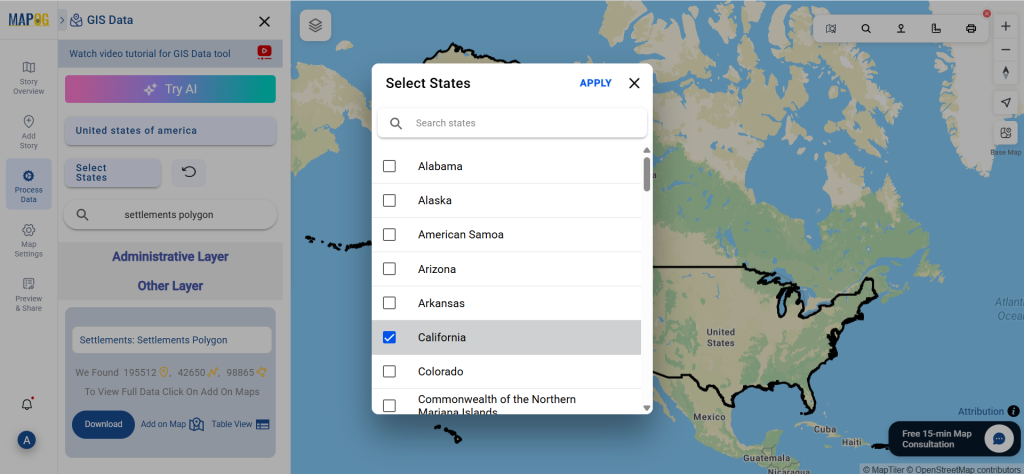
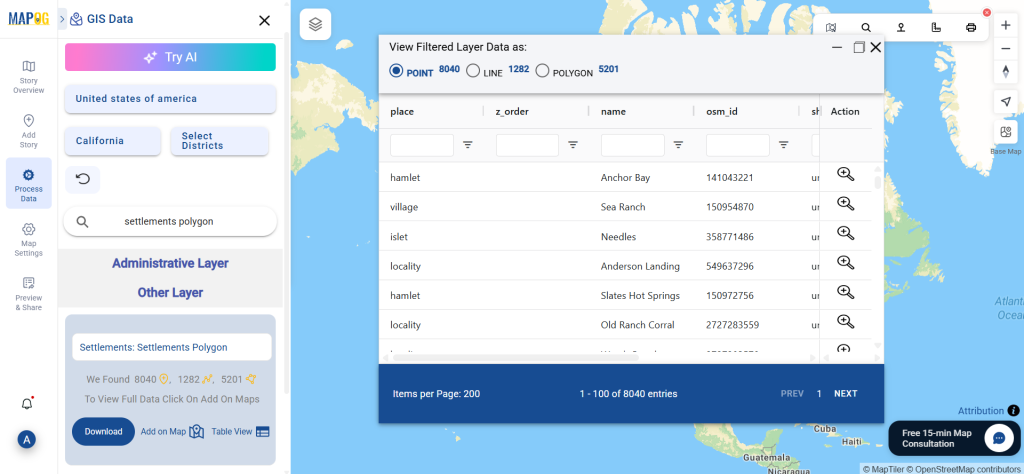
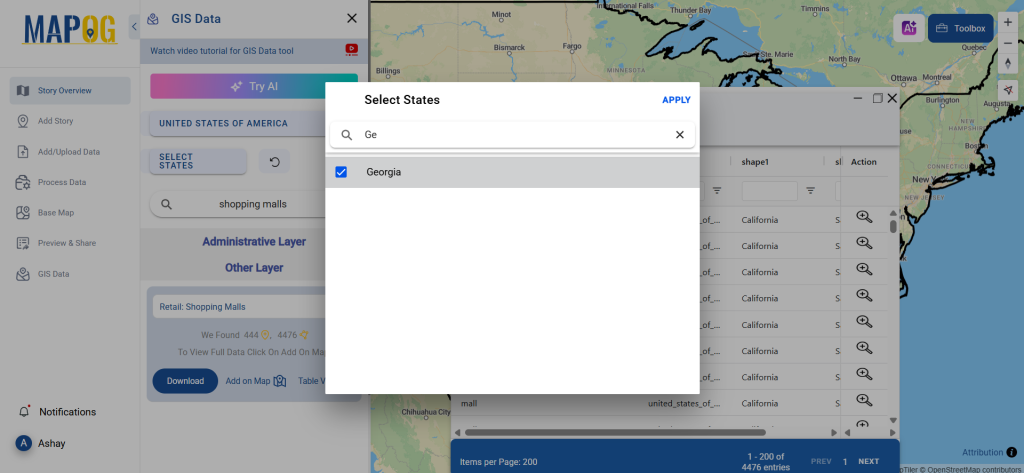
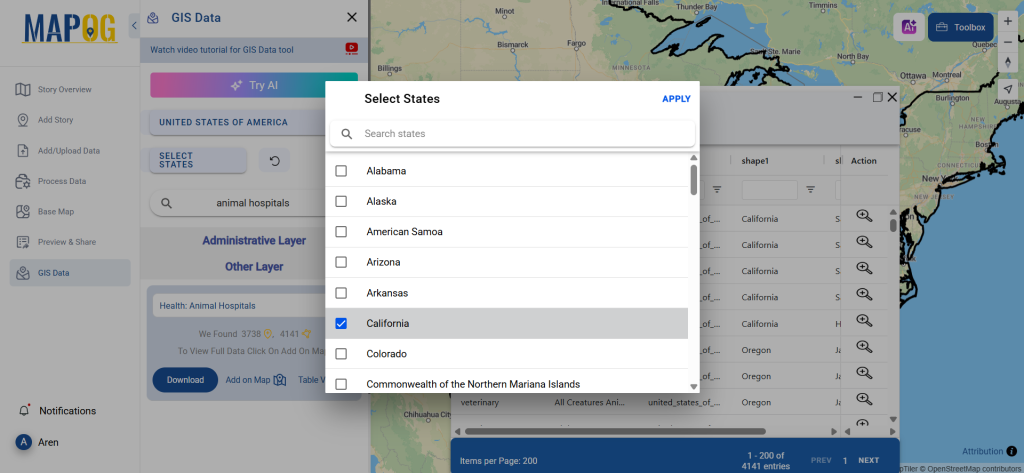
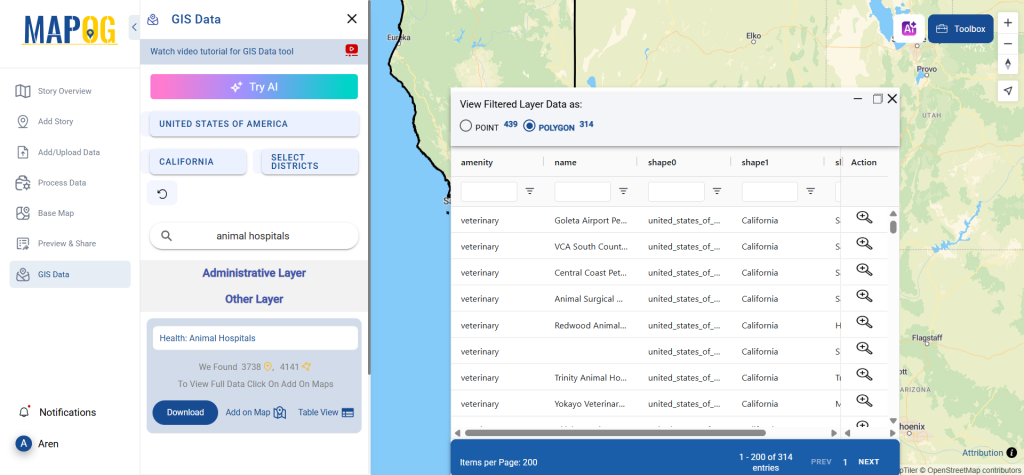
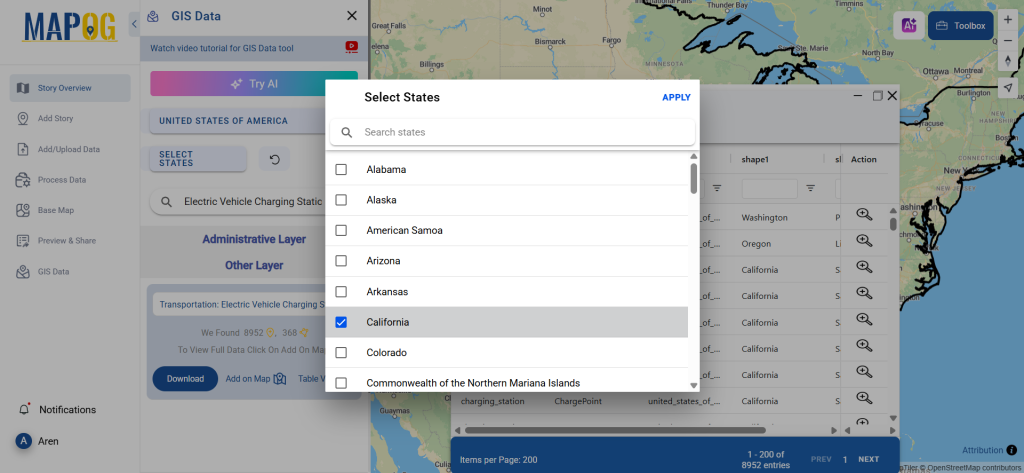
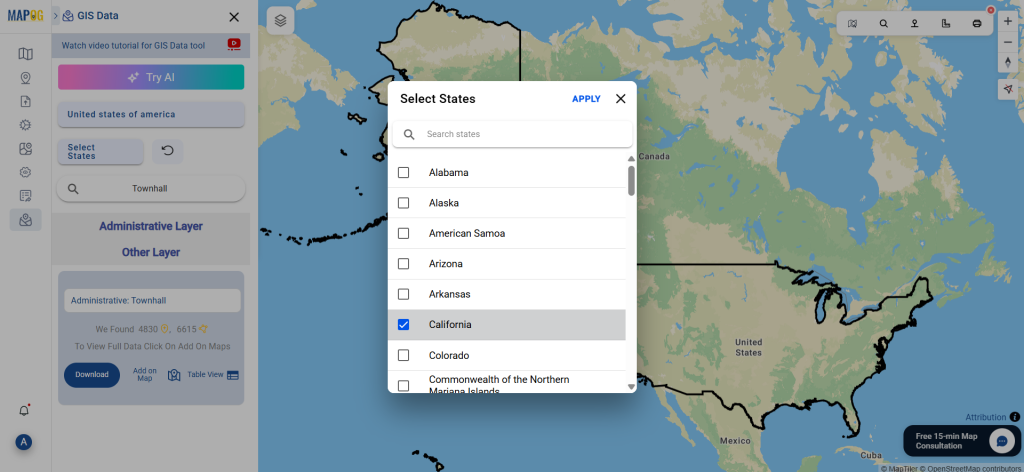
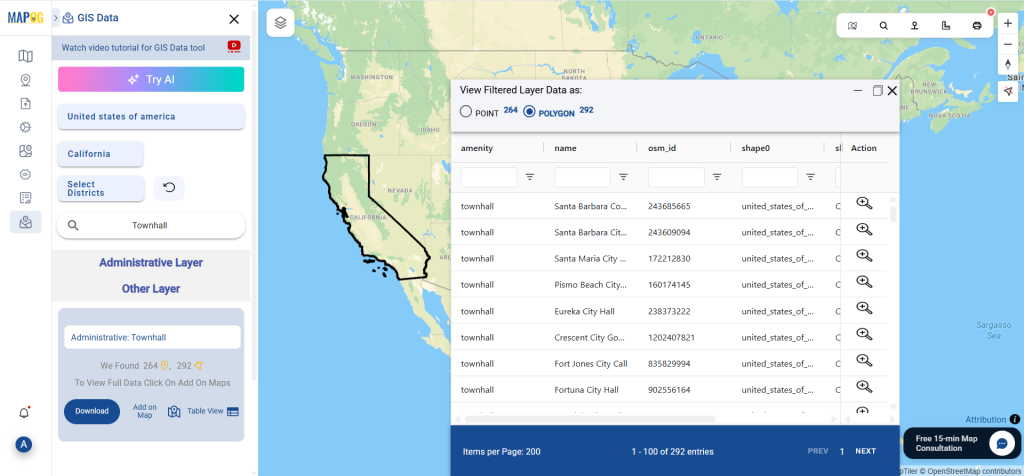
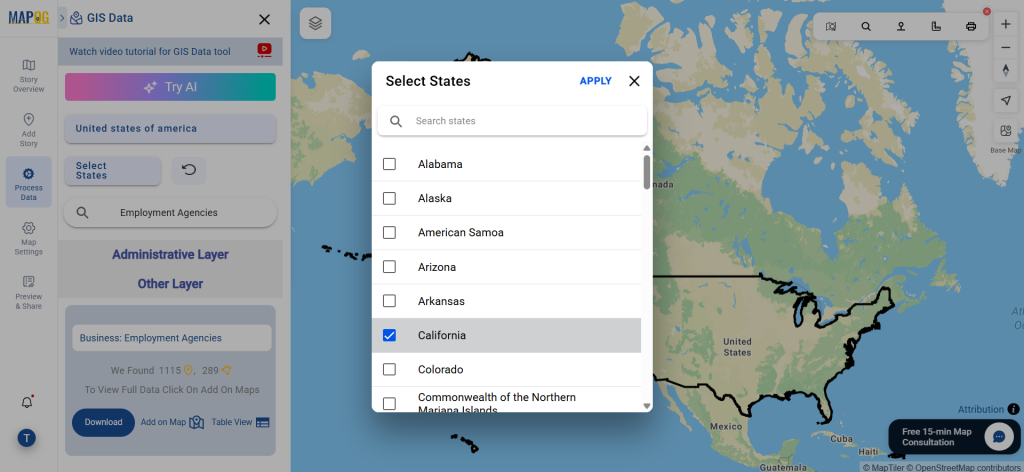
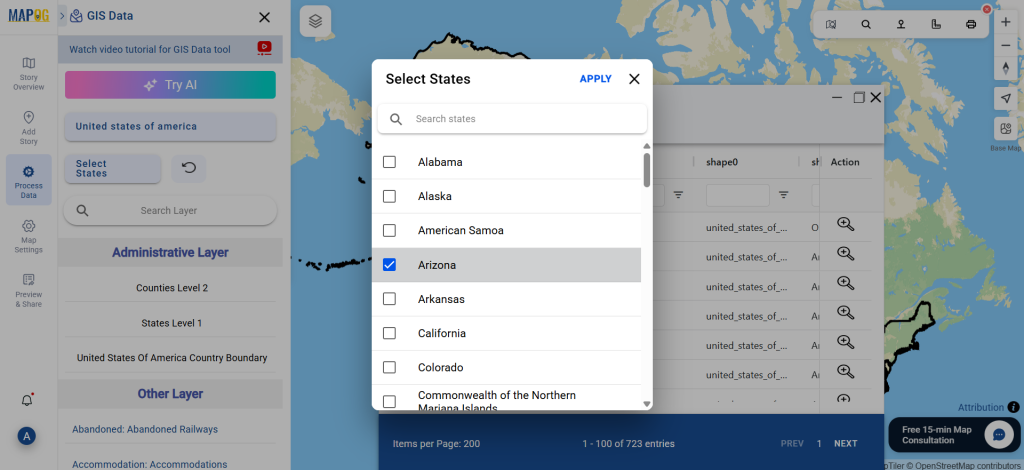
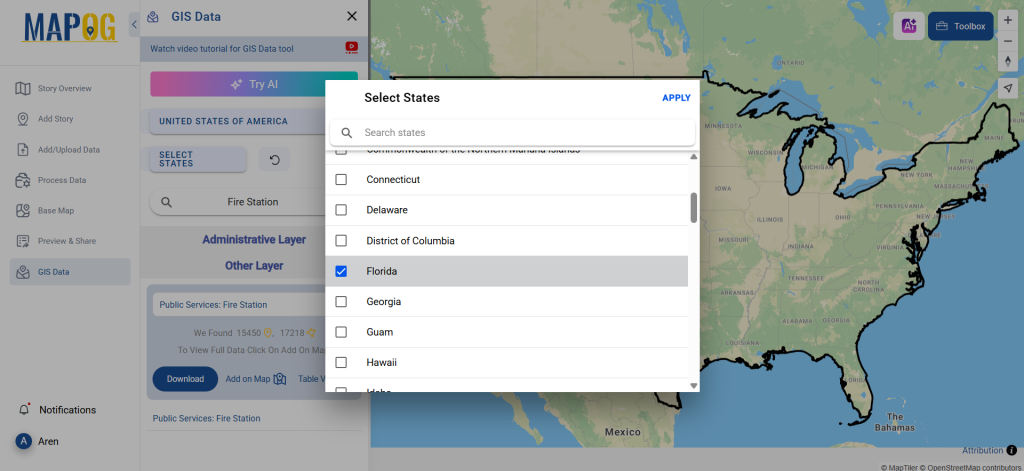
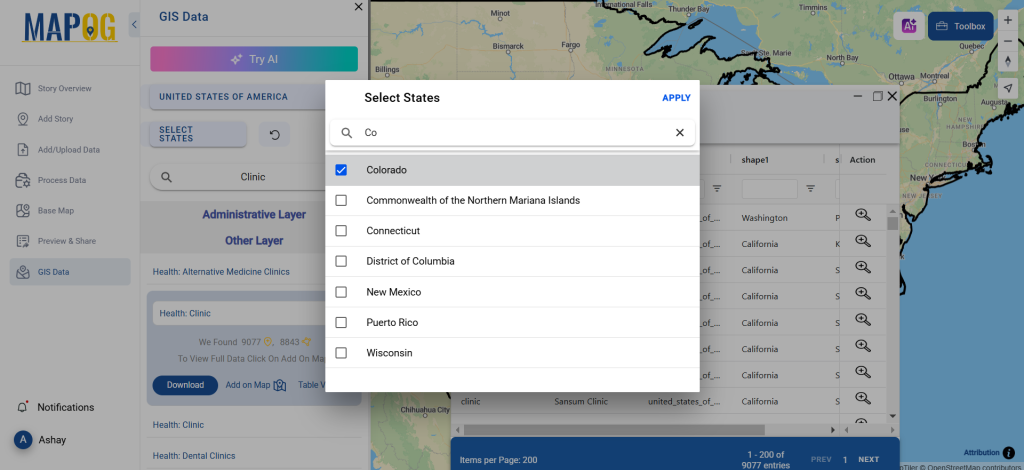
Step 3: Apply Filters
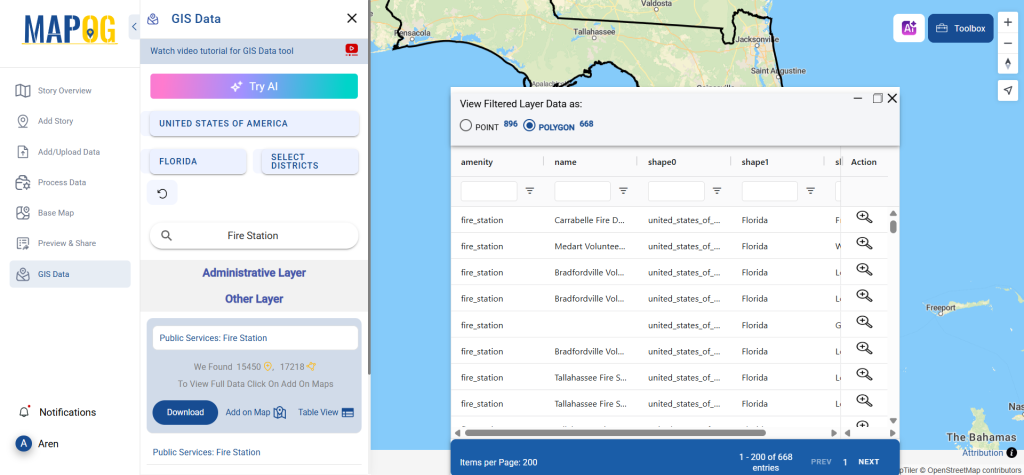
Refine your search using the Filter Data option. This allows users to select specific states, cities, or districts, ensuring precise results. Filtering data enhances accuracy, making it useful for regional healthcare analysis and planning.
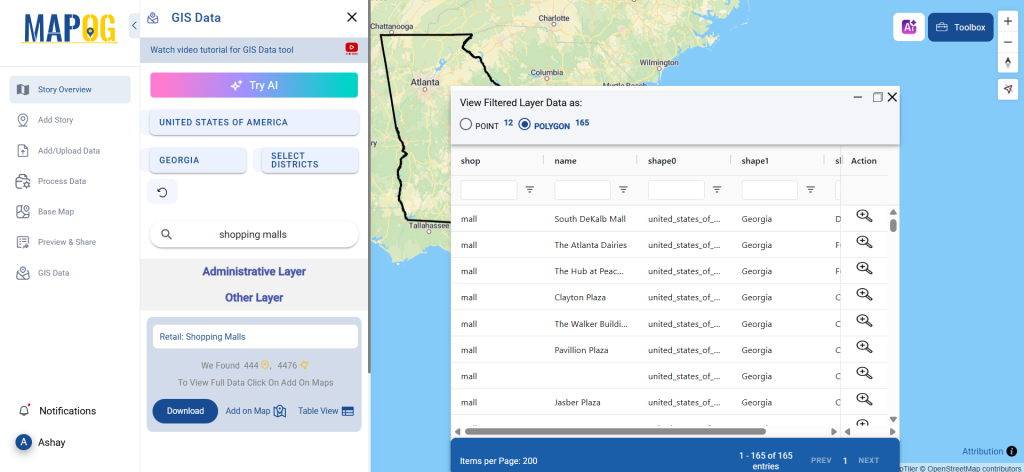
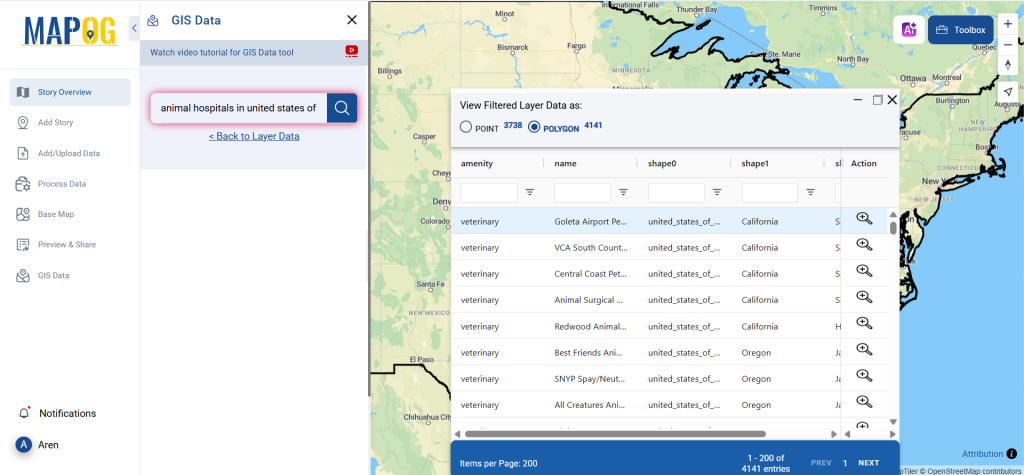
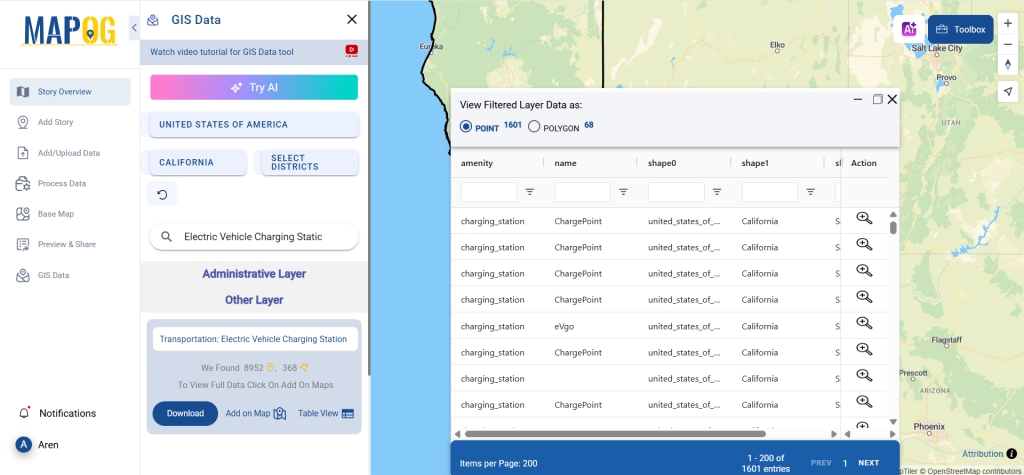
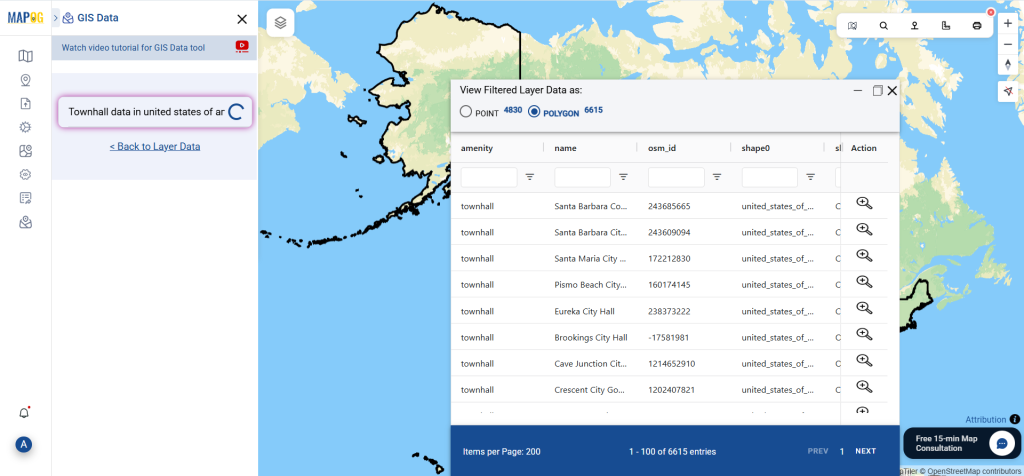
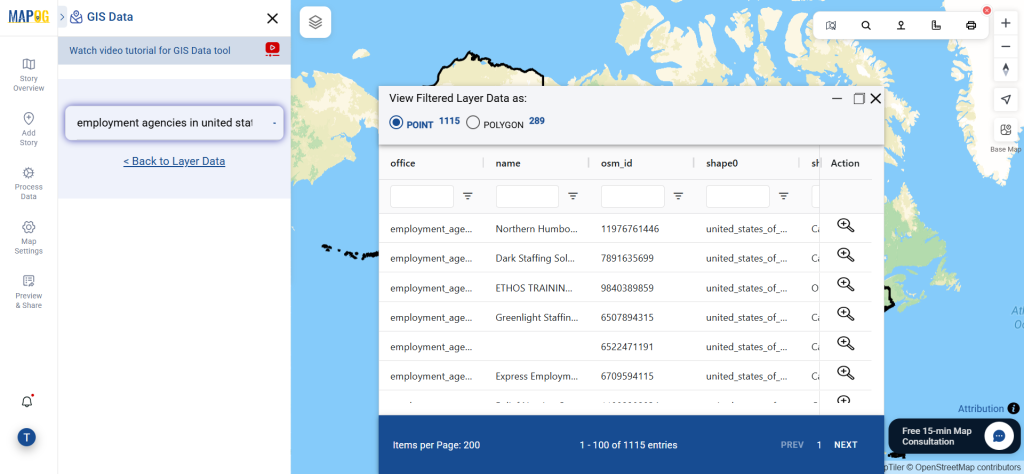
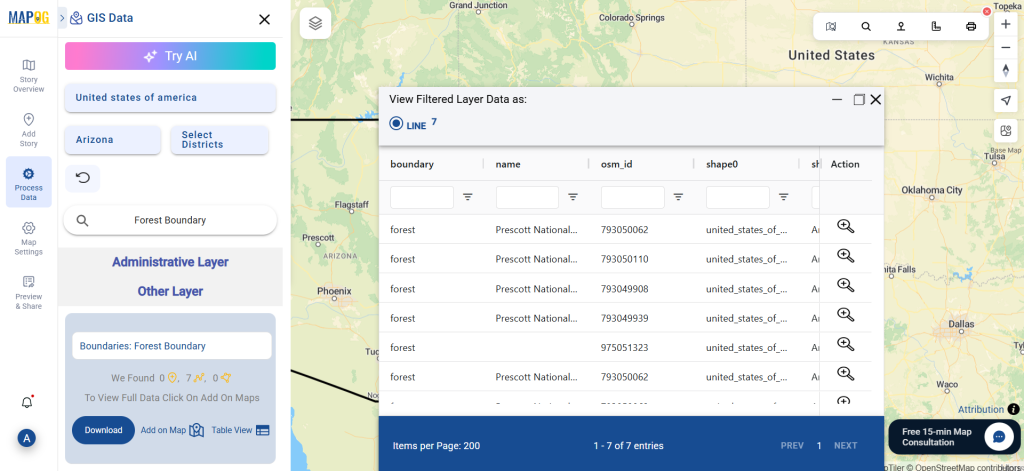
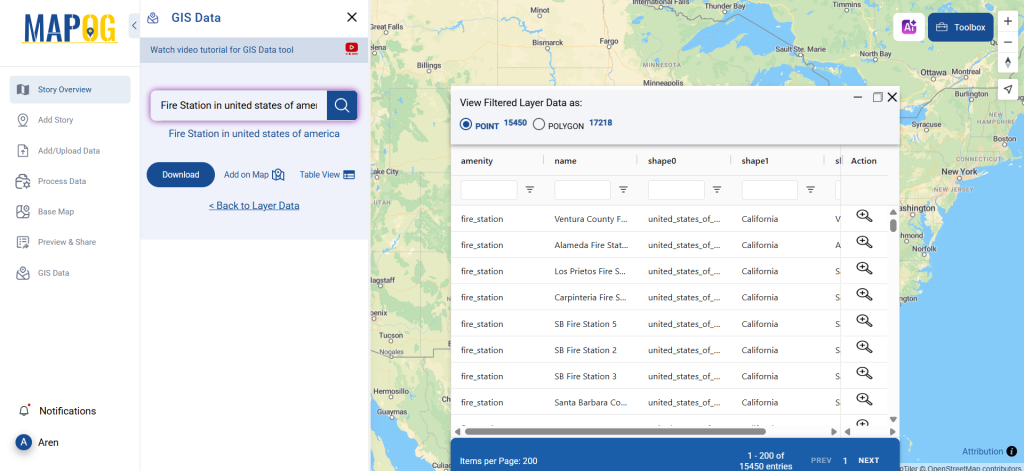
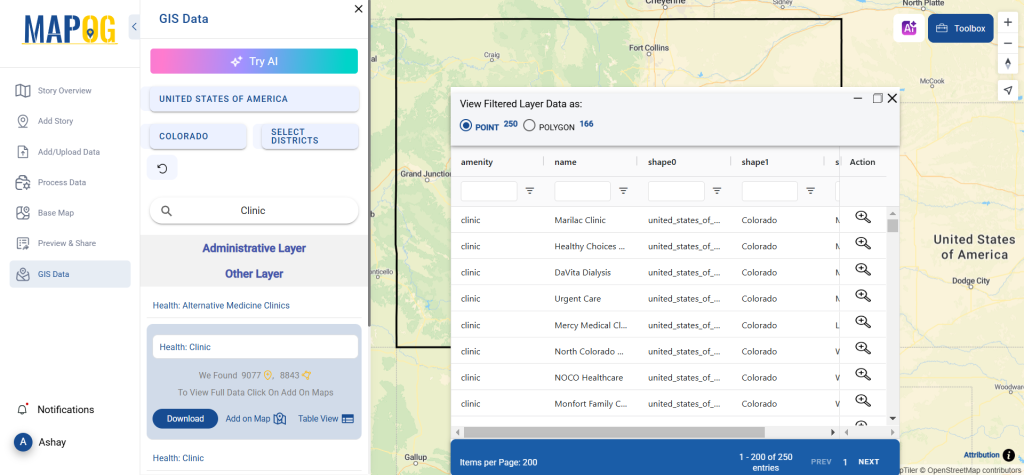
Step 4: Add to Map for Visualization
With the “Add on Map” feature, users can overlay clinic data onto a map for spatial analysis. By clicking on this option, they can either create a new map or integrate the dataset into an existing GIS project for deeper insights.
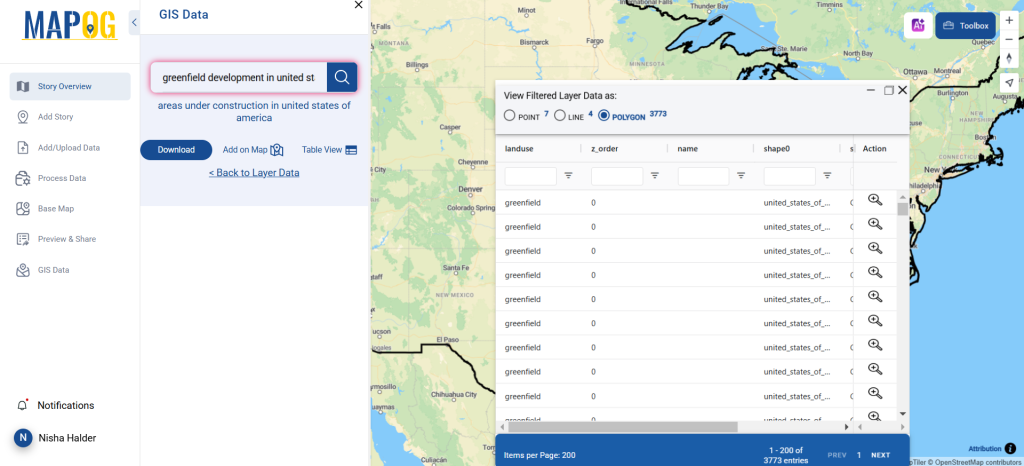
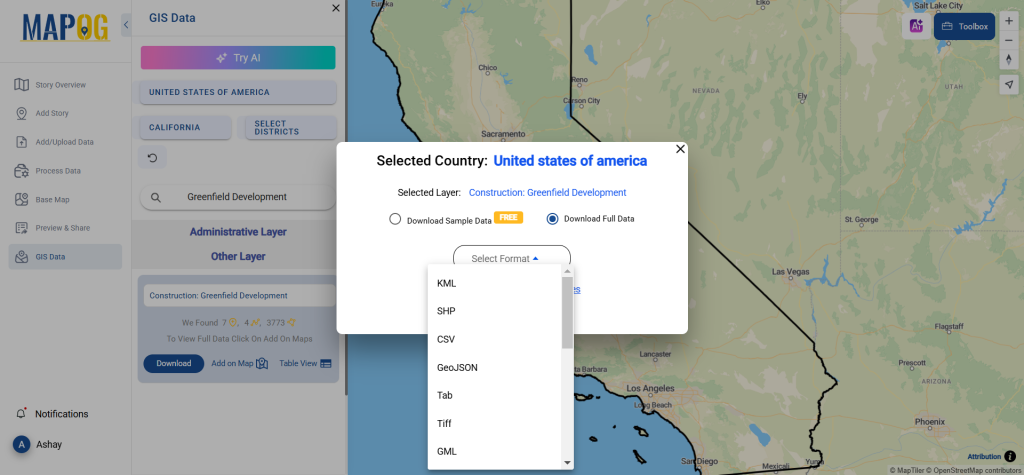
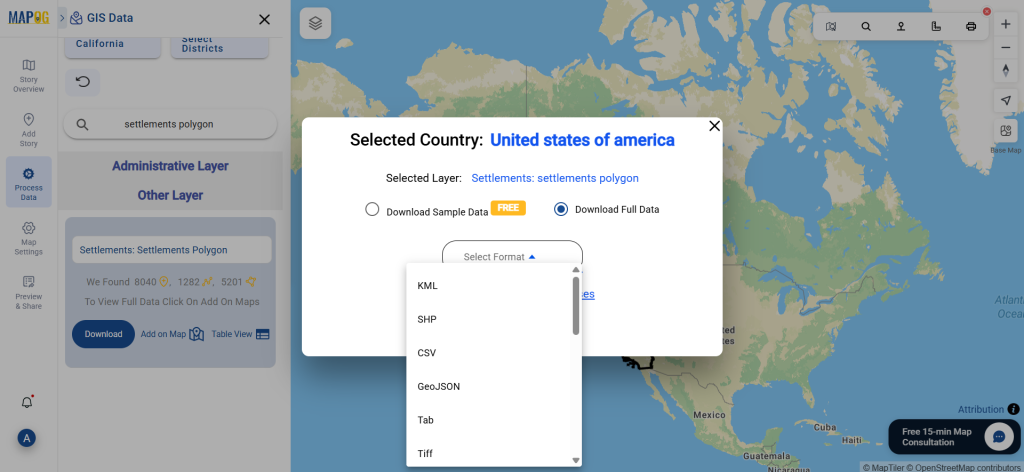
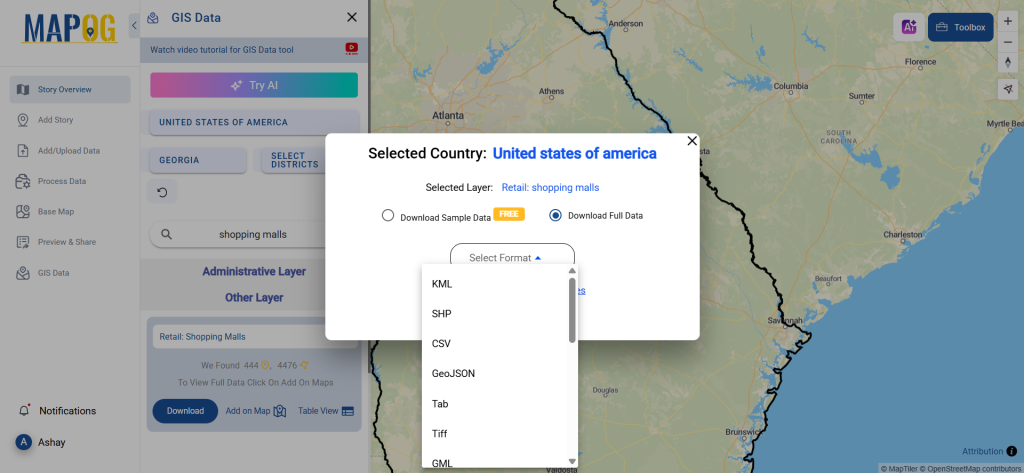
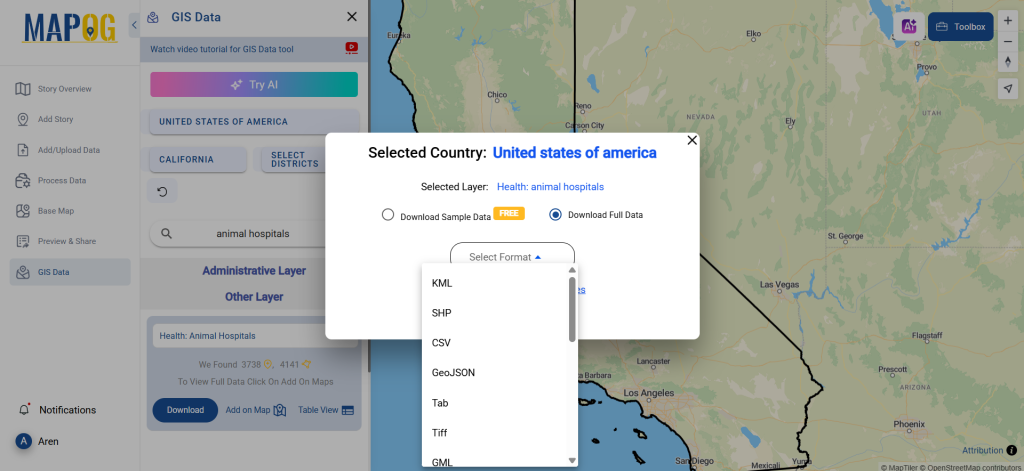
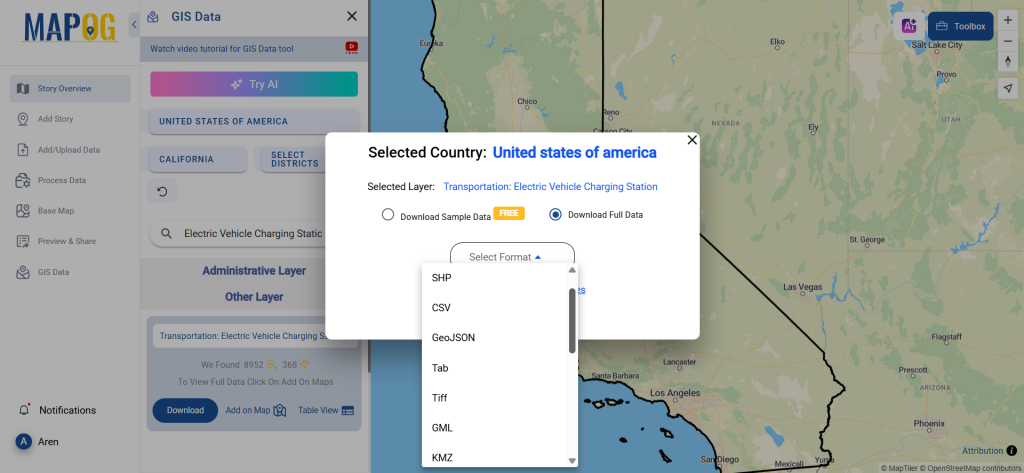
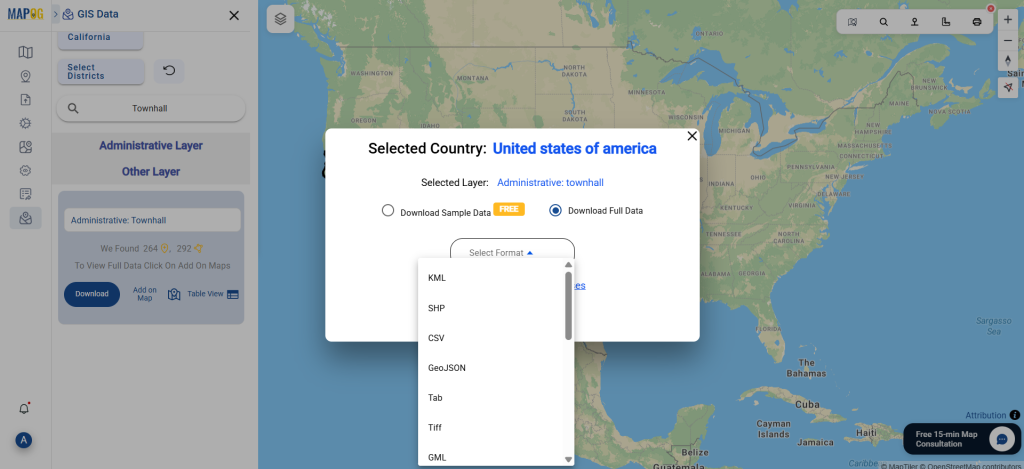
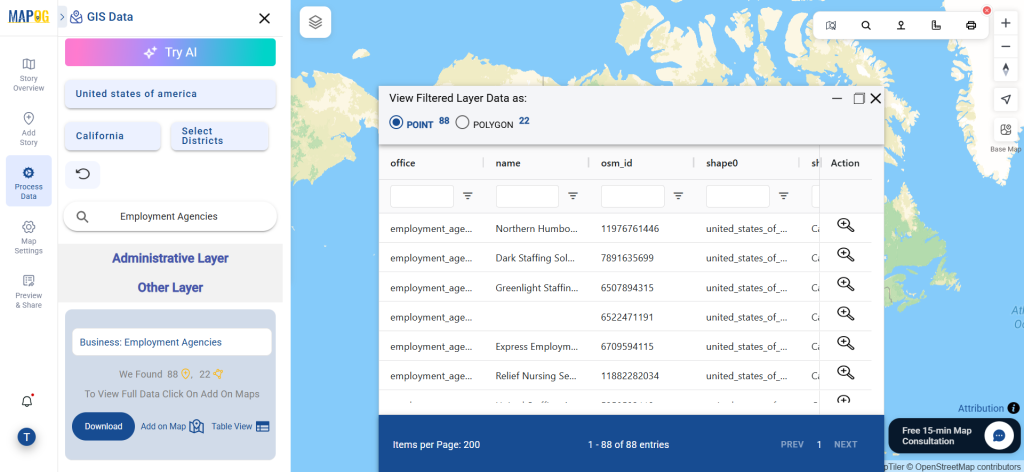
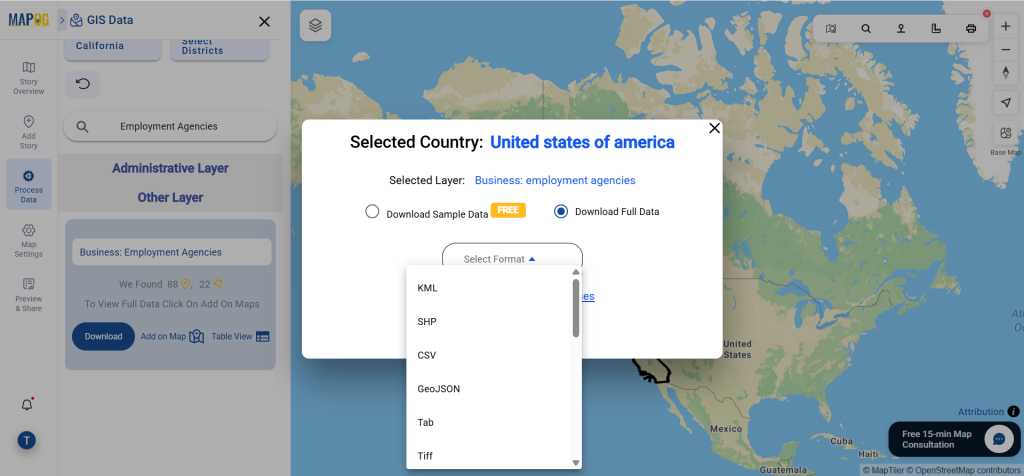
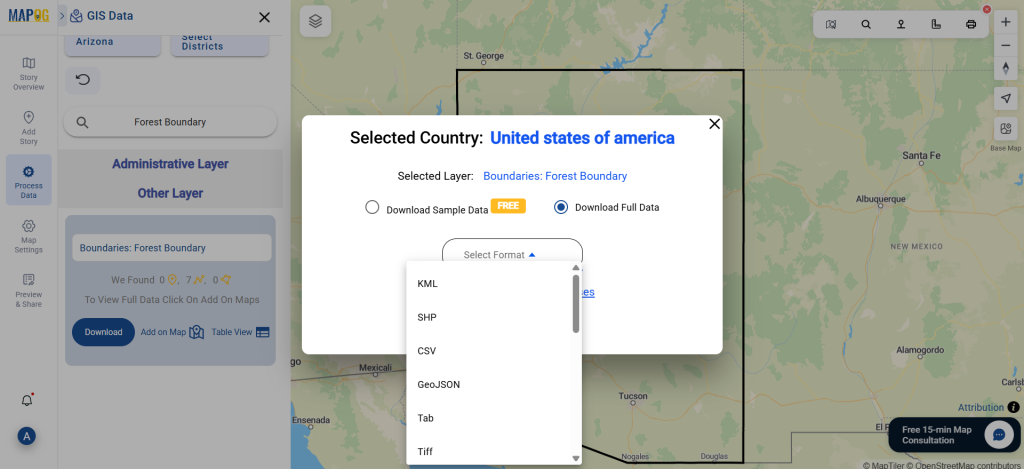
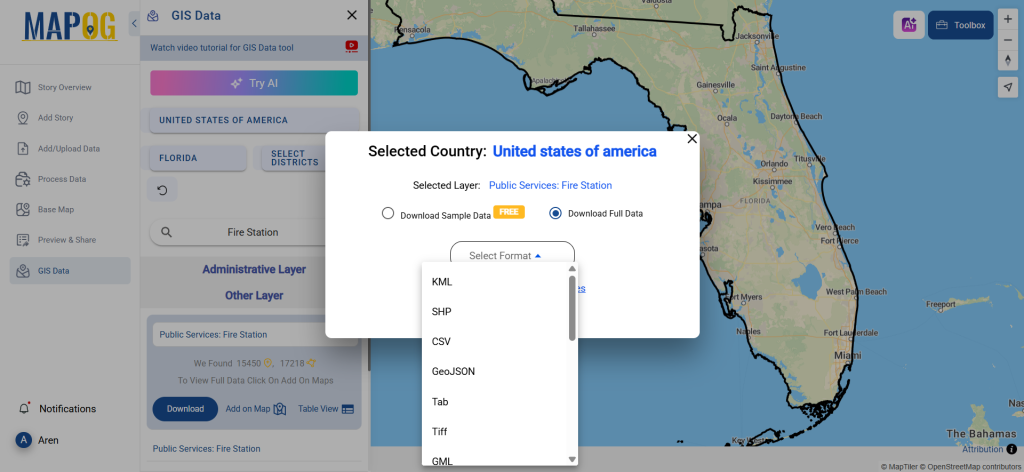
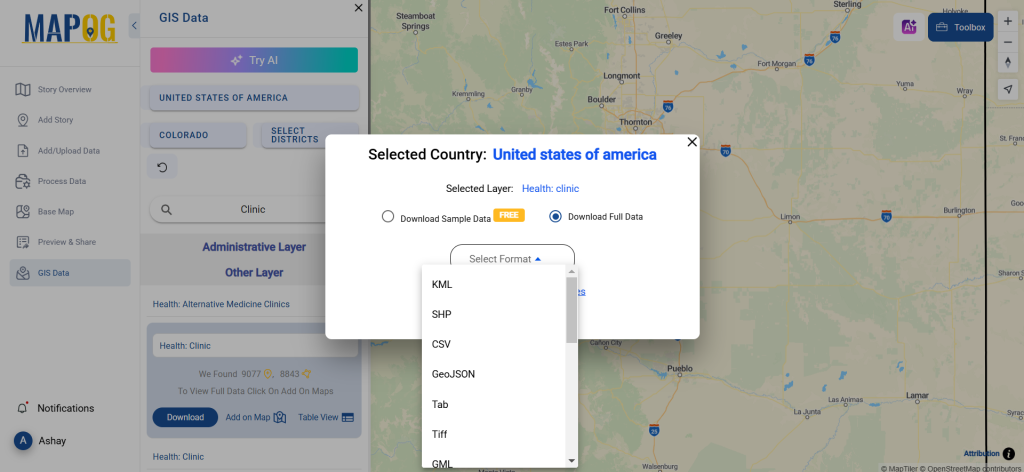
Step 5: Download Clinic Data in Preferred Format
Click the “Download Data” button. Choose between sample data or the full dataset based on requirements. Select the format you need, such as Shapefile, KML, or GeoJSON. Accept the terms and conditions, then proceed with the final download.
Conclusion
GIS Data by MAPOG makes it easy to download clinic data in multiple GIS formats. With precise location-based data, users can enhance healthcare planning, accessibility analysis, and emergency preparedness. Whether for government agencies, research institutions, or urban planners, MAPOG provides a valuable resource for healthcare mapping.
With MAPOG’s versatile toolkit, you can effortlessly upload vector and upload Excel or CSV data, incorporate existing layers, perform polyline splitting, use the converter for various formats, calculate isochrones, and utilize the Export Tool.
For any questions or further assistance, feel free to reach out to us at support@mapog.com. We’re here to help you make the most of your GIS data.
Download Shapefile for the following:
- World Countries Shapefile
- Australia
- Argentina
- Austria
- Belgium
- Brazil
- Canada
- Denmark
- Fiji
- Finland
- Germany
- Greece
- India
- Indonesia
- Ireland
- Italy
- Japan
- Kenya
- Lebanon
- Madagascar
- Malaysia
- Mexico
- Mongolia
- Netherlands
- New Zealand
- Nigeria
- Papua New Guinea
- Philippines
- Poland
- Russia
- Singapore
- South Africa
- South Korea
- Spain
- Switzerland
- Tunisia
- United Kingdom Shapefile
- United States of America
- Vietnam
- Croatia
- Chile
- Norway
- Maldives
- Bhutan
- Colombia
- Libya
- Comoros
- Hungary
- Laos
- Estonia
- Iraq
- Portugal
- Azerbaijan
- Macedonia
- Romania
- Peru
- Marshall Islands
- Slovenia
- Nauru
- Guatemala
- El Salvador
- Afghanistan
- Cyprus
- Syria
- Slovakia
- Luxembourg
- Jordan
- Armenia
- Haiti And Dominican Republic
- Malta
- Djibouti
- East Timor
- Micronesia
- Morocco
- Liberia
- Kosovo
- Isle Of Man
- Paraguay
- Tokelau
- Palau
- Ile De Clipperton
- Mauritius
- Equatorial Guinea
- Tonga
- Myanmar
- Thailand
- New Caledonia
- Niger
- Nicaragua
- Pakistan
- Nepal
- Seychelles
- Democratic Republic of the Congo
- China
- Kenya
- Kyrgyzstan
- Bosnia Herzegovina
- Burkina Faso
- Canary Island
- Togo
- Israel And Palestine
- Algeria
- Suriname
- Angola
- Cape Verde
- Liechtenstein
- Taiwan
- Turkmenistan
- Tuvalu
- Ivory Coast
- Moldova
- Somalia
- Belize
- Swaziland
- Solomon Islands
- North Korea
- Sao Tome And Principe
- Guyana
- Serbia
- Senegal And Gambia
- Faroe Islands
- Guernsey Jersey
- Monaco
- Tajikistan
- Pitcairn
Disclaimer : The GIS data provided for download in this article was initially sourced from OpenStreetMap (OSM) and further modified to enhance its usability. Please note that the original data is licensed under the Open Database License (ODbL) by the OpenStreetMap contributors. While modifications have been made to improve the data, any use, redistribution, or modification of this data must comply with the ODbL license terms. For more information on the ODbL, please visit OpenStreetMap’s License Page.
Here are some blogs you might be interested in:
- Download Airport data in Shapefile, KML , MIf +15 GIS format – Filter and download
- Download Bank Data in Shapefile, KML, GeoJSON, and More – Filter and Download
- Download Railway data in Shapefile, KML, GeojSON +15 GIS format
- Download Farmland Data in Shapefile, KML, GeoJSON, and More – Filter and Download
- Download Pharmacy Data in Shapefile, KML, GeoJSON, and More – Filter and Download
- Download ATM Data in Shapefile, KML, MID +15 GIS Formats Using GIS Data by MAPOG
- Download Road Data in Shapefile, KML, GeoJSON, and 15+ GIS Form