Flight Routes Network Analysis. When we think of Network analysis in GIS we think of roads, rivers, water lines etc. In GIS two types of network are modeled. i.e:
1.) Transportation Network for example road networks and
2.) Utility Network for example gas pipeline network.
In transportation network model analysing air transportation network is a fascinating network visualisation exercise.
FLIGHT ROUTES NETWORK ANALYSIS
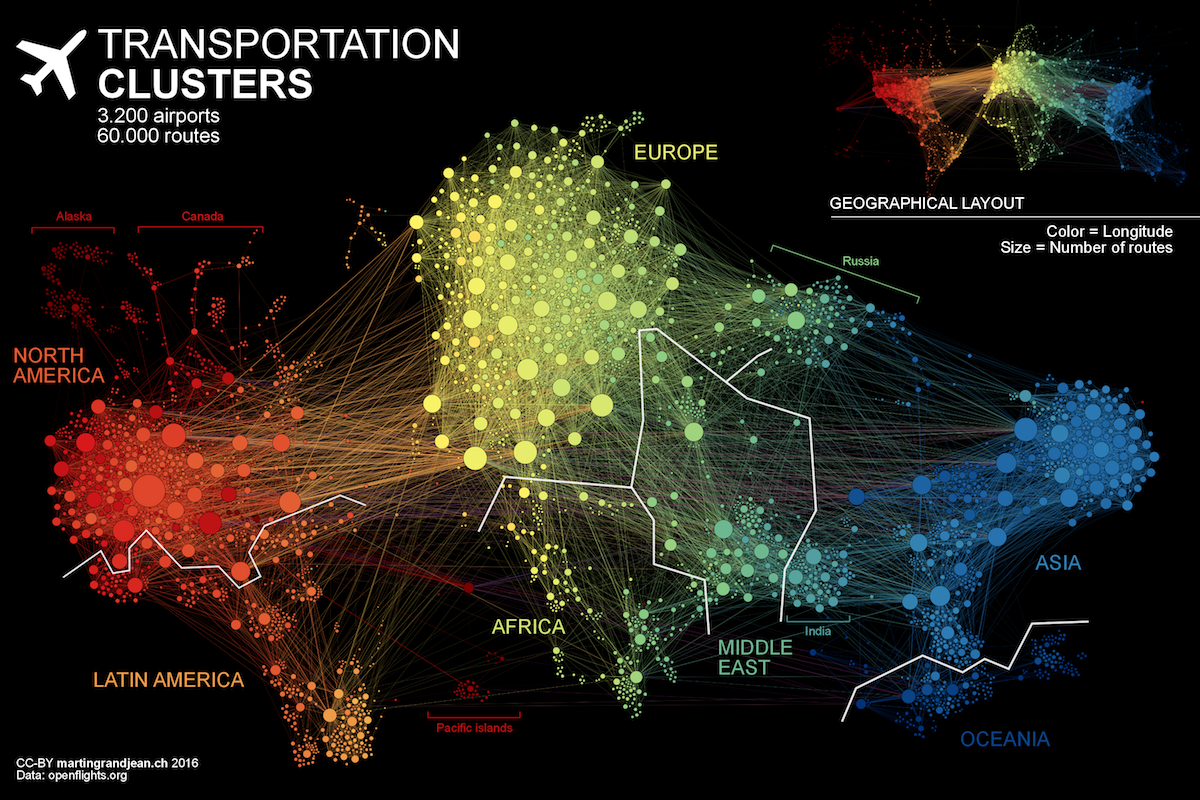
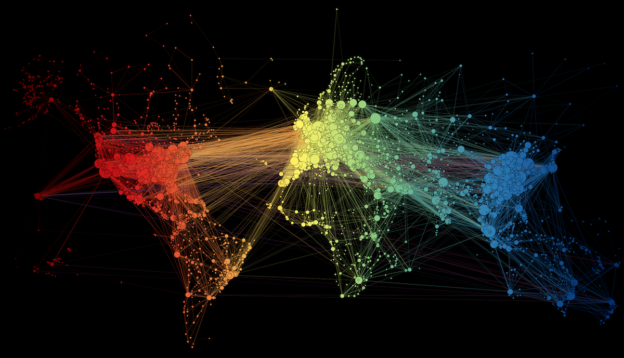
Force-directed graph drawing algorithms are a class of algorithms for drawing graphs in an aesthetically pleasing way. This algorithm used by Martin Grandjean a researcher from The University of Lausanne, Switzerland to analyze the air transportation network created by 100,000 airline flights that take place around the world. Data for this analysis of the 3,275 airports across the globe was taken from openFlights.org.
A map showing flight routes between these airports is a network graph. Martin Grandjean attempts to make explicit the network behind air transport. The structure of the relationships has an impact on the spatial distribution of nodes in a graph. Let’s see how this landscape is reorganized without geographical constraints.

Explanation of the above image: “Naturally, network geography is not completely disrupted: the continents are mostly visible and regions are generally in their original position (with the exception of the Pacific islands that connect Asia and America – imagine this graph in three dimensions, with the Pacific Ocean behind). Major observations: India is more connected to the Middle East than to South and East Asia. The Russian cluster is very visible, connecting airports in Russia but also in many former Soviet republics. Latin america is clearly divided between a South cluster and a Central American cluster very connected with the U.S.”
I found this information very fascinating, to know the way for Flight Routes Network Analysis.
