Download Algeria Administrative Boundary Shapefiles – National, Districts, Municipalities and more

Algeria Shapefile Download Map – Free Polygon Administrative Download. Shapefiles showing Districts , Municipalities and Town and Cities.

Have you been searching too long for accurate GIS data for your country of interest? Well the wait is over with MAPOG, your one-stop destination for comprehensive GIS data covering 150+ countries. You can find more than 150 GIS data for each nation in MAPOG GIS Data Collection. The distinctive feature of MAPOG GIS data collection lies in its commitment to providing highly accurate GIS data of the administrative divisions. Users can also find data of other natural and man made geographic features such as river, roads, railway lines, airport locations etc. that are represented in appropriate geometric structures (point, line and polygon). MAPOG provides two important tools for accessing these GIS datasets – Download GIS Data and Add GIS Data.

With MAPOG’s versatile toolkit, you can effortlessly upload vector and raster filesadd WMS (Web Map Service) layers, upload Excel or CSV data, incorporate existing files, perform polygon splitting and merging, generate new polygon and polyline data, use the converter for various formats, conduct buffer analysiscreate gridstransform points into polygons, calculate isochrones, and utilize the geocoder for precise location information.

We offer an extensive array of data formats, including KML, SHP, CSV, GeoJSON, Tab, SQL, Tiff, GML, KMZ, GPKZ, SQLITE, Dxf, MIF, TOPOJSON, XLSX, GPX, ODS, MID, and GPS, ensuring compatibility and accessibility for various applications and analyses.

Note:

  • All data available are in GCS datum EPSG:4326 WGS84 CRS (Coordinate Reference System).
  • You need to login for downloading the shapefile.

Download Shapefile Data of Algeria

Algeria is bordered to the northeast by Tunisia; to the east by Libya; to the southeast by Niger; to the southwest by Mali, Mauritania, and Western Sahara; to the west by Morocco; and to the north by the Mediterranean Sea. It is considered part of the Maghreb region of North Africa. It has a semi-arid geography, with most of the population living in the fertile north and the Sahara dominating the geography of the south. Algeria covers an area of 2,381,741 square kilometres (919,595 sq mi), making it the world’s, tenth largest nation by area and the largest nation in Africa, more than 200 times as large as the continent’s smallest country, The Gambia. With a population of 44 million, Algeria is the tenth-most populous country in Africa, and the 32nd most populous country in the world. The capital and largest city is Algiers, located in the far north on the Mediterranean coast.
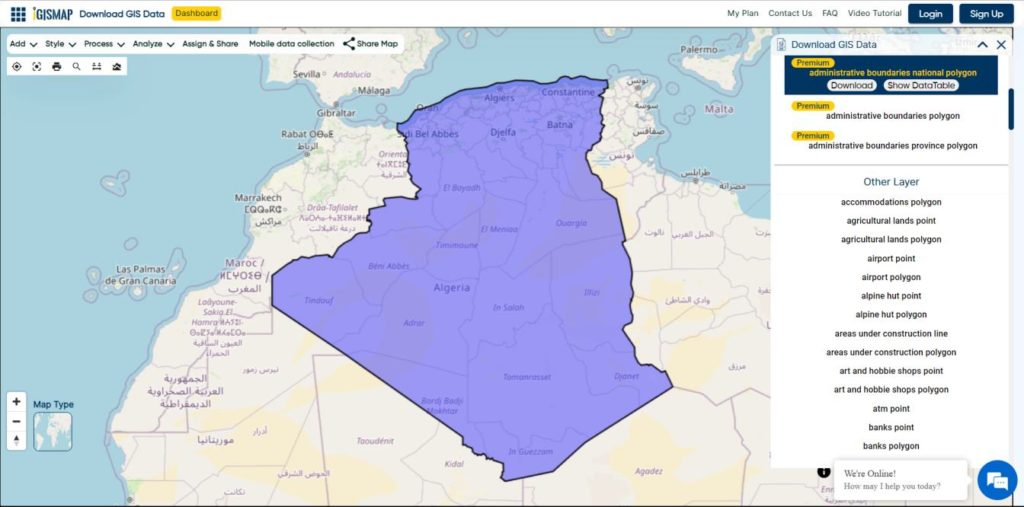
Algeria National Boundary

Download Algeria National Boundary Shapefile

Download Algeria Districts Shapefile Data

Algeria’s districts were created as arrondissements when Algeria was a colony of France and they had a status equal to those of mainland France. They were, like France’s arrondissements, part of departements, which are further part of a région (which was called a territory, territoire, in French Algeria). They were maintained 6 years after the country’s independence (until 1968) when they were renamed “daïras” and had their functions slightly changed.
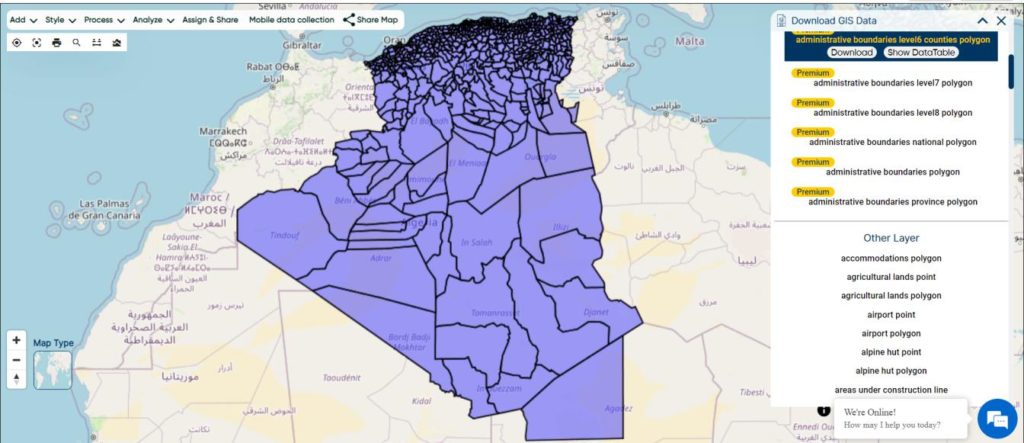
Algeria Districts Boundaries

Download Algeria Districts Boundaries Shapefile

Download Algeria Municipalities Shapefile Data

The municipalities of Algeria form the third level of administrative subdivisions of Algeria. As of 2002, there were 1,541 municipalities in the country.
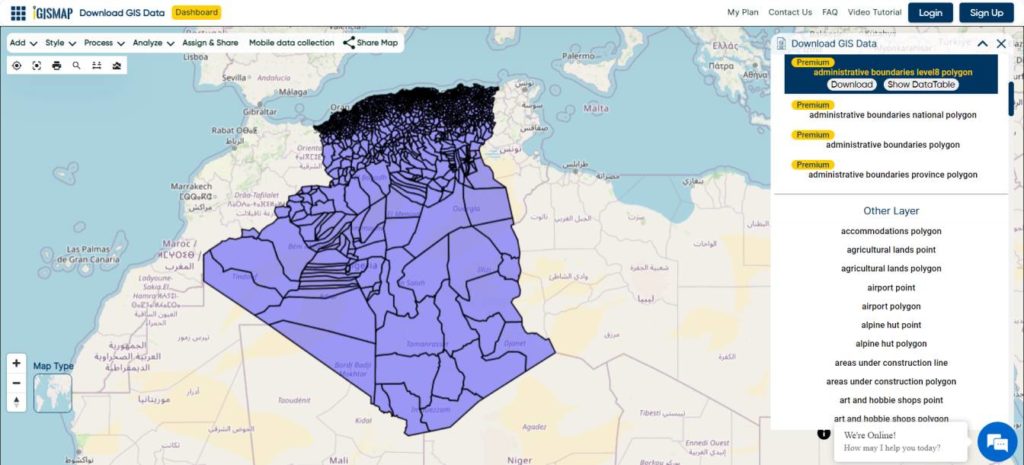
Algeria Municipalities Boundaries

Download Algeria Municipalities Boundaries Shapefile

Other Administrative Boundary Data:

Other GIS Data:

Download Shapefile for the following:

  1. World Countries Shapefile
  2. Australia
  3. Argentina
  4. Austria
  5. Belgium
  6. Brazil
  7. Canada
  8. Denmark
  9. Fiji
  10. Finland
  11. Germany
  12. Greece
  13. Greenland
  14. India
  15. Indonesia
  16. Ireland
  17. Italy
  18. Japan
  19. Kenya
  20. Lebanon
  21. Madagascar
  22. Malaysia
  23. Mexico
  24. Mongolia
  25. Netherlands
  26. New Zealand
  27. Nigeria
  28. Papua New Guinea
  29. Philippines
  30. Poland
  31. Russia
  32. Singapore
  33. South Africa
  34. South Korea
  35. Spain
  36. Switzerland
  37. Tunisia
  38. United Kingdom Shapefile
  39. United States of America
  40. Vietnam
  41. Norway
  42. Chile
  43. Crotia

Disclaimer : If you find any shapefile data of country provided is incorrect do contact us or comment below, so that we will correct the same in our system as well we will try to correct the same in openstreetmap.
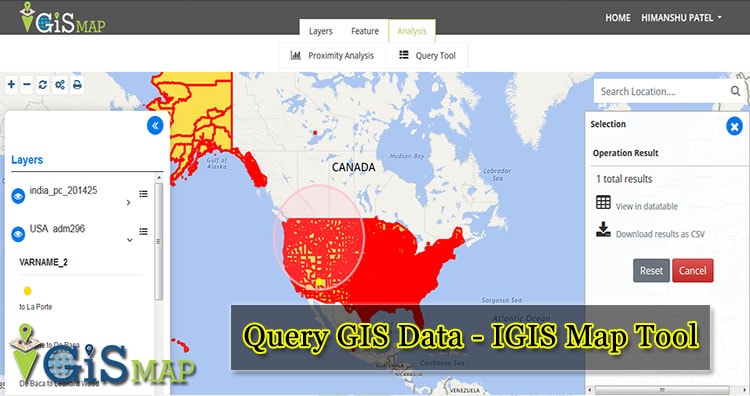
Query GIS Data – IGIS Map Tool – Now known as MAPOG

To Query GIS Data easily with IGIS map tool, we can use the Query tool.  A GIS query tool, or selection tool as it is often know, allows us to filter a dataset based on criteria that we define.

Querying in IGIS Map Tool allows user to explore your data with rule based queries. User can discover their features of interest contained within the map by querying. IGIS Map tool allow users to build their own queries that we may not have envisaged when we first created the map. It also query GIS data according to their choice.

Query GIS Data – MapOG Tool

Query tools allow maps users to do more than what the map maker envisioned when they styled the layers. Here are the few steps to be followed for querying the map.

Query GIS data

  • Upload dataset and create a new map project Or Open your existing map project.
  • Or Download GIS data for analysis

Query GIS Data

  • Select the “Query tool” option on the Analysis Section.

  • Select the Layer to query GIS data.

Query GIS Data

All the layers in your map are available in this section, you just need to select the layer in which you want to query in.

  • Confirm a shape i.e. circle , rectangle or polygon to draw a query.

User just need to select the shape and start drawing the shape on the map to query the data. similarly as above image shows the queried data as highlighted which is queried by a rectangle.

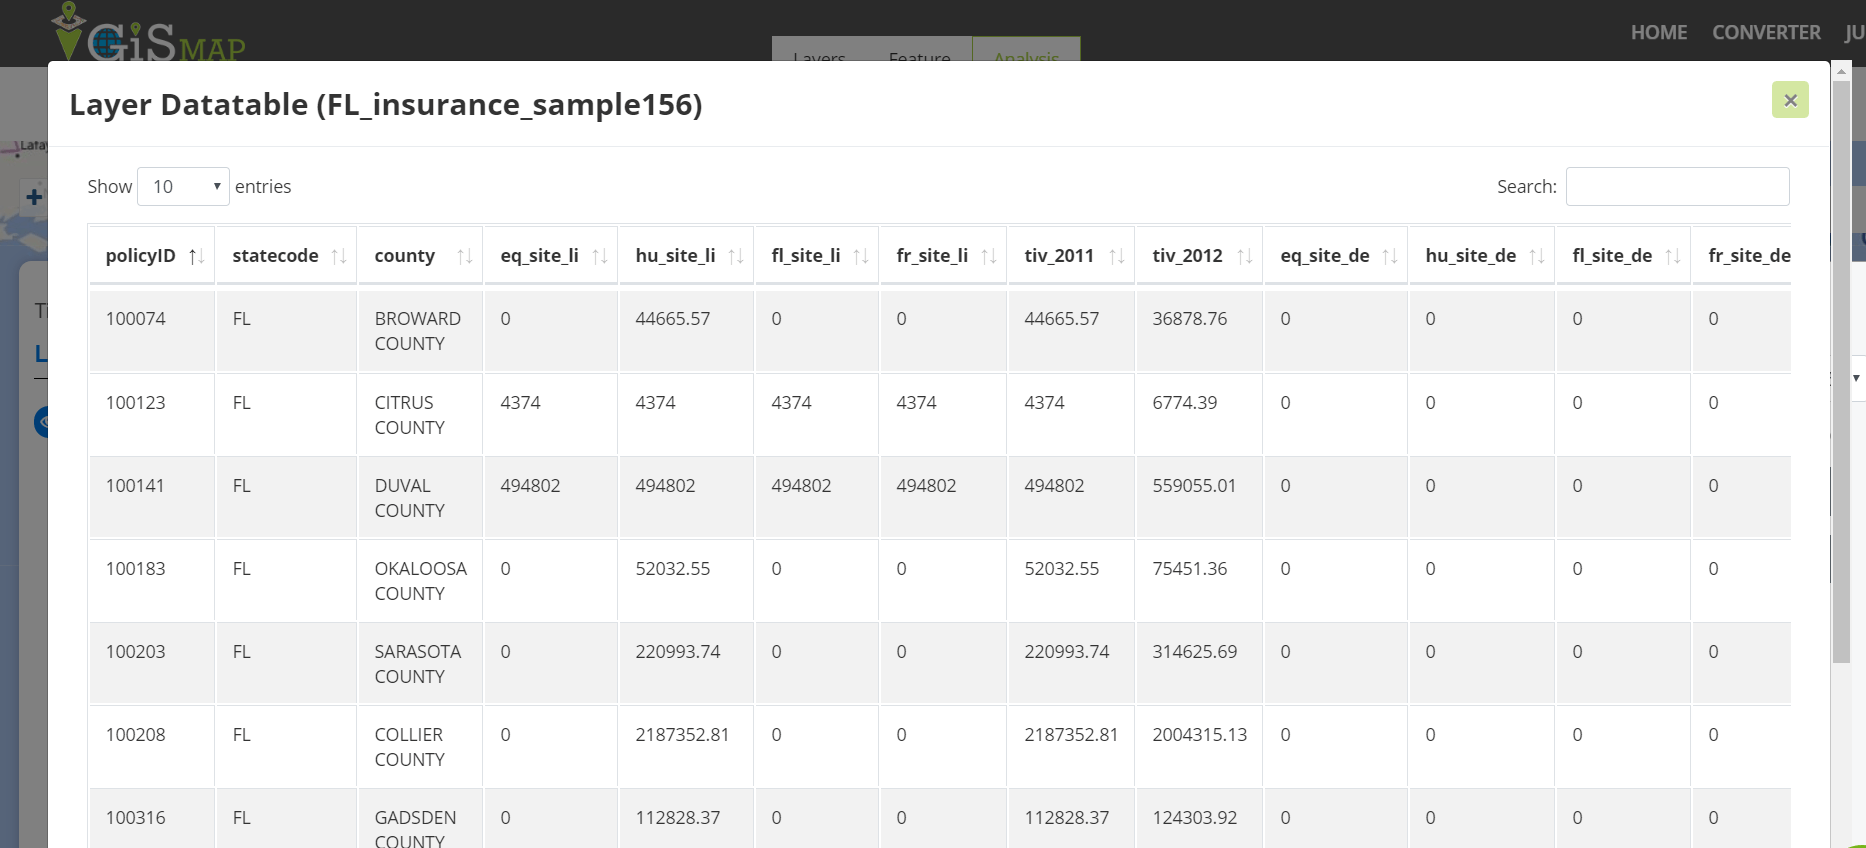
  • Click on the Get result button after drawing the shape. You can view the result in as tables and also download them as CSV Format.

Query GIS Data

This is how you can Query GIS Data with the IGIS Map Tool in a minute. Query tools allow maps users to do more than what the map maker envisioned when they styled the layers.

IGIS Map Query Tool can be used in various sectors like Insurance, Banking, Risk Management etc. There are also other query tools available in the market.  mapOG tool however, is a much better choice to Query GIS Data if you want to share your maps with a larger, more distributed audience.

This may help you to Query GIS Data with IGIS Map Tool. If you find any problem in creating one such example do let us know by commenting below.

Insurance Management GIS Web/App Development – Cost, Time – Map Tool

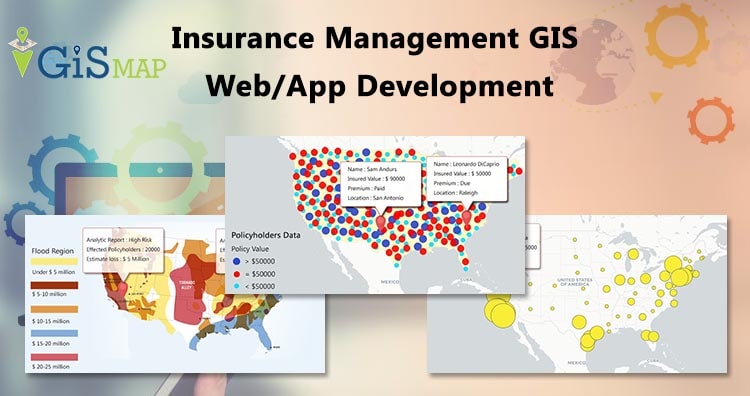
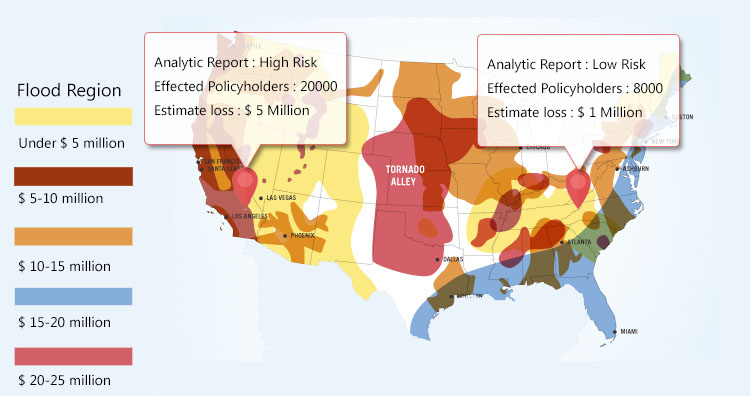
In this blog post we describe a detailed overview of Insurance Management GIS Web/App Development tool’s Requirement, Time, Technology and functionality. Insurance Management GIS map tool provides you every location-based insight you need and It can also be used as Risk Manager as It uses smart maps, data analysis and all of the features for controlling risks and managing business strategies of Insurance companies.

Why one should Build Interactive Insurance Management GIS Map Tool:

  • For Understanding and Improving Key Performance of Insurance Business with GIS Tool:

    1. Risk Assessment : Insurance Management GIS Map Tool exposes the exact location of risk for the Insurance companies with the interactive maps and helps in target the limited capital to higher opportunity or areas of lower risk. Our tool provides you insights that supports data-driven decision-making and more effective business strategy.
    2. Comparing Business Measures : You can easily map business measures and compare them with the help of Insurance Management GIS Map Tool. It can validate various locations and  visualize loss patterns on an interactive and beautiful maps.
    3. Territory Management: Insurance Management GIS Map Tool helps companies in their territory management and our analysis shows how geography interacts with hazards and assets to help companies limit risk. Insurance Management GIS Map Tool helps you implanting and deploying the networks necessary to operate efficiently in your territory.

Insurance Management GIS Web/App Development – Cost, Time - Map Tool

  • For Response Planning and management of Insurance with GIS Tool:

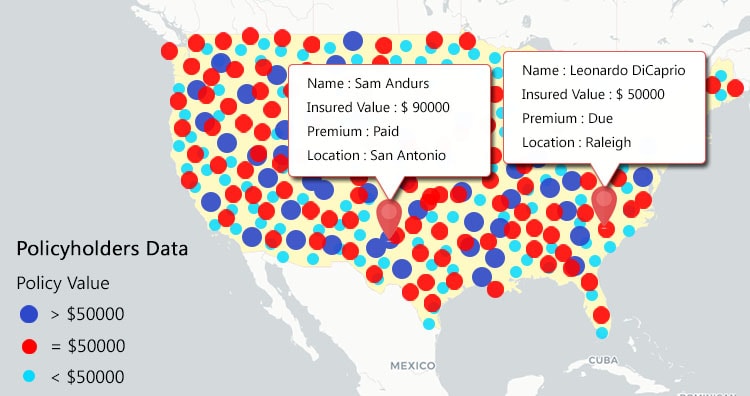
    1. Manage your Policyholders on interactive map :  You can manage your Policyholders on the maps according to their location. you can handle the location details, description, insured values and your client’s network as according to your strategy by using the tool.
      Insurance Management GIS Web/App Development – Cost, Time - Map Tool
    2. Disaster analysis: Our tool reduces your companies progressive risk loss with the interactive maps. As these maps, data analytics ensures that you understand risk and make effective management plans.
      Insurance Management GIS Web/App Development – Cost, Time - Map Tool
    3. Management: An Interactive Insurance Management GIS Map Tool’s maps and spatial data analysis exposes the risk nearness that helps in improving the risk score accuracy. when natural disasters happens and losses occur, Insurers needs to respond to incidents quickly and efficiently for the policyholders and for that this tool lets you quickly visualize events on the map with advanced analytics to prioritize response execution and plan for claims handling prior to catastrophic events.

Scope of Insurance Management GIS Web/App Development:

Insurance sector is facing broad changes driven by a convergence of of business and technology forces fuelled by innovation. Insurance companies have immense desires of data to make better decisions and to utilize the data for risk management, companies use strong geographic component. From managing the addresses of policyholders to the location of risk to the logistics of handling claims, GIS benefits the companies most.

In Insurance Management GIS Map Tool policyholders location decides the insured value and importance of claims and how it will be processed. GIS is used as a valuable tool in Insurance Industry. It’s all about predicting risk in the insurance industry. And insurance companies better manage risk with GIS tools which with real-time data helps improve decision-making at a quicker pace.

Insurance Management GIS Map Tool has the range of functions which allows the use of policyholders data and spatial analysis to effectively serve customers, triage claims, and monitor fraudulent activities by embracing location-based intelligence. This system allows you to integrate a large variety of data into one into one place i.e. Map, where you can analyze the incident reports with an infographic representation of policyholders, their insured values and description. This tool provides interactive maps, data analysis and all of the features for controlling risks and managing business strategies.

We provide simple and versatile Insurance Management GIS Map Tool which is backed up by live support. We upsurge your business with the sharpest technology and outstanding features.

Requirement Gathering for Insurance Management App:

        • What do client require for gis insurance tool with map?

          We have an precise idea of our client’s needs for this tool in their business, so here is a list of some main requirements we think that every client would want in their Insurance Management GIS Map Tool.

          • Proactively managing risk to improve resilience.
          • communicate data quickly and clearly.
          • Maps diversification for affordable coverage.
          • Express complex data simply and enhances understanding and comprehension.
          • Zone rating and pricing.
          • Understanding of patterns and trends over space and time.
          • Improve risk analysis, evaluation, and mitigation.
          • Summarized and interpretive conveying of statistical data
          • Identify high- and low-performing areas for sales optimization.
          • Analyze policy base to agent resources to create more effective sales territories.
          • Performing better market analysis with spatial analysis and powerful decision-making insight.
          • Visualize aggregated policyholder data at the district level and areas of high total insured value, they see locations of potential significant losses.
          • Getting professional work of captivating maps, reports and interactive web portal which distinguish you from competition.
        • Software Requirement for insurance gis map tool app:

          These are some software requirements for the implementation of the Insurance Management GIS Map Tool:

          • Server: We can use any server for this Website tool but we prefer these two servers to be precise that we will be working on:
          1. NGINX Server – Nginx is an open source web server which can handle a website with a huge amount of traffic. It is a high performance web server developed with an intention to handle websites with large number of users. Its speciality is that it can run on a minimal amount of resources and handle a large number of requests.
          2. Digital Ocean Server – Digital ocean server or ‘droplets’ is a cloud server which is designed to store and server massive amount of data while making it easy and cost effective. Digital ocean server use KVM as hyperviser and can be created in various sizes. It helps in build deploy and scale cloud application faster and more efficient

          We personally recommend using Digital Ocean Server, as it is much faster, easy and cost efficient.

          • Leaflet: With leaflet you can compute the features bounding box, create a layer group, remove or add as many marker or different layer as you want on a map. Adding vector layers, raster layers, adding wms or wfs layer (can be used to serve and render geoserver or map server layers), selecting and hovering over lat-long are some of the functionality which can be easily grabbed by leaflet js map library.
          • Database: We will be using this database for storing the Insurance Management GIS Map
            data :
          1. PostGIS/PostGreSQL : PostGIS is an open source software. It adds support for geographic objects to the PostgreSQL database. PostGIS follows the simple features for SQL specification from the Open Geospatial Consortium (OGC).
          • Mapping Systems: This is the main software component of the Insurance Management GIS Map Tool. This whole system is dependent on the web mapping of the data. For mapping the data we can use any of these two Mapping systems.
          1. Google Maps: Google Maps is the tool which is used to display geographical information on a map which is in a widely accepted standard format for digital maps.
          2. OSM (Open Street Map): OSM is the software that creates and distributes the open source graphic data of the world. OSM has no restriction of technical or legal type. It allows free access to its map images and underlying map data. All the Insurance Management data locations can be found here with the nearby entities as well.

Features of Insurance Management GIS Web/App:

      • Easy data uploading in gis tool :

        We are providing a direct interface for uploading the spatial data to generate the interactive maps. You can just upload the Policyholders locations or any disaster spatial data into the database which will present the infographic representation of the data i.e. maps. You can upload any type of data and if you have data in spreadsheet you can open our other tool IgisMap Converter and convert your data into the spatial data format and then upload it.

      • Generating Maps and Reports from insurance app :

        New maps can be generated from the maps that were customized or edited in whatever way the you wants them to be. Company can style the map according to their wishes or the client. In styling the color, popup details, markers can be changed or customized and altogether generates a new Map. Specific areas of City/County/colony can be filtered with the help of Polygon and then the Insurance Management data will be presented. You also can generate and download the pdf file or spreadsheet document data of newly generated maps representing all the data of Insurance or Disaster Management. Doing so will ensure that your teams and their clients have the most accurate and timely data in their hands.

      • Proximity Analysis from insurance management app:

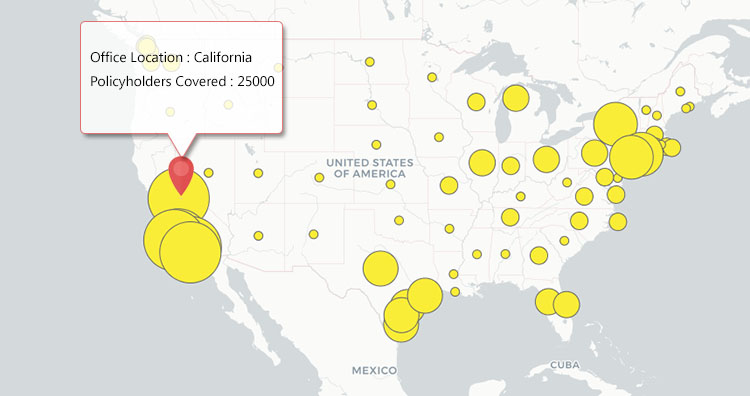
        Companies can use proximity analysis to compare and determine the relationship between selected office and the area covered by policyholders near it. Proximity analysis gives the company, the ability to more easily showcase the total no. of policyholders in the area, their premium related descriptions and advantages with risk analysis to its location.  You can visualize aggregated policyholder data at the district level and areas of high total insured value and see locations of potential significant losses. You can visualize aggregated policyholder data at the district level and areas of high total insured value and see locations of potential significant losses. You can shift your strategy to provide new, compelling, and original information to your policyholders which can pay off in many ways. Analytics reports can be generated in any format and you can download it to use it further. Proximity analysis is a crucial tool for business marketing and site selection.

Cost:

Contact us at our mail or put a comment below to discuss the expected cost.