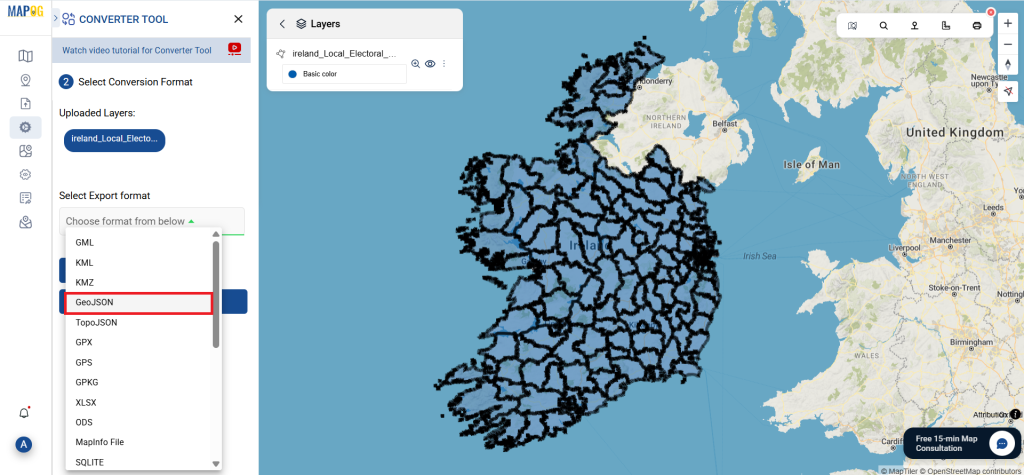
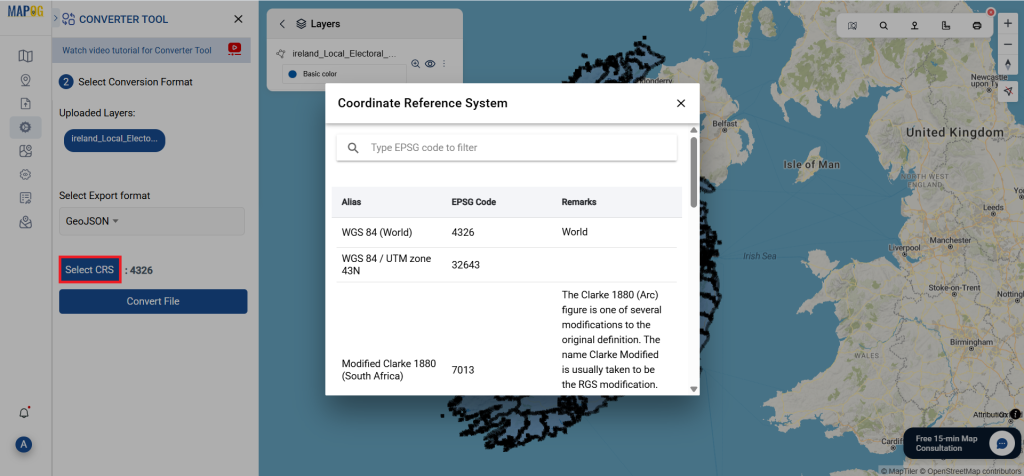
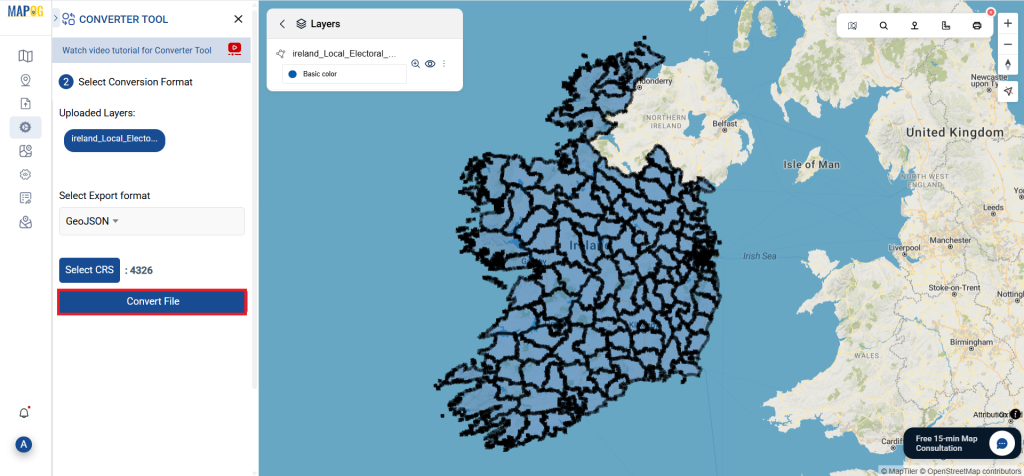
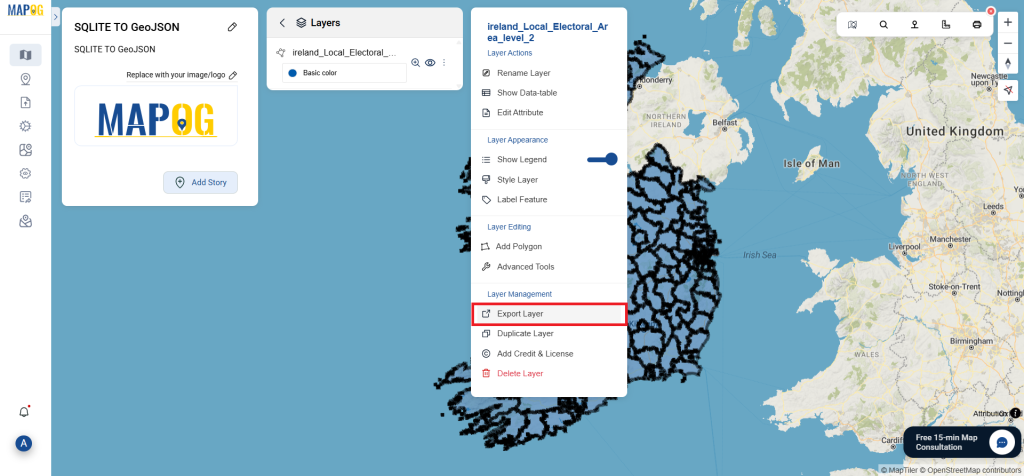
Download Iraq Administrative Boundary GIS Data – governorates Districts and more

Download Iraq’s administrative boundary GIS data, covering governorates and districts. Elevate your mapping projects with comprehensive GIS data sets.

Attention GIS enthusiasts! Exciting news from IGISMAP! We are thrilled to announce the expansion of our extensive GIS data collection with over 100 new countries, and one of them is the Republic of Iraq. Now, you can conveniently access and download essential shapefiles of administrative divisions and various geographic features of Iraq using our Download GIS Data tool. These shapefiles are offered in popular GIS formats like ESRI Shapefile, KML, GeoJSON, or CSV. Enjoy exploring and analyzing Iraq’s geographic data for your projects and research

GIS data in IGISMAP can also be accessed from Add GIS Data tool, where you can perform geospatial operations and analysis on these data in IGISMAP mapping platform itself. To know more about Add GIS Data, check the article – Add GIS data from IGISMap GIS data collection.
Note:

  • All data available are in GCS datum EPSG:4326 WGS84 CRS (Coordinate Reference System).
  • You need to login for downloading the shapefile.

Download Iraq Governorates Shapefile Data

Iraq, officially the Republic of Iraq, is a federal parliamentary republic in West Asia, consisting of 19 governorates. It shares borders with Turkey, Iran, Kuwait, Saudi Arabia, Jordan, and Syria. Baghdad is the capital and largest city. The population is diverse, with Arabs, Kurds, Turkmen, Assyrians, Armenians, Yazidis, Mandaeans, Persians, and Shabakis. Islam is the predominant religion, with minorities following Christianity, Yazidism, Mandaeism, Yarsanism, and Zoroastrianism. Arabic and Kurdish are the official languages, with Turkish, Suret, and Armenian recognized in specific regions.

Iraq comprises 19 governorates, also known as “provinces.” According to the Iraqi constitution, governorates can form autonomous regions. Four governorates, Erbil, Sulaymaniyah, Duhok, and Halabja, make up the autonomous Kurdistan Region. Baghdad and Basra are the oldest provinces, while Ninawa (Nineveh) is the second most populous with a cooler climate in the north-west.

Iraq Governorates Boundaries

Download Iraq Governorates Shapefile

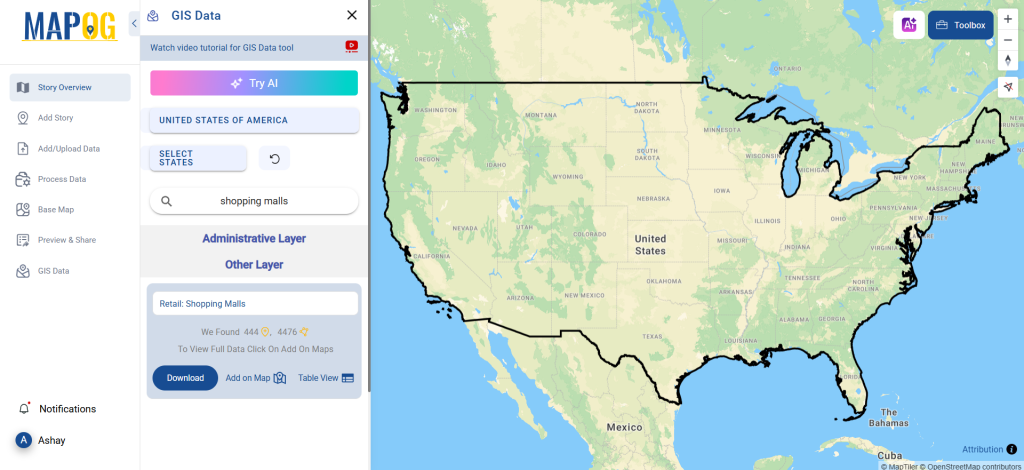
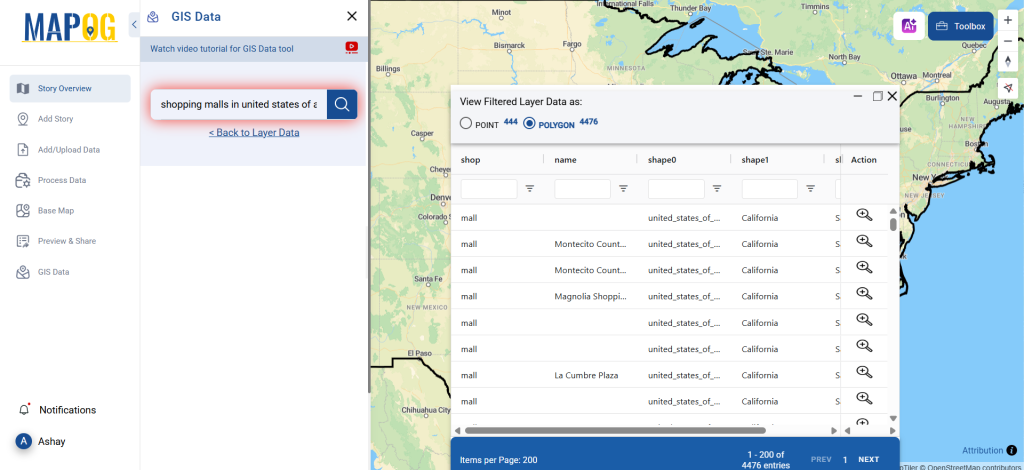
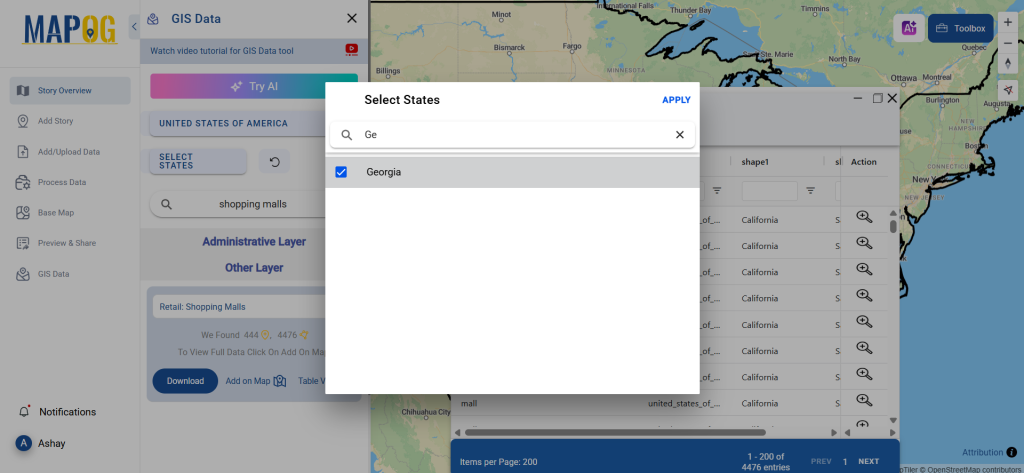
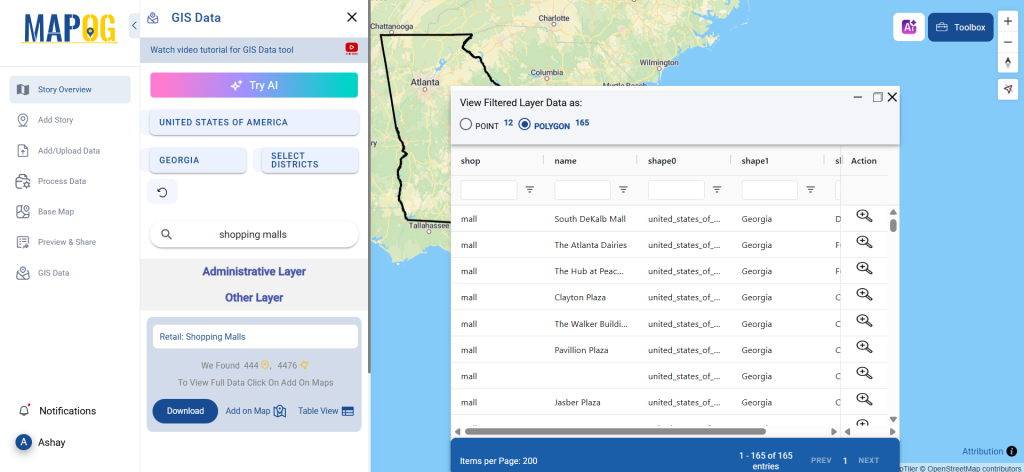
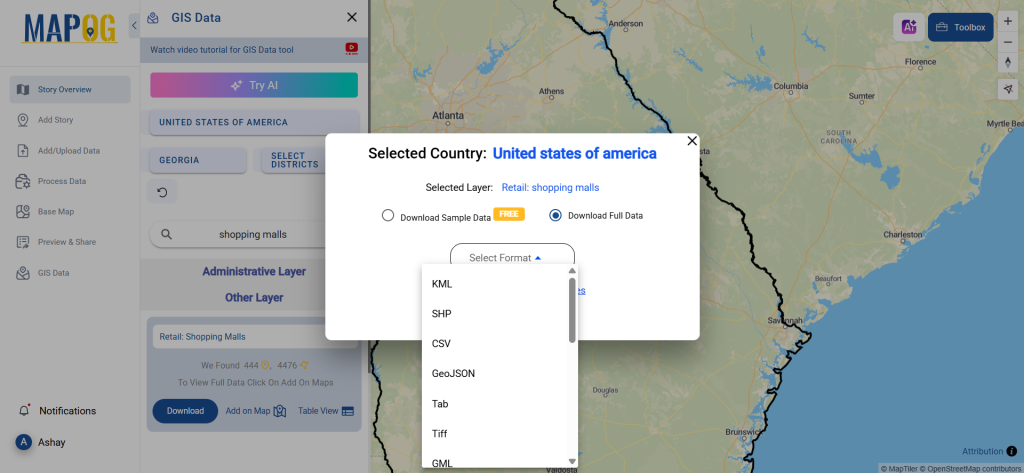
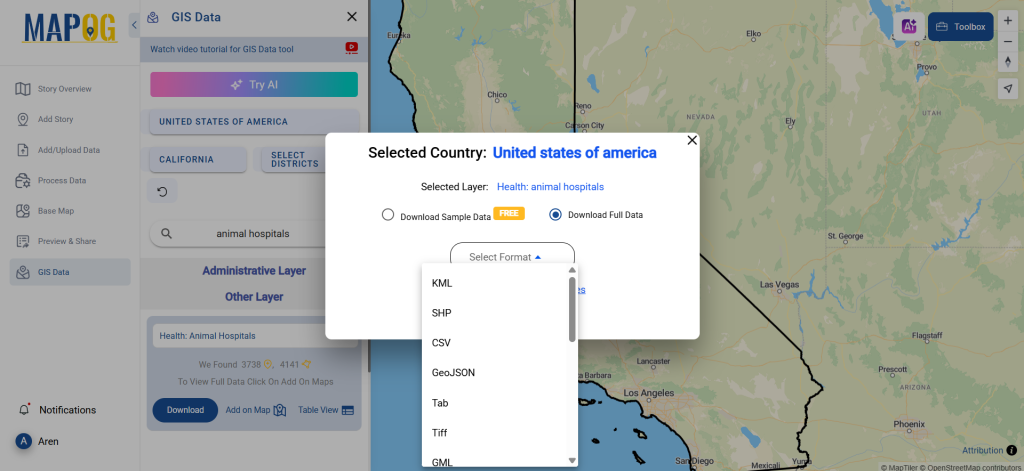
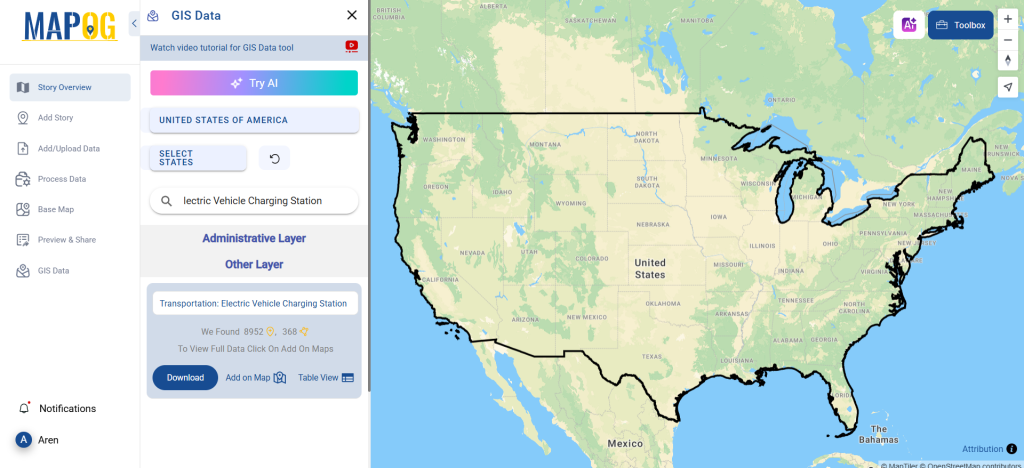
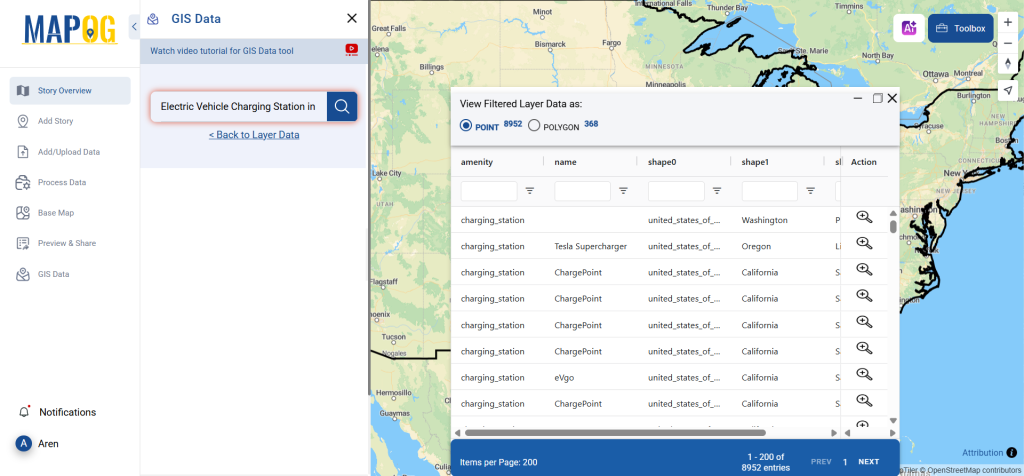
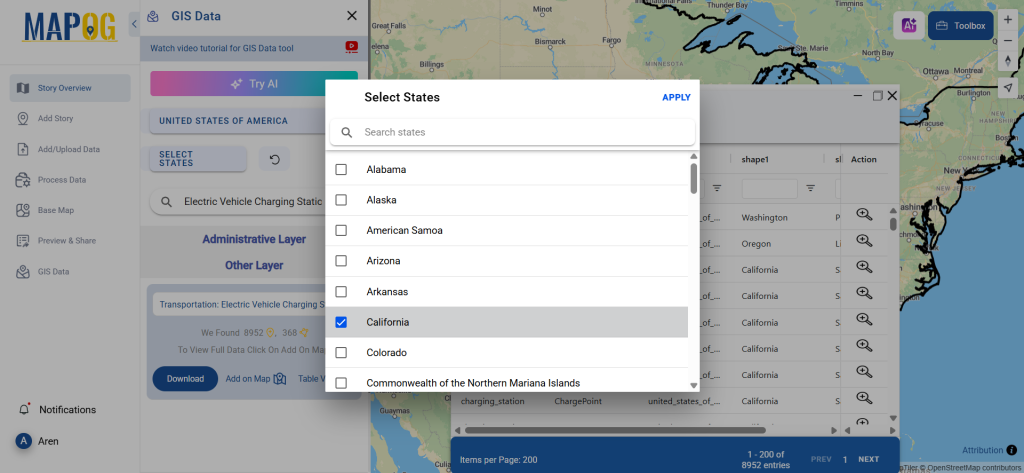
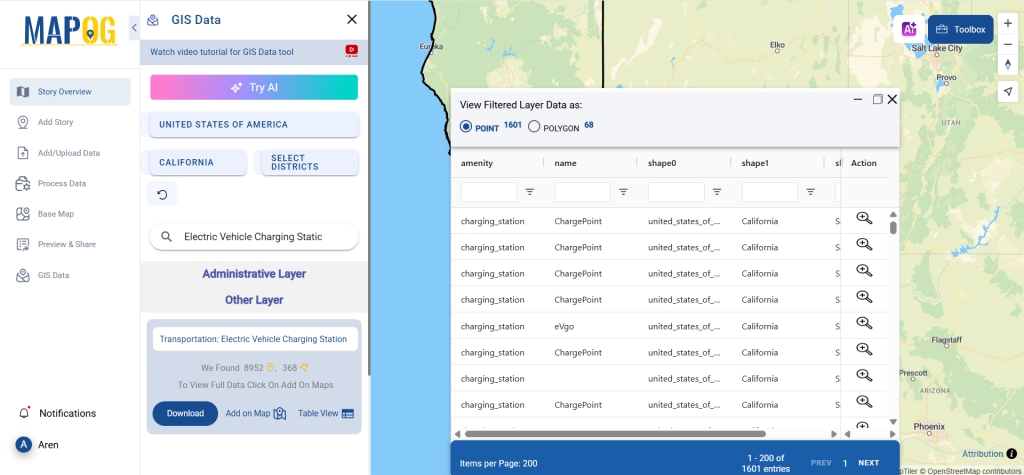
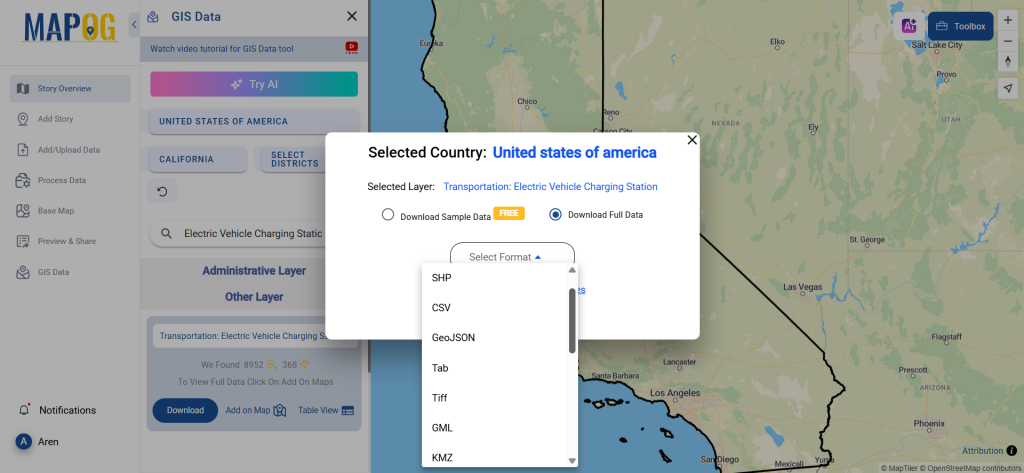
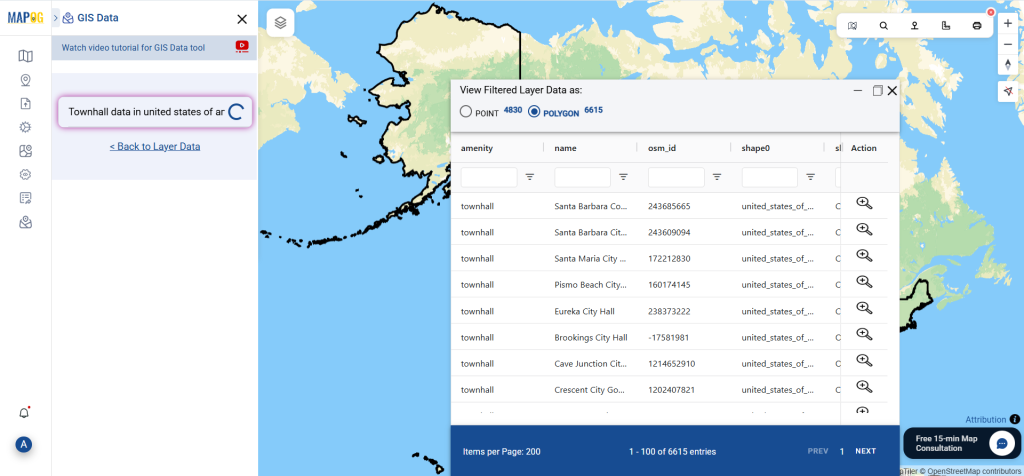
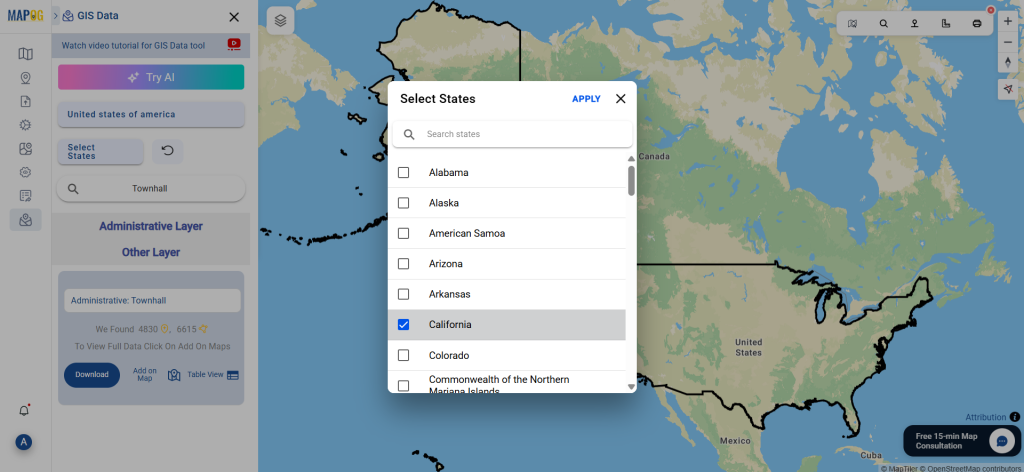
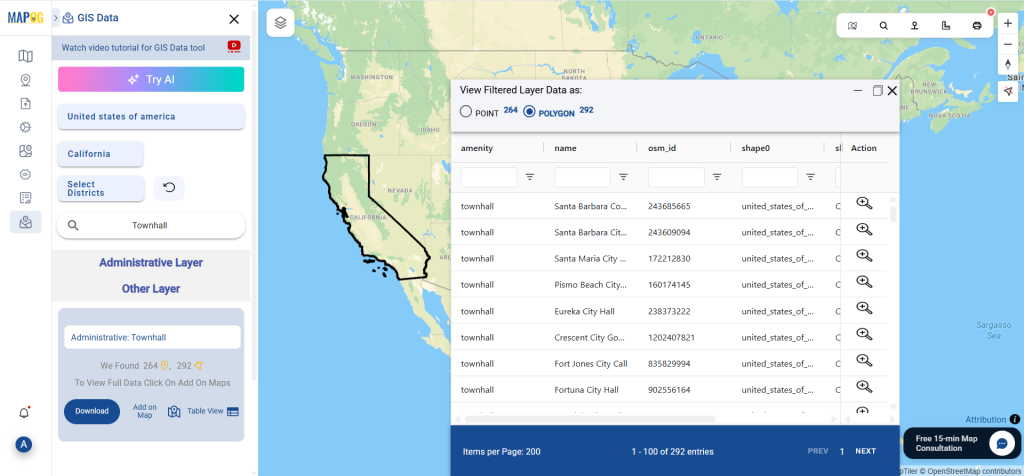
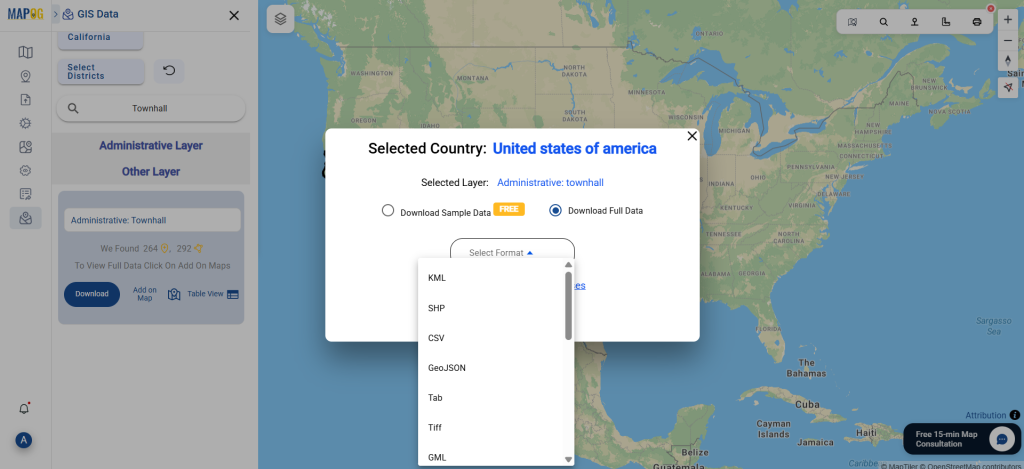
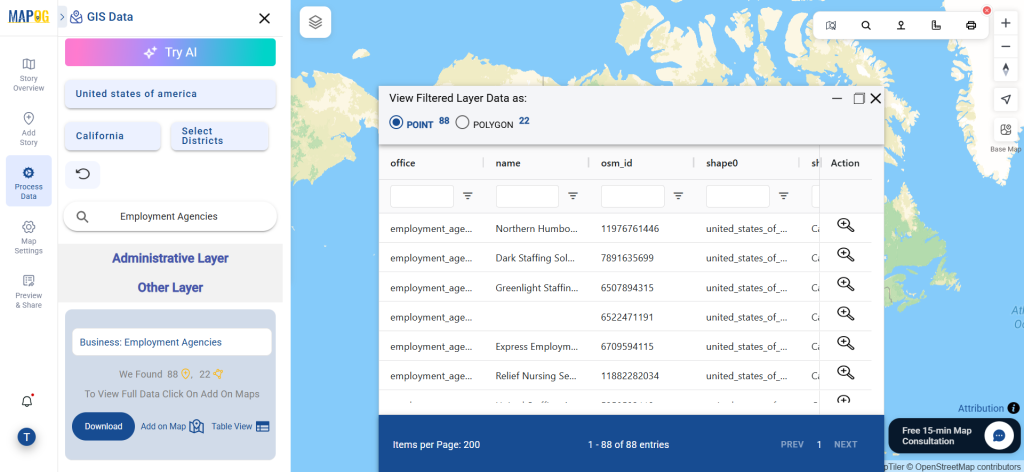
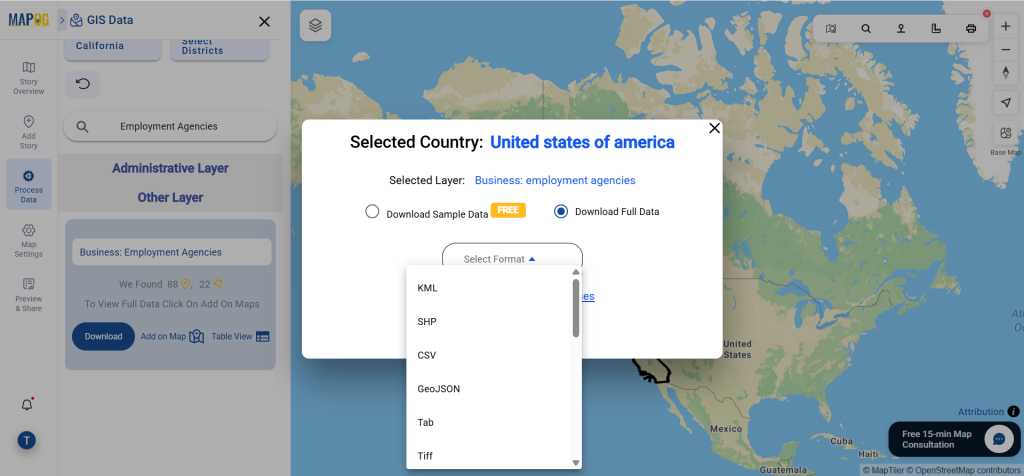
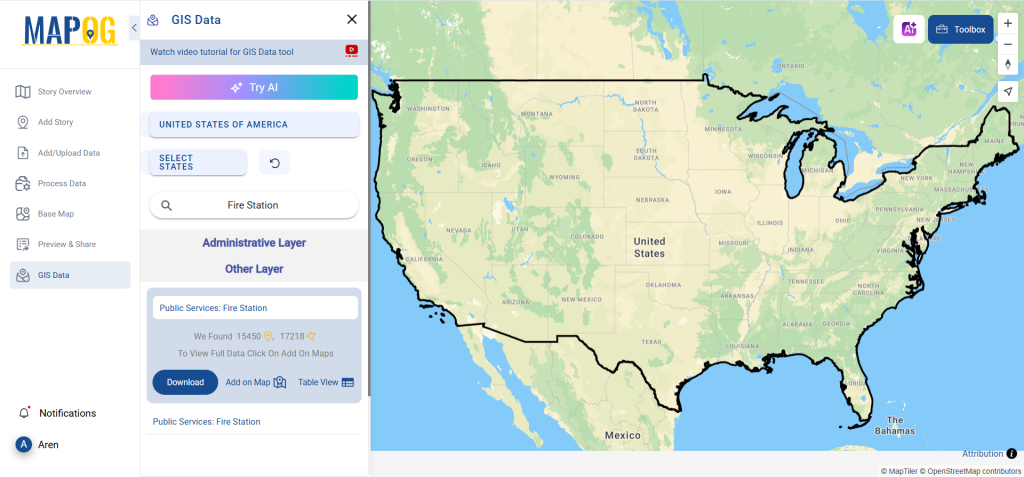
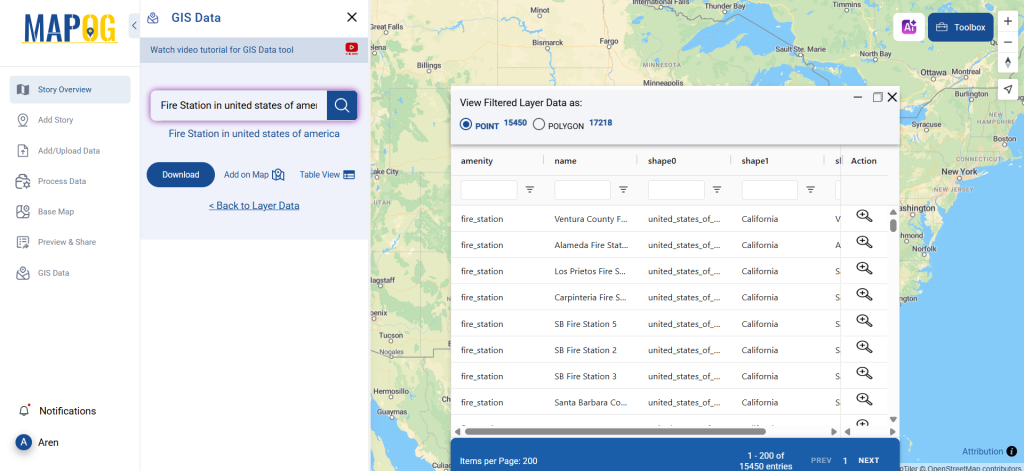
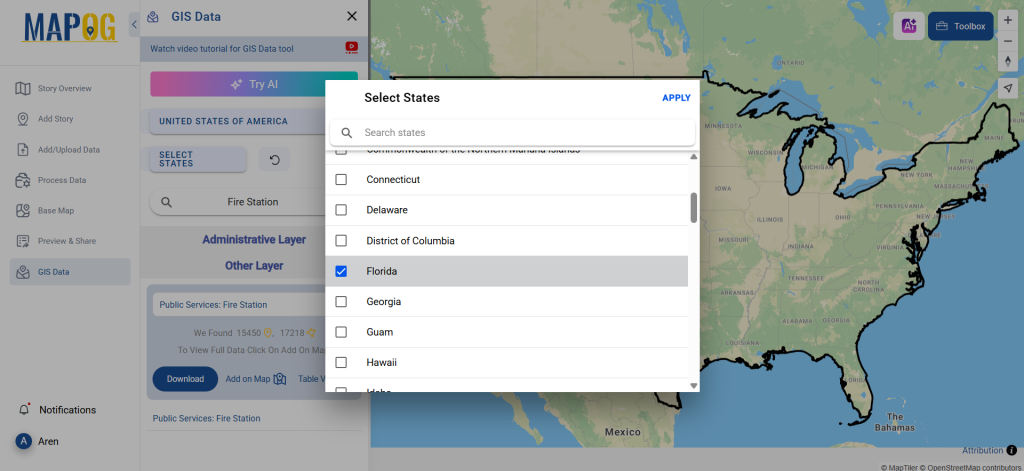
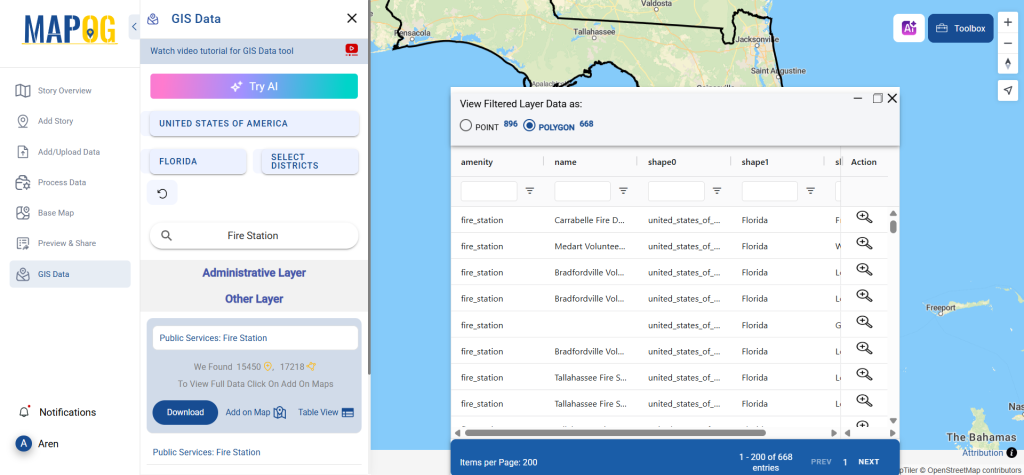
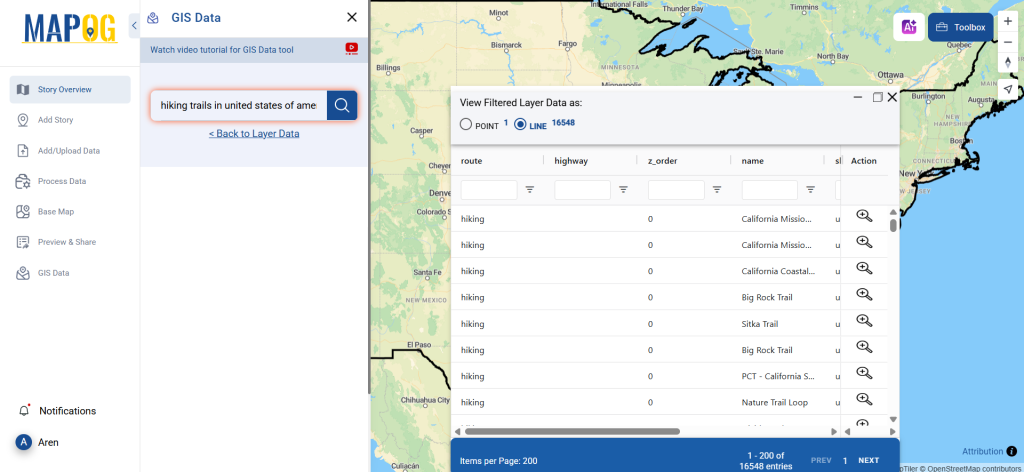
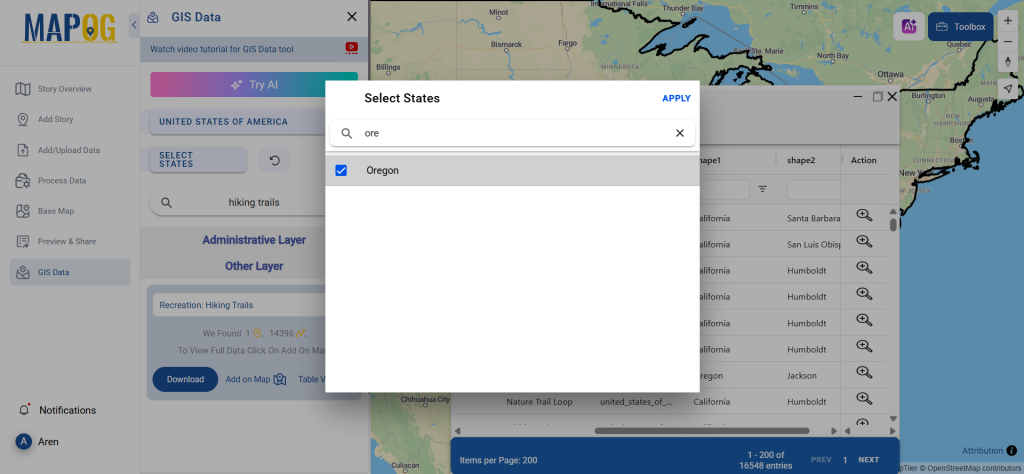
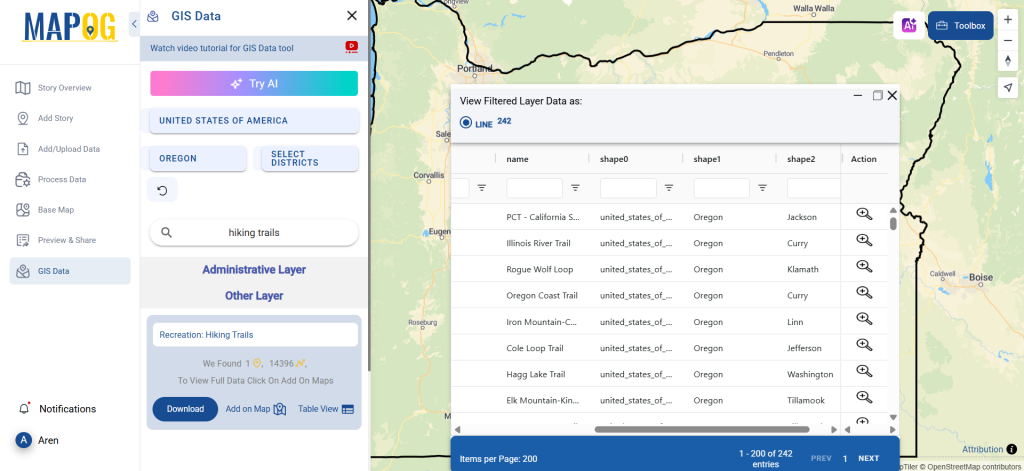
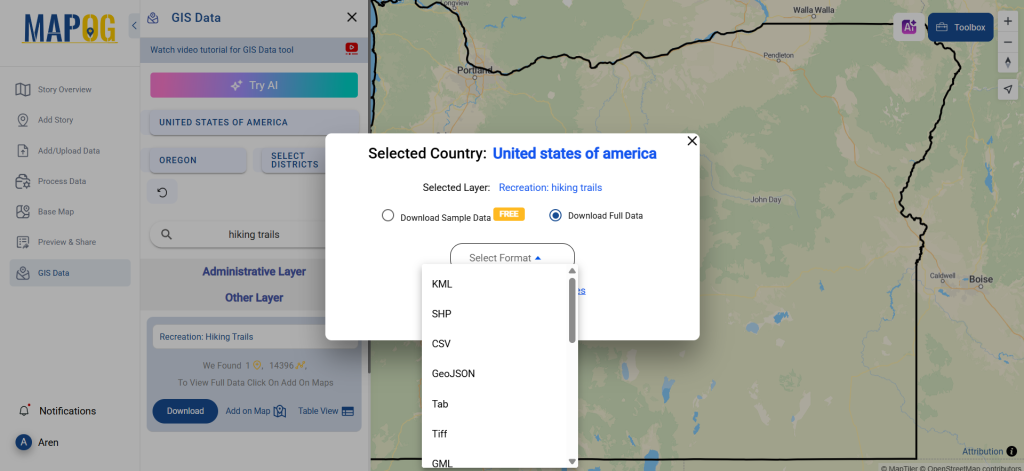
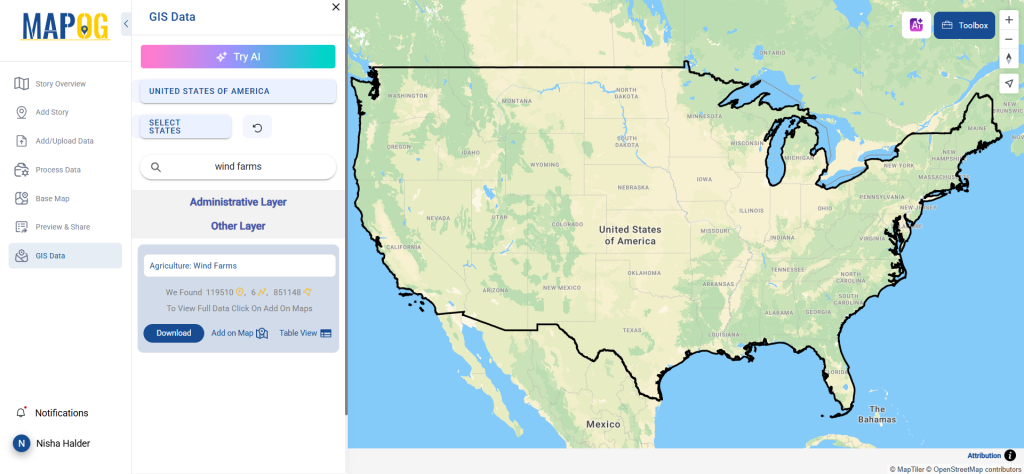
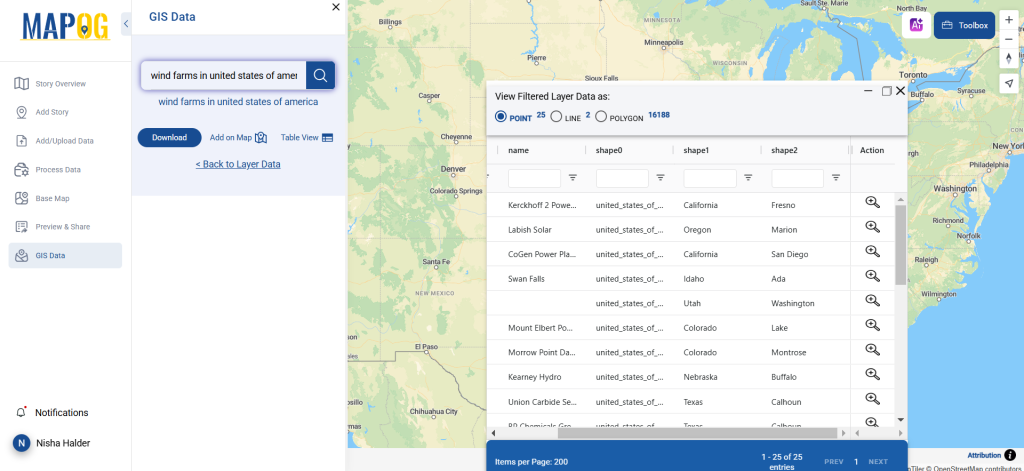
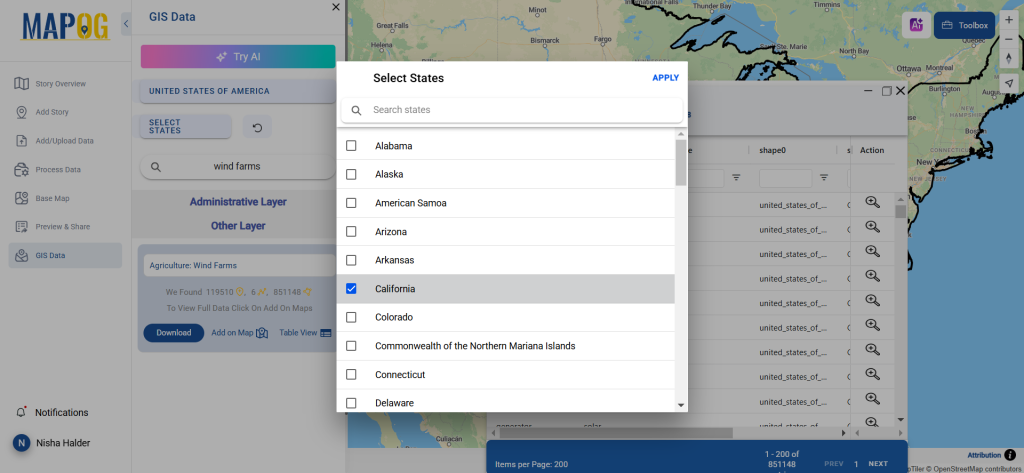
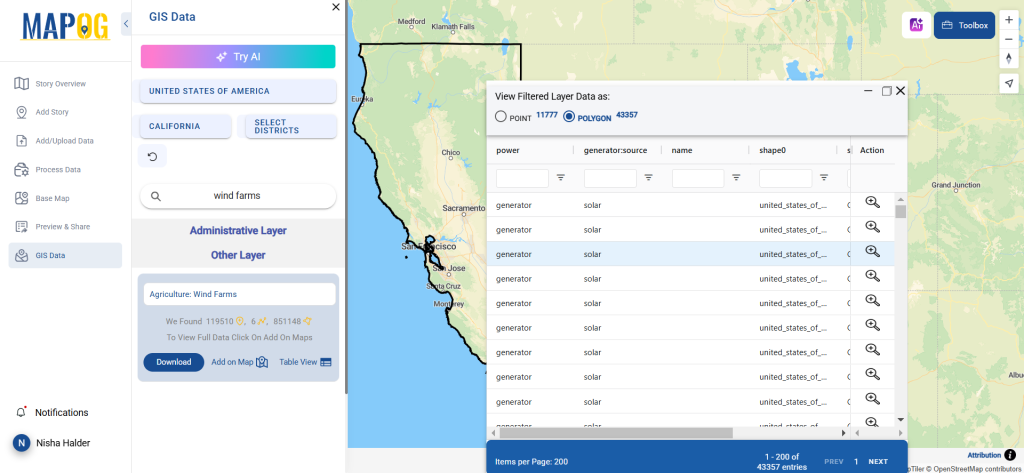
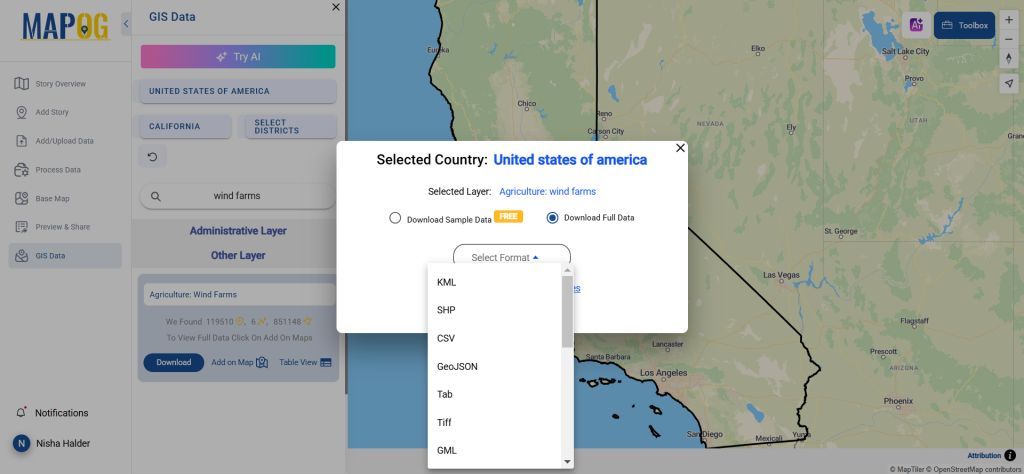
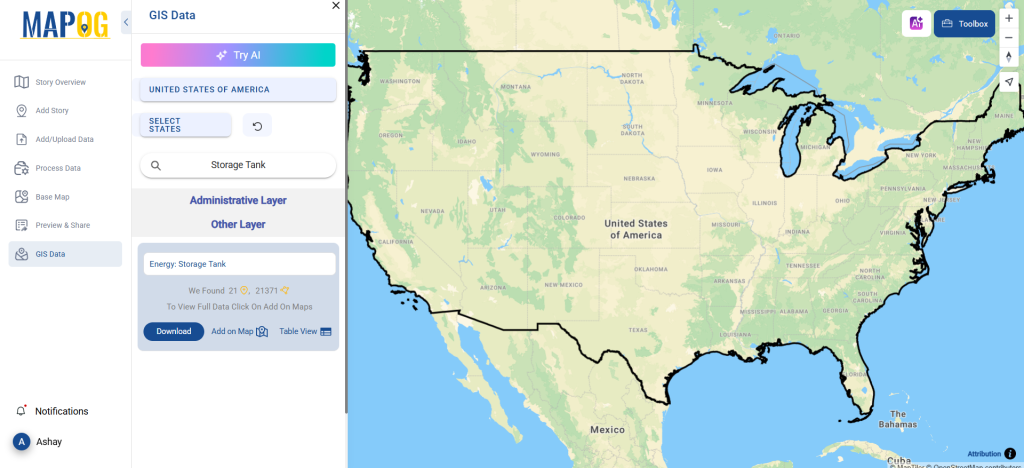
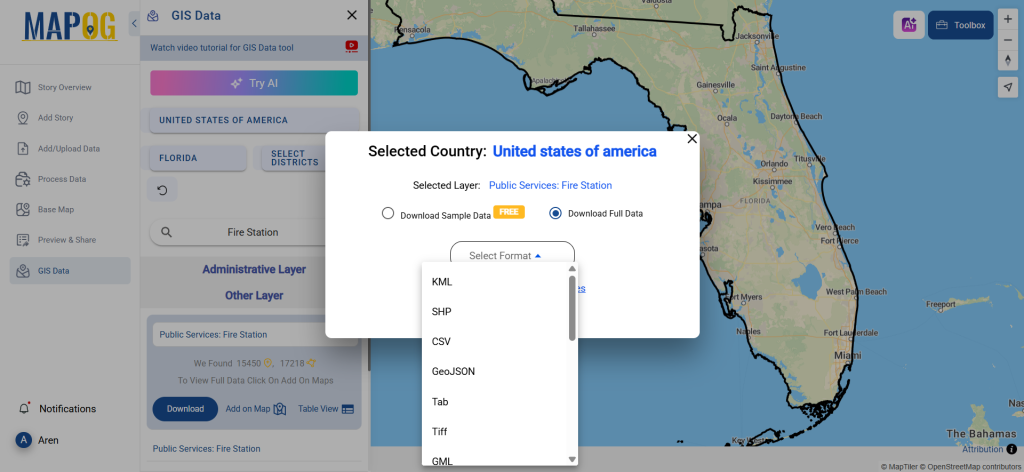
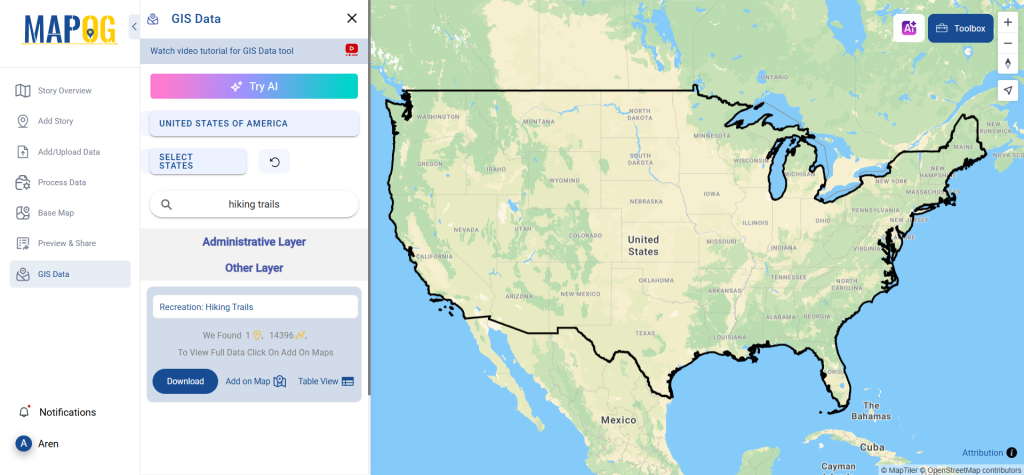
After successfully logging in with a legitimate email address, select the country you want to work with. Next, choose the specific layer you need and click on the download option. Once that’s done, pick the desired format to acquire the essential GIS data. Before proceeding with the data download, make sure to review the data table for any relevant information.

Download Iraq District Shapefile Data

Iraq is subdivided into 120 districts, known as “kaza” in Arabic. The district typically shares the same name as its district capital. These districts serve as important administrative units within the governorates, contributing to the effective governance and organization of the country.

Iraq District Boundaries

Download Iraq Districts Shapefile

Download Iraq Capital City Shapefile Data

Baghdad is the capital of Iraq and the second-largest city in the Arab world, next to Cairo. Positioned on the Tigris River, it stands close to the ancient city of Babylon’s remains. In 762 CE, Baghdad was designated as the capital of the Abbasid Caliphate, leading to remarkable development. In a short span, it emerged as a significant cultural, commercial, and intellectual hub in the Muslim world. Boasting prominent academic institutions like the House of Wisdom and a diverse, multiethnic, and multi-religious populace, Baghdad gained global renown as the “Center of Learning.”

Iraq Capital City Boundary

Download Iraq Capital Shapefile

Other Administrative Boundary Data:

Other GIS Data:

Above all links are provided for GIS data of Iraq if you are looking for any specific data please write us on support@igismap.com

Download Shapefile for the following:

  1. World Countries Shapefile
  2. Australia
  3. Argentina
  4. Austria
  5. Belgium
  6. Brazil
  7. Canada
  8. Denmark
  9. Fiji
  10. Finland
  11. Germany
  12. Greece
  13. India
  14. Indonesia
  15. Ireland
  16. Italy
  17. Japan
  18. Kenya
  19. Lebanon
  20. Madagascar
  21. Malaysia
  22. Mexico
  23. Mongolia
  24. Netherlands
  25. New Zealand
  26. Nigeria
  27. Papua New Guinea
  28. Philippines
  29. Poland
  30. Russia
  31. Singapore
  32. South Africa
  33. South Korea
  34. Spain
  35. Switzerland
  36. Tunisia
  37. United Kingdom Shapefile
  38. United States of America
  39. Vietnam
  40. Croatia
  41. Chile
  42. Norway
  43. Maldives
  44. Bhutan
  45. Colombia
  46. Libya
  47. Comoros
  48. Hungary
  49. Laos
  50. Estonia
  51. Iraq
  52. Portugal
  53. Azerbaijan
  54. Macedonia
  55. Romania
  56. Peru
  57. Marshall Islands
  58. Slovenia
  59. Nauru
  60. Guatemala
  61. El Salvador
  62. Afghanistan
  63. Cyprus
  64. Syria
  65. Slovakia
  66. Luxembourg
  67. Jordan
  68. Armenia
  69. Haiti And Dominican Republic

Disclaimer : If you find any shapefile data of country provided is incorrect do contact us or comment below, so that we will correct the same in our system as well we will try to correct the same in openstreetmap.

Download Estonia Administrative Boundary Shapefiles – National , Counties, Villages and More

Download Shapefile Maps –Estonia National Boundary, Estonia Counties, Municipalities, Estonia Villages and Districts Shapefile.

Great news for all GIS admirers. IGISMAP have recently published the GIS data collection for more than 100 new countries. Currently we hold GIS data, covering 150+ countries with 150+ datasets available for each nation. Our data provides precise information on administrative divisions and various geographic features like rivers, roads, and airports. Accessing this valuable resource is easy through two tools: Download GIS Data and Add GIS Data. You can download data in different formats such as Shapefile, KML, GeoJSON, or CSV. To learn more about the Add GIS Data tool, check out our article “Add GIS data from IGISMap GIS data collection.” This article will walk you through downloading administrative-level GIS data for Estonia using the Download GIS Data tool. Experience a seamless geospatial journey with IGISMAP as your trusted partner!

Note:

  • All data available are in GCS datum EPSG:4326 WGS84 CRS (Coordinate Reference System).
  • You need to login for downloading the shapefile.

Download Free Shapefile Data of Estonia

Between 57.3 and 59.5 latitude and 21.5 and 28.1 longitude, Estonia lies on the eastern coast of the Baltic Sea on the level northwestern part of the rising East European Platform. Estonia’s continental mainland is bordered to the north by the Gulf of Finland (part of the Baltic Sea) across from Finland, to the east by Lake Peipus and Russia, and to the south by Latvia. Besides the part of the European continent, Estonian territory also includes the larger islands of Saaremaa and Hiiumaa, and over 2,200 other islands and islets in the Baltic Sea, off the western and northern shores of the country’s mainland. Average elevation in Estonia reaches 50 m (164 ft).

Estonia National Boundary

Download Estonia National Boundary Shapefile

Download Estonia Counties Shapefile Data

Counties (Estonian: maakond, plural maakonnad) are the state administrative subdivisions of Estonia. Estonian territory is composed of 15 counties, including 13 on the mainland and 2 on islands.

Estonia Counties Boundaries

Download Estonia Counties Boundaries Shapefile

Download Estonia Villages Shapefile Data

Free Shapefile of Villages in Estonia.

Estonia Villages Boundaries

Download Estonia Villages Boundaries Shapefile

Other Administrative Boundary Data:

Other GIS Data:

Download Free Shapefile for the following:

  1. World Countries Shapefile
  2. Australia
  3. Argentina
  4. Austria
  5. Belgium
  6. Brazil
  7. Canada
  8. Denmark
  9. Fiji
  10. Finland
  11. Germany
  12. Greece
  13. India
  14. Indonesia
  15. Ireland
  16. Italy
  17. Japan
  18. Kenya
  19. Lebanon
  20. Madagascar
  21. Malaysia
  22. Mexico
  23. Mongolia
  24. Netherlands
  25. New Zealand
  26. Nigeria
  27. Papua New Guinea
  28. Philippines
  29. Poland
  30. Russia
  31. Singapore
  32. South Africa
  33. South Korea
  34. Spain
  35. Switzerland
  36. Tunisia
  37. United Kingdom Shapefile
  38. United States of America
  39. Vietnam
  40. Norway
  41. Chile
  42. Croatia

Disclaimer : If you find any shapefile data of country provided is incorrect do contact us or comment below, so that we will correct the same in our system as well we will try to correct the same in OpenStreetMap.

Download Laos Administrative Boundary Shapefiles – provinces, districts and more

Calling all GIS enthusiasts! IGISMAP welcomes you to a remarkable journey. Discover the power of mapping with Laos’s administrative boundary shapefiles, featuring provinces, districts, and more. Elevate your projects with these comprehensive GIS datasets, paving the way for enriched exploration and mapping. Don’t miss this opportunity to redefine your mapping endeavors!

With a vast collection of GIS data covering 150+ countries, each nation offering over 150 datasets, IGISMAP is becoming an irreplaceable asset in geospatial industry. Our GIS data collection stands out for its precise representation of administrative divisions and various geographic features like rivers, roads, and airports. Users can access these data from two tools of IGISMAP: Download GIS Data and Add GIS Data. Choose from multiple data formats, including Shapefile, KML, GeoJSON, or CSV to download data from Download GIS Data tool. To learn more about the Add GIS Data tool, explore our article “Add GIS data from IGISMap GIS data collection.” In this comprehensive guide, we’ll show you how to download administrative-level GIS data for Laos using the Download GIS Data tool. Take the hassle out of GIS data searching and embark on a smooth geospatial journey with IGISMAP as your reliable companion!

Note:

  • All data available are in GCS datum EPSG:4326 WGS84 CRS (Coordinate Reference System).
  • You need to login for downloading the shapefile.

Here is the video tutorial to download data:

Download Shapefile Data of Laos

Laos is a landlocked country located in Southeast Asia, officially known as the Lao People’s Democratic Republic. Situated at the center of the Indochinese Peninsula, Laos shares its borders with Myanmar and China to the northwest, Vietnam to the east, Cambodia to the southeast, and Thailand to the west and southwest. The capital city of Laos is Vientiane, which is also its largest city.

Laos National Boundary

Download Laos National Boundary Shapefile

After successfully logging in with a legitimate email address, select the country you want to work with. Next, choose the specific layer you need and click on the download option. Once that’s done, pick the desired format to acquire the essential GIS data. Before proceeding with the data download, make sure to review the data table for any relevant information.

Download Laos Provinces Shapefile Data

Laos, officially known as the Lao People’s Democratic Republic, is divided into 17 provinces (referred to as “khoueng” in Lao) and one prefecture, which is the Vientiane capital city municipality (known as “Na Kone Luang Vientiane” in Lao).

Laos province boundaries

Download Laos Province Boundaries Shapefile

This shapefile covers following Province of Laos listed below:

  1. Attapeu
  2. Bokeo
  3. Bolikhamxay
  4. Champasak
  5. Houaphanh
  6. Khammouane
  7. Luang Namtha
  8. Luang Prabang
  9. Oudomxay
  10. Phongsaly
  11. Salavan
  12. Savannakhet
  13. Sekong
  14. Vientiane (capital)
  15. Vientiane Province
  16. Xaignabouli
  17. Xekong

Download Laos District Shapefile Data

Laos is divided into districts, which are administrative subdivisions within the provinces. The number of districts can vary within each province, totaling approximately 141 districts in Laos. Each district is led by a district administrator and is further divided into villages or towns.

Laos District Boundaries

Download Laos District Boundaries Shapefile

Other Administrative Boundary Data:

Other GIS Data:

Above all links are provided for GIS data of Laos if you are looking for any specific data please write us on support@igismap.com

Download Shapefile for the following:

  1. World Countries Shapefile
  2. Australia
  3. Argentina
  4. Austria
  5. Belgium
  6. Brazil
  7. Canada
  8. Denmark
  9. Fiji
  10. Finland
  11. Germany
  12. Greece
  13. India
  14. Indonesia
  15. Ireland
  16. Italy
  17. Japan
  18. Kenya
  19. Lebanon
  20. Madagascar
  21. Malaysia
  22. Mexico
  23. Mongolia
  24. Netherlands
  25. New Zealand
  26. Nigeria
  27. Papua New Guinea
  28. Philippines
  29. Poland
  30. Russia
  31. Singapore
  32. South Africa
  33. South Korea
  34. Spain
  35. Switzerland
  36. Tunisia
  37. United Kingdom Shapefile
  38. United States of America
  39. Vietnam
  40. Croatia
  41. Chile
  42. Norway
  43. Maldives
  44. Bhutan
  45. Colombia
  46. Libya
  47. Comoros
  48. Hungary
  49. Laos
  50. Estonia
  51. Iraq
  52. Portugal
  53. Azerbaijan
  54. Macedonia
  55. Romania
  56. Peru
  57. Marshall Islands
  58. Slovenia
  59. Nauru
  60. Guatemala
  61. El Salvador
  62. Afghanistan
  63. Cyprus
  64. Syria
  65. Slovakia
  66. Luxembourg
  67. Jordan
  68. Armenia
  69. Haiti And Dominican Republic

Disclaimer : If you find any shapefile data of country provided is incorrect do contact us or comment below, so that we will correct the same in our system as well we will try to correct the same in openstreetmap.

Download Libya Administrative Boundary Shapefiles – National, Districts and more

Access Libya GIS data of administrative boundaries, national, districts, in formats – shapefile, KML, GeoJSON, CSV, KMZ

Thrilling updates for those passionate about Geographic Information Systems (GIS)! IGISMAP’s GIS data collection has now expanded to include Libya, among over 100 other countries. Dive into the comprehensive and up-to-date GIS data for Libya, encompassing a wide array of geographic and administrative features like water bodies, roads, airport locations, and more. This dataset encompasses various administrative boundaries, providing valuable insights for your mapping projects, whether on a national or local scale. You have the flexibility to choose from formats such as ESRI Shapefile, KML, GeoJSON, and CSV for easy downloads. Don’t miss out on this exceptional opportunity to elevate your mapping projects with the latest GIS data for Libya, complete with administrative boundaries. Enjoy your exploration and mapping!

With MAPOG’s versatile toolkit, you can effortlessly upload vector and raster files, add WMS (Web Map Service) layers, upload Excel or CSV data, incorporate existing files, perform polygon splitting and merging, generate new polygon and polyline data, use the converter for various formats, conduct buffer analysis, create grids, transform points into polygons, calculate isochrones, and utilize the geocoder for precise location information.

We provide an extensive range of data formats, including KML, SHP, CSV, GeoJSON, Tab, SQL, Tiff, GML, KMZ, GPKZ, SQLITE, Dxf, MIF, TOPOJSON, XLSX, GPX, ODS, MID, and GPS, ensuring compatibility and accessibility for a variety of applications and analyses.

If you want to know how to use Add GIS Data tool, check out this article Add GIS data from IGISMap GIS data collection.

Note:

  • All data available are in GCS datum EPSG:4326 WGS84 CRS (Coordinate Reference System).
  • You need to login for downloading the shapefile.

Download Shapefile Data of Libya

Nestled within the Maghreb region of North Africa, Libya stands as a country of substantial importance, officially known as the State of Libya. It shares its borders with the Mediterranean Sea to the north, Egypt to the east, Sudan to the southeast, Chad to the south, Niger to the southwest, Algeria to the west, and Tunisia to the northwest. Comprising the historical regions of Tripolitania, Fezzan, and Cyrenaica, Libya’s vast expanse covers 1.8 million km2 (700,000 sq mi), ranking it as Africa’s fourth-largest and the Arab world’s, as well as the 16th largest globally. The dynamic capital, Tripoli, nestled in the northwest, not only houses over a million residents but also resonates as a center of cultural and societal vibrancy within the nation’s seven million-strong population.

Libya National Boundary

Download Libya National Boundary Shapefile

After successfully logging in with a legitimate email address, select the country you want to work with. Next, choose the specific layer you need and click on the download option. Once that’s done, pick the desired format to acquire the essential GIS data. Before proceeding with the data download, make sure to review the data table for any relevant information.

Download Libya District Shapefile Data

Libya is divided into twenty-two districts. Districts are the highest administrative regions in Libya.

Libya Districts Boundaries

Download Libya Districts Shapefile

This shapefile covers following districts of Libya listed below:

  1. Tripoli
  2. Murqub
  3. Jabal al Gharbi
  4. Nalut
  5. Zawiya
  6. Jafara
  7. Misrata
  8. Sirte
  9. Benghazi
  10. Marj
  11. Butnan
  12. Al Wahat
  13. Kufra
  14. Al Jufra
  15. Wadi al Shatii
  16. Murzuq
  17. Sabha
  18. Wadi al Hayaa
  19. Nalut
  20. Yafran
  21. Ghadamis
  22. Ghat

Download Libya Administrative Boundaries Combined Shapefile Data

There are currently 22 districts in Libya, according to the 2007 Administrative Divisions Law.These districts are further subdivided into municipalities (baladiyat). The municipalities are the basic administrative units in Libya. They are responsible for providing basic services to the people, such as education, healthcare, and infrastructure.

Libya National District Boundaries

Download Libya National, District Shapefile

Other GIS Data:

Above all links are provided for GIS data of Libya if you are looking for any specific data please write us on support@igismap.com

Download Shapefile for the following:

  1. World Countries Shapefile
  2. Australia
  3. Argentina
  4. Austria
  5. Belgium
  6. Brazil
  7. Canada
  8. Denmark
  9. Fiji
  10. Finland
  11. Germany
  12. Greece
  13. India
  14. Indonesia
  15. Ireland
  16. Italy
  17. Japan
  18. Kenya
  19. Lebanon
  20. Madagascar
  21. Malaysia
  22. Mexico
  23. Mongolia
  24. Netherlands
  25. New Zealand
  26. Nigeria
  27. Papua New Guinea
  28. Philippines
  29. Poland
  30. Russia
  31. Singapore
  32. South Africa
  33. South Korea
  34. Spain
  35. Switzerland
  36. Tunisia
  37. United Kingdom Shapefile
  38. United States of America
  39. Vietnam
  40. Croatia
  41. Chile
  42. Norway
  43. Maldives
  44. Bhutan
  45. Colombia
  46. Libya
  47. Comoros
  48. Hungary
  49. Laos
  50. Estonia
  51. Iraq
  52. Portugal
  53. Azerbaijan
  54. Macedonia
  55. Romania
  56. Peru
  57. Marshall Islands
  58. Slovenia
  59. Nauru
  60. Guatemala
  61. El Salvador
  62. Afghanistan
  63. Cyprus
  64. Syria
  65. Slovakia
  66. Luxembourg
  67. Jordan
  68. Armenia
  69. Haiti And Dominican Republic

Disclaimer : If you find any shapefile data of country provided is incorrect do contact us or comment below, so that we will correct the same in our system as well we will try to correct the same in openstreetmap.

GeoJSON to GeoTIFF – Vector to Raster Conversion

GeoJSON is an open standard geospatial data interchange format that represents simple geographic features and their non-spatial attributes. It is based on JavaScript Object Notation (JSON) and serves as a format for encoding various geographic data structures.

TIFF, also known as the Tagged Image File Format, is a file format designed for transferring, storing, and displaying raster images. It is commonly used for scanned aerial photography, maps, digital satellite imagery, and other geographic data.

GeoTIFF is a metadata standard that is in the public domain. It enables the embedding of georeferencing information in a TIFF file. This additional information can include projections, coordinate systems, ellipsoids, datums, and all other necessary details to establish the precise spatial reference for the file.

Using IGIS Map Tool you can easily convert – GeoJSON to GeoTIFF. You can also do other GIS Data Conversion using this tool.

IGISMAP to Convert GeoJSON to GeoTIFF

For GeoJSON to GeoTIFF conversion, go to IGIS Map Tool, after logging in with your registered email and password. If you are a new user, click the Sign Up button in the Login popup and register to IGISMAP by filling the details.

IGISMAP
IGISMAP

There are four main steps for using GIS Converter:

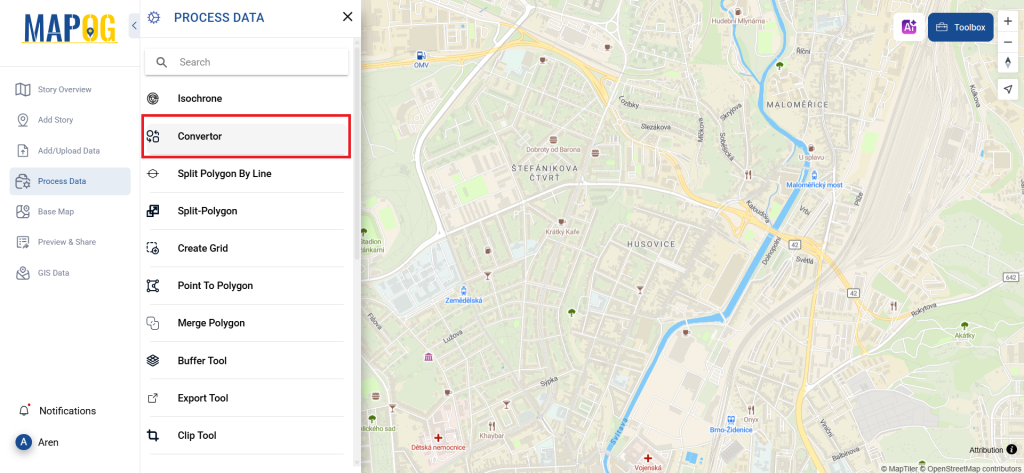
  • Click on Tool Converter
  • Upload the data
  • Choose the format to which it should be converted
  • Download the converted file

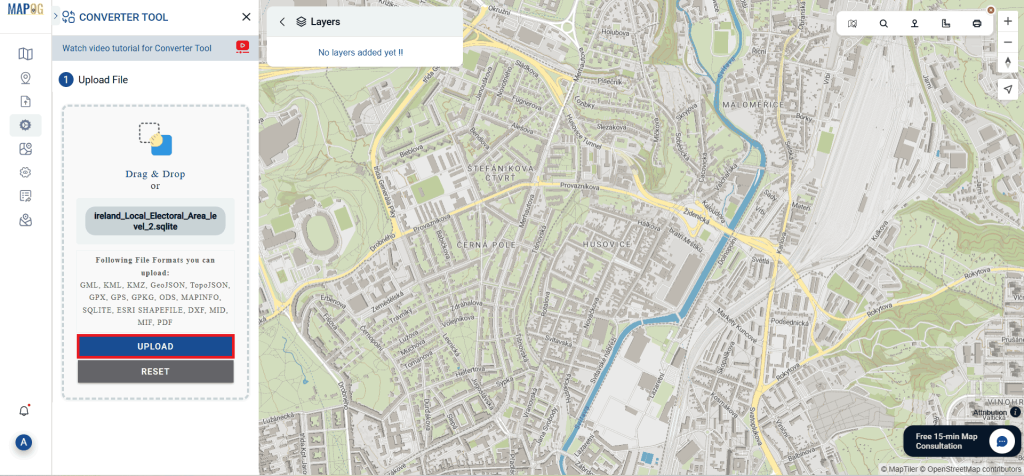
Step one is to upload your GeoJSON file which you want to convert. You can upload your file from system or select from the Recent Files.

Converter Tool - Upload GeoJSON
Upload GeoJSON

Here we have uploaded the GeoJSON file of USA.

Step two is to select the output format from the dropdown for the converted file, in this case its GeoTIFF. You can also set the Coordinate Reference System of your preference. As a default CRS will set to WGS 84 (World) [EPSG:4326]. Now Now Click on the Convert File.

Converter Tool - TIFF as Output Format
Select GeoTIFF as Output Format

Your GeoJSON file will then gets converted to GeoTIFF file after a few seconds and will be available for downloading.

Download GPX File
Download GeoTIFF File

You can also choose to style the layer or continue with further conversion process by clicking the Convert Another File button.

Converted Files section from the dashboard contains the list of the details of all the conversion done in your account, providing both input and output data available for download their corresponding formats.

Download free shapefile of various countries.

Create your own shapefile and share with your clients or embed on your website. 

More on Conversion:

Download Denmark Administrative Boundary Shapefiles – Regions, Municipalities, Postal Areas and More

Hello GIS enthusiasts, IGISMAP has now published the latest GIS vector data of Denmark administrative levels. Links for downloading the shapefiles of the important administrative divisions of Denmark are provided in the following. You can also download these data in KML, GeoJSON or CSV formats. 

Note:

  • All data available are in GCS datum EPSG:4326 WGS84 CRS (Coordinate Reference System).
  • You need to login for downloading the shapefile.

Download Free Shapefile Data of Denmark

Denmark is a Nordic country in Northern Europe. It is the most populous and politically central constituent of the Kingdom of Denmark, a constitutionally unitary state that includes the autonomous territories of the Faroe Islands and Greenland in the North Atlantic Ocean. European Denmark is the southernmost of the Scandinavian countries, lying southwest of Sweden, south of Norway, and north of Germany. Spanning a total area of 42,943 km2 (16,580 sq mi), it consists of the peninsula of Jutland and an archipelago of 443 named islands, of which the largest are Zealand, Funen and the North Jutlandic Island. Denmark’s geography is characterized by flat, arable land, sandy coasts, low elevation, and a temperate climate. As of 2022, it had a population of 5.88 million (1 March 2022), of which 800,000 live in the capital and largest city, Copenhagen.

Denmark National Boundary

Download Denmark National Outline Boundary Shapefile

Download Denmark Regions Shapefile Data

Denmark is divided into 5 regions. The governing bodies of the regions are the regional councils, each with forty-one councillors elected for four-year terms.

Following are the list of regions:

  1. Hovedstaden – Capital Region of Denmark
  2. Midtjylland – Central Denmark Region
  3. Nordjylland – North Denmark Region
  4. Sjælland – Region Zealand
  5. Syddanmark – Region of Southern Denmark
Denmark Region Boundaries

Download Denmark Region Boundaries Shapefile

Download Denmark Municipalities Shapefile Data

Denmark Municipality Boundaries

Download Denmark Municipality Boundaries Shapefile

Download Denmark Postal Areas Shapefile Data

Denmark Postal Area Boundaries

Download Denmark Postal Area Boundaries Shapefile

Other Administrative Boundary Data:

Other GIS Data:

Please note that the Papua New Guinea data provided here is license under Open Data Commons Open Database License (ODbL). Please review the same before using it. If you want data under different license you can also look over to the post : Download Free Shapefile Maps – Country Boundary Polygon, Rail-Road, Water polyline etc

Download Free Shapefile for the following:

  1. World Countries Shapefile
  2. Australia
  3. Argentina
  4. Austria
  5. Belgium
  6. Brazil
  7. Canada
  8. Denmark
  9. Fiji
  10. Finland
  11. Germany
  12. Greece
  13. India
  14. Indonesia
  15. Ireland
  16. Italy
  17. Japan
  18. Kenya
  19. Lebanon
  20. Madagascar
  21. Malaysia
  22. Mexico
  23. Mongolia
  24. Netherlands
  25. New Zealand
  26. Nigeria
  27. Papua New Guinea
  28. Philippines
  29. Poland
  30. Russia
  31. Singapore
  32. South Africa
  33. South Korea
  34. Spain
  35. Switzerland
  36. Tunisia
  37. United Kingdom Shapefile
  38. United States of America
  39. Vietnam
  40. Croatia
  41. Chile
  42. Norway

Disclaimer : If you find any shapefile data of country provided is in correct do contact us or comment below, so that we will correct the same in our system as well we will try to correct the same in openstreetmap.

Convert KML to GeoJSON

Have you extracted and downloaded KML file from Google Earth or Google map and want to render it with libraries supporting GeoJSON file format? Are you tired of downloading the same data in different formats? Using Map Tool you can easily convert – KML to GeoJSON. You can also do other GIS Data Conversion using this tool.

KML is a file format used to display geographic data in an Earth browser such as Google Earth. You can create KML files to pinpoint locations, add image overlays, and expose rich data in new ways. KML is an international standard maintained by the Open Geospatial Consortium, Inc. (OGC).

GeoJSON is an open standard format designed for representing simple geographical features, along with their non-spatial attributes. It is based on the JSON format.

Online Converter Tool from KML To GeoJSON

MAPOG Converter Tool

MapOG converter is an incredible tool for conversion of data. It will translate KML data which is widely used in software like Google Earth, Fusion Tables, Maps and GPS devices and convert them by one click to GeoJSON (JSON) format which is widely used in software like MongoDB, Geoserver, CartoWeb and Feature Server. It Convert GIS / CAD files online without using complex and Enterprise Software like ArcGIS, QGIS, AutoCAD etc. IGIS Map converter is much easier to use than any other conversion software or tool. 

Along with conversion from KML to GeoJson, you can also check following conversions like KML to Shp, KML to KMZ, KMZ to KML, KML to DXF, KML to Topojson, KML to GML etc.

IGISMAP to Convert KML to GeoJSON

For KML to GeoJSON conversion, go to MapOG Converter Tool, after logging in with your registered email and password. If you are a new user, click the Sign Up button in the Login popup and register to IGISMAP by filling the details.

IGISMAP
IGISMAP

There are four main steps for using GIS Converter:

  • Click on Tool Converter
  • Upload the data
  • Choose the format to which it should be converted
  • Download the converted file

Step one is to upload your KML file which you want to convert. You can upload your file from system or select from the Recent Files.

Upload KML
Upload KML

Here we using the KML file of Turkey national boundary.

Step two is to select the output format from the dropdown for the converted file, in this case its GeoJSON. You can also set the Coordinate Reference System of your preference. As a default CRS will set to WGS 84 (World) [EPSG:4326]. Click on the Convert File.

Slect GeoJSON as output Format
Select GeoJSON as output Format

Your KML file will then gets converted to GeoJSON file after a few seconds and will be available for downloading.

Download GeoJSON file

You can also choose to style the layer or continue with further conversion process by clicking the Convert Another File button.

Converted Files section from the dashboard contains the list of the details of all the conversion done in your account, providing both input and output data available for download their corresponding formats.

Download free shapefile of various countries.

Create your own shapefile and share with your clients or embed on your website. 

Adding Multiple Map Layers – Hide Show layer using Leaflet js

This article is about how you can make visible and invisible your layer with the help of checkbox on any base map. The base layer used here is OSM (Open street map), which is open source freely available map. With layers at the same time you can open up multiple data at once and make analysis in view by looking over the overlay layers. Here we will check in Adding Multiple Map Layers – Hide Show layer using leaflet js. You may look over Getting started with leaflet js if you are very new to Leaflet and mapping library.

Adding Multiple Map Layers – Hide Show layer using Leaflet js

Showing multiple layers and making it interactive with hide and show functionality we need checkbox. So, To show two checkboxes on any HTML page the following lines are given. Here checkboxes are taken inside a division, which is denoted by tag <div> and checkboxes take input from user so they define in tag <input>. Every element of HTML can have an id, here we assign for div it is division and for checkboxes it is subunits and places. Outside the tag of checkbox we write name of the checkbox here subunits and places have used.

Some styling is required when it comes to visualisation. In this article the division containing check boxes is shown in the topmost right location. For styling the html element we need to use CSS (cascade sheet style). Using CSS we can define position, background colour font size etc. The z-index property specifies the stack order of an element as two divisions are being used in this article. An element with greater stack order is always in front of an element with a lower stack order. The division of map has lower z index then division of checkboxes.

<body>
<div id=”division” style=”position: absolute; background-color: white; width: 10%; height:10%; float: right; margin: 0.5cm 0cm 0cm 36cm; z-index:999;”>
<input type=”checkbox” id=”subunits” style=”font-size: larger”>Subunits<br>
<input type=”checkbox” id=”places” style=”font-size: larger” > Places
</div>
</body>

Using HTML and CSS we only define how the elements are going to look on the browser. How they will work it is define by the JavaScript or jQuery. Here JQuery has used for checkboxes to work.

Basic syntax is: $(selector).action()

  • A $ sign to define/access jQuery
  • A (selector) to query HTML elements
  • A jQuery action() to be performed on the element.

Here how the code looks like for Adding Multiple Map Layers – Hide Show layer using leaflet js

Before going through code in adding and hide – show multiple layer using leaflet, you should be having a good knowledge of adding point, line and polygon layer using leaflet js along with parsing geojson or topojson layer using leaflet js if you want to add topojson data layers.

The jQuery #id selector uses the id attribute of an HTML tag to find the specific element. Here user needs to click on the checkbox to add and hide the layer from OSM. So selector is id of checkbox and action is click() method. In the method we define the function to add or hide the layer. 

$(“#subunits”).click(function() {
if (this.checked) {
console.log(“checked!”);
geo.addTo(newMap);
} else {
console.log(“unchecked!”);
newMap.removeLayer(geo); }; });
In similar way places are added on the map with following lines of code.
$(“#places”).click(function() {
if (this.checked) {
console.log(“checked!”);
var places = topojson.feature(uk,uk.objects.places);
geoP=L.geoJSON(places).addTo(newMap);
} else {
console.log(“unchecked!”);
newMap.removeLayer(geoP);
};
});

Here is how the output will look like for Adding Multiple Map Layers – Hide Show layer using Leaflet js:

Adding Multiple Map Layers - Hide Show layer using Leaflet js
Adding Multiple Map Layers – Hide Show layer using Leaflet js

If else statement shows that if checkbox is clicked and returns checked status then layer is added to map and checked can be seen on console. Else checkbox will return unchecked status then unchecked will be written on console and added layer will be removed from map.

Here addTo() and removeLayer() methods are from leaflet javascript library, which adds and removes layer from map. To see the console on browser right click on browser and click to inspect option.

Hope this article might help you in Adding Multiple Map Layer using Leaflet js library. If you are facing any problem in implementing, then do comment below with the problem text you are facing. So that we can discuss over it.

Convert GeoJSON to TopoJSON – GIS

Convert GeoJSON to TopoJSON. GeoJSON is an open standard format designed for representing simple geographical features, along with their non-spatial attributes, based on JavaScript Object Notation. The need of conversion is to reduce the size of data, so that rendering of data on browser can be made faster. TopoJSON (topological geospatial data) is an extension of GeoJSON that encodes topology. Here we have explored two methods for conversion of GeoJSON to TopoJSON (i.e. online and offline).

Use Online Converter Tool – Geojson to TopoJSON MapOG

Offline Method to Convert GeoJSON to TopoJSON:

You can directly convert GeoJSON to TopoJSON with the help of topojoson-server node package manager. For using this package you need to first install node js in your system (can be installed in windows, linux based operating system or Mac).

If you have Shapefile or KML file, then you can refere this articles i.e convert kml to shapefile, convert shapefile to GeoJSON and converting shapefile to kml, so that you can generate new GeoJSON file out of other GIS format files.

Convert GeoJSON to TopoJSON – NPM method

NPM (Node Package Manager) is a command-line utility that aids in package installation, version management, and dependency management or can be considered npm as a tool that helps to install another tools like topojson-server.

For this method you need to download node.js which is available https://nodejs.org/en/ here. After successful installation you need to check npm availability using command

  • npm –check.

If not available use

  • npm install -g npm-check

convert geojson to topojson

After this you need to install topojson-server for conversion of data that can be done by using

  • npm install -g topojson-server

Now all setup is ready

Use geo2topo command to convert geojson data to topojson data

  • geo2topo –o geo.json topo.json

Where geo.json is the geojson file i.e input file and topo.json is the file we are creating with the name topo as topo.json file i.e output file.

Here –o is output. If command doesn’t run and gives error as no such file or directory. Then specify full path for file for both input and output. It is recommended that you run this command from the same directory where geo.json file is stored.

If you don’t have any input files ready or any geojson or shapefile then you can download free GIS data fromat for testing this article.

Online method: Convert GeoJson to TopoJson

This is the simple and fast method. For the conversion you just need to drag the geojson file in http://mapshaper.org/ site. Then use export option to convert this data into topojson format. Map shaper website render and convert the file in the browser itself, but it you might face problem while converting a big geojson file. 

I hope that this methods listed above to convert geojson to topojson would have helped you in achieving result. If you find any problem or know any other method to perform this operation and want to share with us, then do let us know by commenting below, in the box provided.

Add or Load GeoJSON file – Point, Polyline or Polygon map – Leaflet js

Are you looking to create a map interactive application to locate markers with points, or to highlight an area by polygon or to draw or show a river or roads line with polyline? With Leafletjs library and GeoJSON as GIS data, we can easily create a map which we are looking for and render the output in browser. Leaflet js is an opensource small library to create interactive map. GeoJSON is one of the GIS data structure which stores geographic data in JSON format. GeoJSON supports point, line, polygon, multipolyline, multipolygon and Geometry collection which can represent a geometry, feature or a collection of features. A detailed structure of GeoJSON would be written in separate article.

Add or Load GeoJSON file

This Article would let you know how to render and load geoJSON file with the help of leaflet js library. Also you would also get an idea by this article to implement a click event over a GeoJSON file and fetch information associated with the feature of GeoJOSN data loaded as map.

If you are not familiar with Leaflet, I would recommend you to read first the Getting Started tutorial with Leaflet js Library to create map application.

Lets setup a Base Map First i.e loading openstreetmap or osm in leaflet, in a html file:


<!DOCTYPE html>
<html>
<head>
<title>Getting Started - Leaflet js Map interactive library</title>
<meta charset="utf-8" />
<meta name="viewport" content="width=device-width, initial-scale=1.0">
<link rel="stylesheet" href="https://unpkg.com/leaflet@1.0.3/dist/leaflet.css" />
<script src="https://unpkg.com/leaflet@1.0.3/dist/leaflet.js"></script>
</head>
<body>
<div id="map" style="width: 1000px; height: 600px;"></div>
<script>
var newMap = L.map('map').setView([38.9188702,-77.0708398], 13);
L.tileLayer('http://{s}.tile.osm.org/{z}/{x}/{y}.png', {
attribution: '&copy; <a href=”http://osm.org/copyright”>OpenStreetMap</a> contributors'
}).addTo(newMap);
</script>
</body>
</html>

Above script would output and render an osm base map. Now lets start adding different features on map one by one with GeoJSON file.

Add or Load GeoJSON file – Load Polygon with leaflet on Map:

Add following script, and replace the ‘usa_adm.geojson’ to the file you are want to render.


// loading GeoJSON file - Here my html and usa_adm.geojson file resides in same folder
$.getJSON("usa_adm.geojson",function(data){
// L.geoJson function is used to parse geojson file and load on to map
L.geoJson(data).addTo(newMap);
});

After adding the polygon layer you may want to view or load the map area covered or extended by the polygon GeoJSON file. i.e On Map load you want to zoom and pan according to the extent or to fit layer bounds. For this, Leafletjs provided a function to calculate the bounding box of the geojson file or layer i.e layer.getBounds(). And also with leaflet map fitBounds function i.e map.fitBounds(“bounding coordinates”). Here is the line which you needs to add to script:


newMap.fitBounds(datalayer.getBounds());

Finally, we are left only adding a click event to get the features data. With the help of Leaflet L.geoJson optional object parameter with key “onEachFeature“, we can add and define click event on every feature of the layer.

Here we would be fetching the attribute data of the feature clicked on Polygon GeoJOSN file. So before writing any script, we need to list out the feature properties list. You can get those properties key name easily if you are familiar with JSON files and structure.

So lets define a function named as onEachFeature and replace the ‘key’ keyword with your actual feature properties key of GeoJSON file:


onEachFeature: function(feature, featureLayer) {
featureLayer.bindPopup(feature.properties.key);
}

So your final leaflet geojson code combines as i.e For adding polygon GeoJSON file on map, with click event and fit to extent functionality.


$.getJSON("usa_adm.geojson",function(data){
// add GeoJSON layer to the map once the file is loaded
var datalayer = L.geoJson(data ,{
onEachFeature: function(feature, featureLayer) {
featureLayer.bindPopup(feature.properties.NAME_1);
}
}).addTo(newMap);
newMap.fitBounds(datalayer.getBounds());
});

As I have loaded a US administrative polygon GeoJSON here, we can see following output as :

Add or Load GeoJSON file - polygon
Add or Load GeoJSON file – polygon

Add or Load GeoJSON file – polyline on Leaflet Map:

Adding polyline Geojson with leaflet library is same as adding polygon file. So the above code would work for loading polyline GeoJSON file. Just you need to replace the file name with your polyline GeoJSON file and features properties key have to replaced by the actual key name, of which you want to retrive information.

Add or Load GeoJSON file - polyline
Add or Load GeoJSON file – polyline

Add or Load GeoJSON file – point with Leaflet js on Map:

Adding Point GeoJSON file is same as loading Polygon GeoJSON file. Here is the output you can see for the famous world Cities.

Add or Load GeoJSON file - point
Add or Load GeoJSON file – point

If you find any difficulty in adding or loading GeoJSON file on map with leaflet library, do comment below with your queries.