Geographic Information System is a system intends to capture, Store, manage, manipulate, analyze the data.
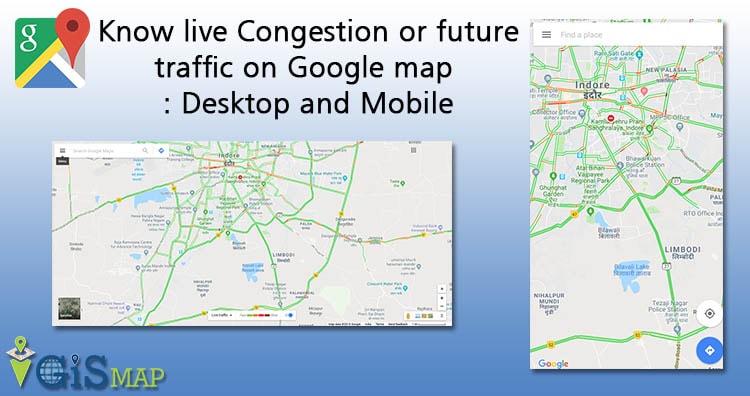
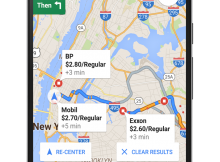
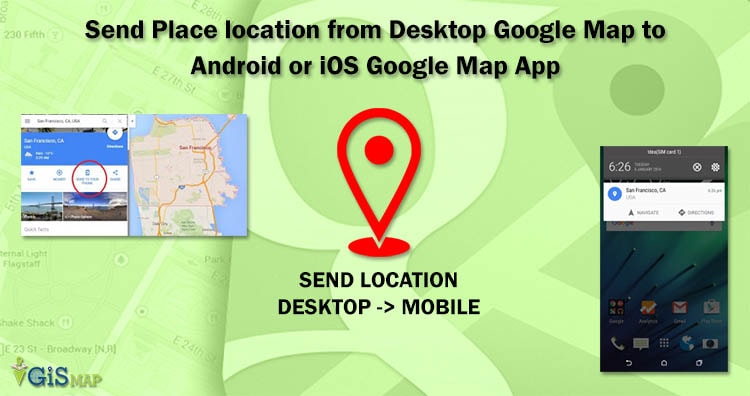
Know live traffic or predicted traffic on Google map. Are you planning for a road trip to either attend an important meeting, or to visit somewhere in a limited time. Don’t get afraid of reaching late at destination due to unusual traffic, as Google Map comes with its supreme feature of knowing live traffic condition at real time as well as predict the future traffic accordingly. Currently Google Map gives real time traffic condition and prediction for over 50 countries. Knowing traffic of a location without visiting the same physically at any time, isn’t it an amazing technology. Lets see an introduction of how Google Map provides live traffic and how one can use traffic feature of Google map on Desktop or laptop and also on Devices.
Introduction : How Google detect traffic condition
Lets have a quick introduction paragraph to know how traffic is detected by Google. Earlier, Google provided traffic data based on running algorithm on historical data, which doesn’t comes out to be so accurate. After that Google uses third party data and tools and now with the help of Crowd-sourcing, Google made a very fine judgment of traffic.
Yes, Google gather live data from the crowd. All those people who are currently using Google Map or using Android device with Location tracking or GPS enable, are eventually providing anonymous data to Google with speed and location information. This makes Google to track live data, process the data with algorithm to determine congestion considering all important factors and limitations and ultimately used to render the traffic layer on Google Map for free to all users.
Mostly Google covers highways and arterials roads to predict the traffic, when data is available. This data is stored on Google database servers. Ultimately Google apply mining process on this data and run prediction algorithm to provide “Typical Traffic” or “Future Traffic” behavior.
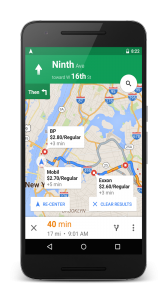
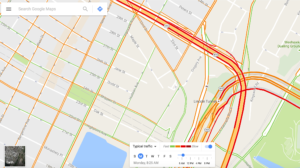
Google Map Traffic Color Shows speed of traffic on road:
Speed of traffic is shown in four different color i.e
- Green: Means no traffic.
- Yellow: Means there is some traffic, while it is tolerable and you could drive easily.
- Orange: Means there’s a medium amount of traffic and you may be delayed with this.
- Dark Red: A heavy traffic, means there are traffic delays.
Two other colors indicates:
- Blue: This line indicates your direction routes on Google Map.
- Gray: Indicates there is no data.
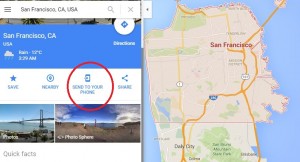
Steps to know live traffic or real time traffic on Google map on Desktop:
1.) Open Google Map on browser.
2.) Now write “Traffic” on the search input box provided, and press enter or search button. This would take you to your current location with live traffic layer displayed.
Or
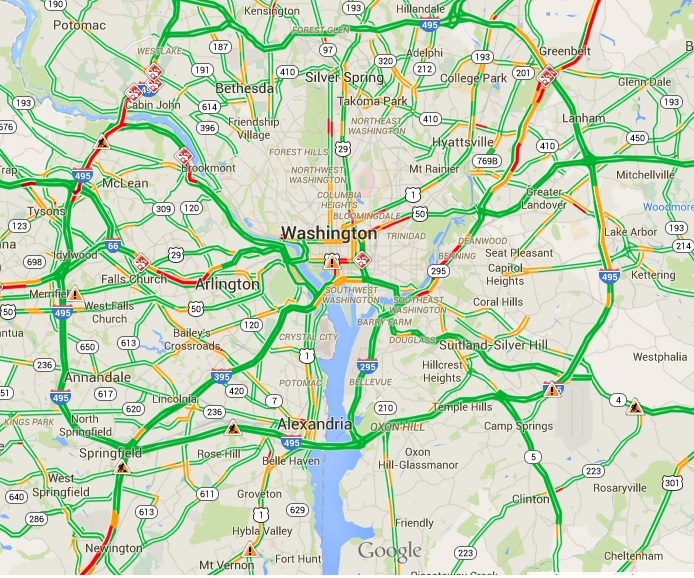
You may write “Traffic near ‘place’” for example “traffic near Washington, DC, USA”. And press enter. This would display area of Washington DC with traffic layer on screen.
3.) Now you may see detailed view of traffic by zooming in or out.
Traffic incidents let several delays. Google Map also indicate incidents while viewing traffic. Here are the few of the symbols you may see:
- Accidents

- Construction

- Road closures

- Other incidents
Steps to See the future prediction of traffic on Google Map – Desktop :
This is typical traffic which Google provides as a feature on Map, where traffic for an area based on the day of week and time can be searched and predicted. Here is the way to do it:
Update: Following are the updated steps i have found to predict the future traffic, as there is some UI changes in new Google map.
1.) You can either write traffic on the search box or open up the navigation menu and click on traffic button to get the colourful map displayed which enables traffic condition. By default live traffic is displayed on Google map.
2.) Now in the bottom center of the map, you need to click on drop down to switch to typical traffic.
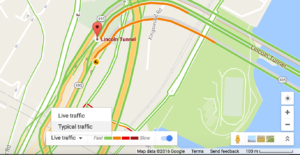
3.) Now select the day and time to get the future traffic map. As you will click on the map and change the date and time, google will load new layer on map without loading the map where the map displays the predicted traffic at your desired location.
Old Steps:
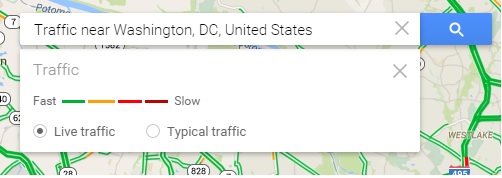
1.) Write “traffic” or “traffic near ‘place’” on the input search box provided and click on search button or press enter.
2.) Beneath the search box, you would find the two radio button labelled with ‘live traffic’ and ‘typical traffic’. Activate “Typical traffic” radio button.
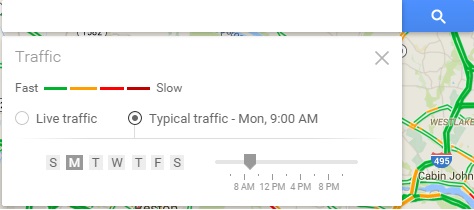
3.) Choose the day and time. This would refresh the new traffic map layer asynchronously, where you can see the predicted future traffic of particular day and time you selected of the location.
You may explore more Features of Google Map:
- Find your location history on google Map
- Know live traffic or predict future traffic with Google Map
- Measure Straight line distance
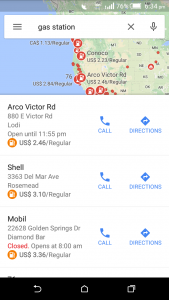
- Search nearby restaurants, hotels, parks, museum etc.
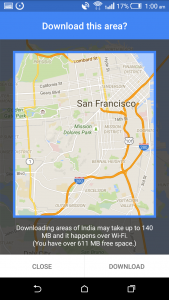
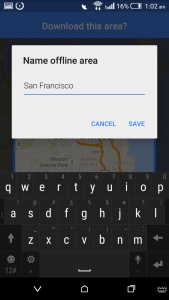
- Download And Save Google Map Offline
- Measure Area in Google Map
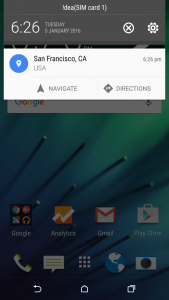
Know live Congestion or future traffic on Google map – Android or iOS device:
New version of Google map application for android or iOS device provides an easy way to know the current traffic condition of road.
1.) Open the Google Maps app in your android or iOS device.
2.) Touch the menu in the top left corner. 
3.) Select Traffic button.
This would provide you a layer of traffic on Google Map.
Do remember Google do make sure to process and provide accurate traffic details, however there may be chances that due to some less data availability their may be inconsistency. Whats your experience while using Google Map Traffic feature? Do you get accurate data result? Do share us by commenting below. Also if you find any problem in implementing the above steps do comment below.


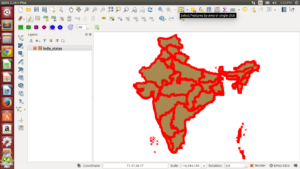
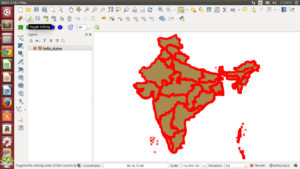 2.) Click on select tool from toolbar as indicated in the image.