Different ways to convert Shapefile to GeoJSON – Online or Offline or API

Convert Shapefile to GeoJSON. Shapefile, ESRI made a standard vector file format which is largely adopted in the field of GIS by programmers and geographers . While GeoJSON is also an open standard format designed for Web which largely supported with GIS JavaScript API, other programming API and with GIS (Geographic Information System) software tools too, for easily rendering. GeoJSON is based on JavaScript Object Notation. Here we will explore different methods to convert the files online, or offline or with the help of API which programmers can make use of.

Convert shapefile to geojson

You may be interested to refer following articles:

Different ways to convert Shapefile to GeoJSON

I.) Online Method : Convert Shapefile to GeoJSON:

The simplest and fast way to access the internet is through the online method, as you don’t need to install and configure any tool on your PC. Just drag the Shapefile files, one click on button and convert to GeoJSON. There are many website which provides the tool to convert the files by browsing them to server side and convert and also some client side conversion too. Lets explore the list, which is only client side as client side conversion will secure your file and doesn’t take your data pack for uploading the file:

A.) MAPOG Converter Tool :

IGIS Map tool is one stop solution for all GIS data analysis and conversion.

 Shapefile to Geojson Conversion

  •  Go to the tool MapOG Converter Tool.
  •  If you are already registered then login otherwise sign up.
  • Once get register tap on Converter Button Shown in figure.

Convert shapefile to geojson

  • Upload the Shapefile from data set or Google Drive or Drop Box or already added in drive then choose the file. Lets we want to convert already uploaded file from My Drive then select the file.

Convert shapefile to geojson

  • Tap the file and new window will appear shown below.

Convert shapefile to geojson

  • Select the desired Output in our case choose Geojson. You can also change CRS. Now tap on Convert file button.

Convert shapefile to geojson

  • It will so the table in the next step. You can directly download the converted file or you can check it through clicking on publish button.

Convert shapefile to geojson

  • Below is the screen of published Geojson file.

Convert shapefile to geojson

Whole process is same from new uploaded file from data set or from google drive or from drop box. If you face any problem ping us at website.

You might be interested in Query on Geojson data file then try our tool IGIS Map tool.

This is presented by Engineer Philosophy pvt. ltd, working in GIS Sector an IT company. What you need to do is to just Register, login and upload only .shp and .dbf file and then export the uploaded layer to GeoJSON file by just selecting the option which appear at upper right corner in Navigation bar. You can also explore the attribute table from the website directly and filter the same which no other online tool provides.

different ways to convert Shapefile to Geojson - Online or Offline or API
different ways to convert Shapefile to Geojson – Online or Offline or API

Not only this, but you can classify the Map according to the shapefile dbf attributes and automatically classify and color it. The classified map can be exported as Scalable Vector Graphics i.e svg file.

Disclaimer: The above project is handled by me and my team and the project is in beta phase while you can definetly convert the shapefile to GeoJSON at client side securing your shapefile data. I would welcome your suggestion to improve the tool by commenting below or contacting me.

B.) Map Shapper : 

Map Shapper is the best tool which we should refer first. It is the best online tool which also handles large shapefiles and renders it quickly. Its an open source project and is licensed under MPL 2.0. Just drag the shapefile or zipped shapefile which will render the shapefile on map and can be further exported as geojson file with the option provided in tool itself.

different ways to convert Shapefile to Geojson - Online or Offline or API

With No doubt Map Shaper is much more better than any other tool for now, while the only reason why I placed this tool in second place just because the first tool was my own tool which provides more option for classifying the map, see all attributes in the data table and also exported as svg file.

2.) Offline Method – Convert Shapefile to GeoJSON in QGIS:

You must have installed QGIS  (Quantum GIS) before performing the provided steps. You may also look over other tutorial in QGIS.

1.) Open QGIS Desktop and Select Layer -> Add Layer -> Add Vector Layer or click on Add Vector layer icon appears at the upper left in the application.

different ways to convert Shapefile to Geojson - Online or Offline or API
different ways to convert Shapefile to Geojson – Online or Offline or API

2.) Select the zipped shapefile or any of file i.e .shp or .dbf or .shx by browing the folder. Note, that all the three files i.e .shp, .dbf and .shx file should be present in the same foder with same name.

3.) Once uploaded, the map will be rendered and showed in QGIS application. Now navigate to Layer menu and select Save As option or just from the layers panel select the layer and right click from it to select Save As option.

4.) A window pop up will opne up. From the window just select the GeoJSON format and provide the name of the file in the input box as shown in the image provided below. Save the file. It will export the file in GeoJSON format.

different ways to convert Shapefile to Geojson - Online or Offline or API

3.) Offline Method – Convert Shapefile to GeoJSON with command line ogr2ogr tool:

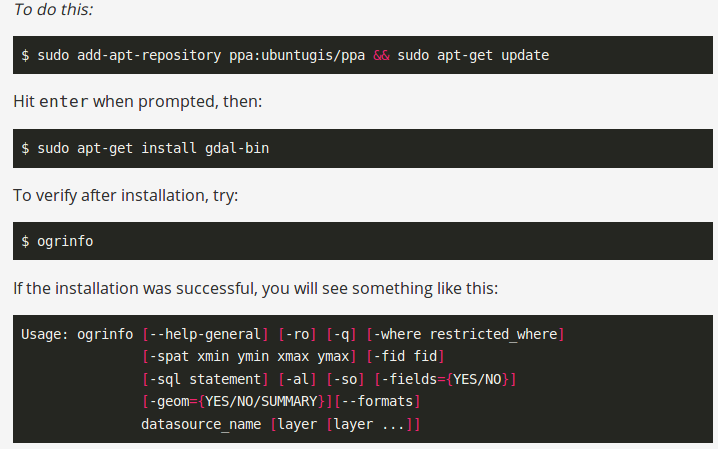
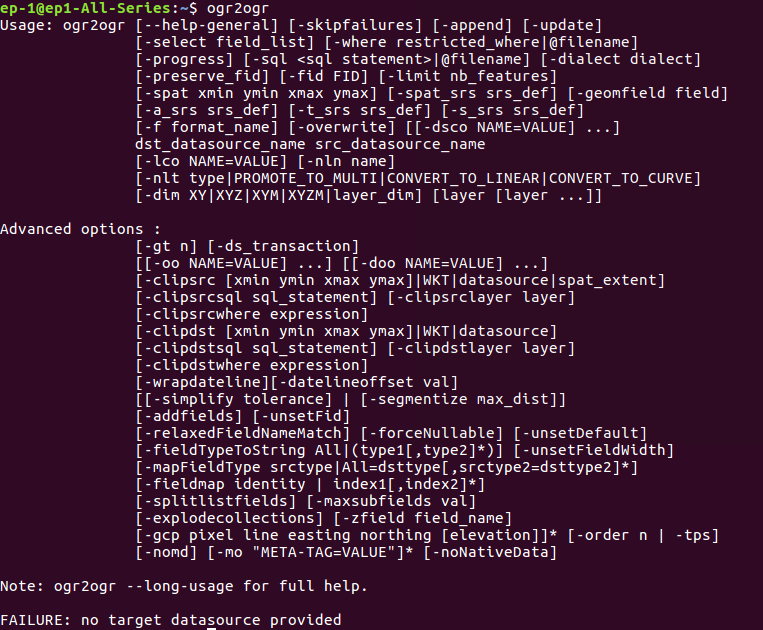
Firstly you need to install an ogr2ogr tool of GDAL which is a GIS utlitly command line tool so as to convert one file to another. Now if the ogr2ogr is installed globally check by simple tying the ogr2ogr in command line if it is working or not. Or if it residing in some file system you need to navigate to ogr2ogr file and type in the same in command line. Now Just type in the following:

  • “ogr2ogr -f GeoJSON -t_srs crs:84 [name].geojson [name].shp”

To get more option list and format you may see this gdal org link.

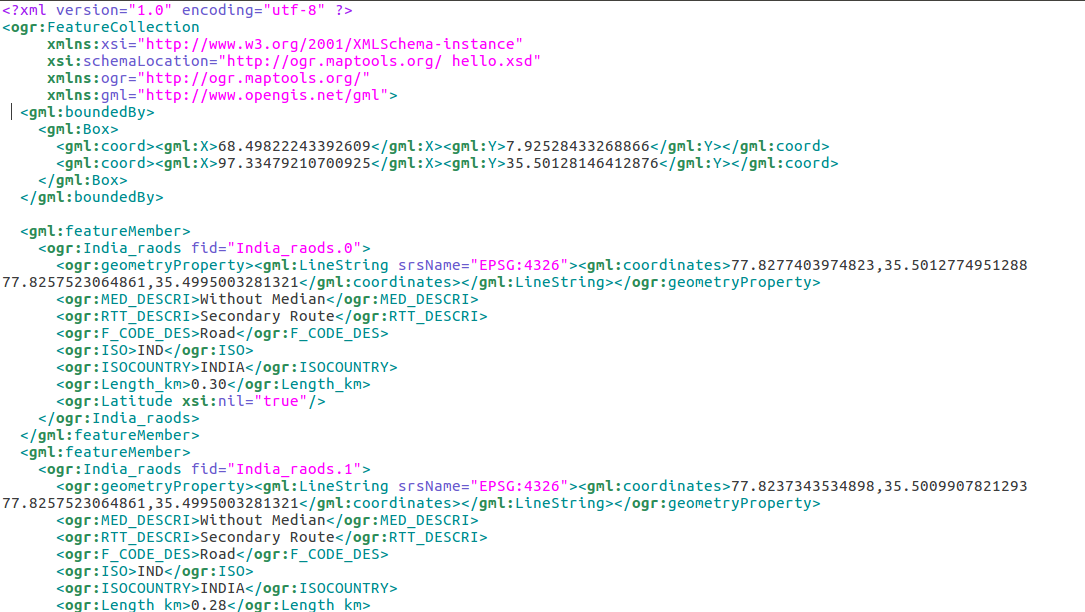
This tool will be helpful if you want to convert bulk files from shapefile to geojson. You can refer the .sh script found at github.

4.) Convert Shapefile to GeoJSON -API or library:

Shapefile is a binary file and cannot be viewed directly in notepad or textpad as like with GeoJSON file. So if you want to create your own API, to convert Shapefile to GeoJSON you should first have a knowledge of how to read the binary shapefile. You may refer to some of the articles which I have written some post which would help you to get the basic knowledge to know the format of files and read.

You may further refer to some of the best Shapefile to GeoJSON converter API which is open source project:

https://github.com/wavded/js-shapefile-to-geojson :  This is dedicated library to convert to GeoJSON, created by Marc Harter and Licensed with MIT.

https://github.com/gipong/shp2geojson.js : This library is also MIT Licensed and is inspired by the above wavded library which uploads zipped file of shapefile. The library provided an example to use with leaflet js.

https://github.com/mbloch/mapshaper : Map Shaper as desricbed above is licensed under MPL 2.0 and can be very useful if you want to convert to GeoJSON as well as TopoJSON.

Hope this article helped you. If are facing some problem in converting the shapefile to geojson do comment below with the problem statement. We will definitely look over that. Also you can provide your valuable comment below if you are using any other library or tool to cover the same.

5 best News maps website- Read Interactive live news on World Map

News Map Website – News, a new information either event, accident, social work, terrorists, sports, technical, launches, new innovation or election or in any form has some link with physical geographic location. How you filter latest news for a particular area or location? It would be really easy, nice and great way to filter the location based news from the interactive world map.

This news map website is really useful when you want to narrow down the data of location of which you are interested in. Not only this, but you can easily analyze new happening either good or bad around the world by seeing those sticky icons, or with cluster size or with colors.

Here are the 5 best News Map Website – Read live news on World Map

1.) Liveuamap:

Liveuamap is opendata-driven media platform that change the way you receive latest news with Map. Liveuamap supports Multi-language and provides current data from various sources and social media websites. Not only it fetches the data and shows you map but it also analyse the category of news and indicate the icon as shown below i.e like Anti-air, SAM  Biohazard, Camps, tents,  Captured Crane, construction  Dead, Destruction  Drones, robots, Drugs,  Electricity, blackout, Explosion, blasts,  Facebook, Firebombs,  Fires etc.

Liveuamap - News maps website
Liveuamap – News maps website

If you missed news from previous dates, you may select that date and grab the news easily. With website liveuamap also available in both android and iOS app. It is really an awesome and that why I have placed it on first position from all news map website.

2.) GDELT project:

GDELT project is taking feeds from various websites like Google Ideas, Google and Google News, Yahoo Fellowship, BBC monitoring etc covering over 100 languages and identifies the people, locations, organizations, counts, themes, sources, emotions, counts, quotes and events driving our global society every second of every day.

You may see their two projects one which uses CartoDB platform. You can explore the dotted map from here.

And the other which shows you live trend with image over icon on maps. With map you can also explore the advance analytics data.

news map website

3.) Heat Map News

Heat Map News is another website which takes out news from Google News and is currently running 3.1 version and is been updated since 2014. You can view hotspots over world map and click over desired area to get the current news headline over up maker popup with link to the source of news.

http://www.heatmapnews.com

We can filter out the news according to last hour, today, this week or even by selecting the date.

4.) BBC News on World Map:

BBC news is one of the most popular news network. They provided a very simple news map website. Just click over the regional view i.e continent of world and get the latest top 10 most popular news or top 10 most e-mailed news.

BBC map news - News map website

5.) There are many map news website which are live on internet. Let us list out two more:

a.) Global Incident Map:

It provides global display of terrorism and other suspicious events. They provide free as well as subscription based news. While free version of map is time delayed for 24-48 Hours. Its sub domain points to other news categories also which can be seen over map viz Amber-Alert Map, HAZMAT Situation Map, Forest Fire Map, Disease Outbreaks Map, Gang Activity, Border Security issue etc.

global incident map
global incident map

b.) Newseum:

This map fetches and display various newspaper front page around the world. You can explore this map from here.

You may also see an example of ABC news which was created with the help of Google Map Engine or my Google maps. While this map is not providing live feeds, but one can take a look over it to find the solution for how to create the map news website easily and quickly. Knowing about location of the news is really important to analyze the situation. What you think about the News and map association? Do comment below if you know any other news website displayed over map or if you want to share any important views related to this post.

Download Digital Terrain DEM (Digital Elevation Model) and create contours Maps

Digital Elevation Model is a 3D representation of a terrain. It is generated by collecting elevation points of terrain. We don’t have to do hectic work like this as webgis provides us with ready-made digital elevation data. WebGIS is where you can find all the leading information and resources for Geographical Information Systems. Here you will find how to download Digital Terrain Data and create contour map.

Download Digital Terrain Data:

1.) Go to link: http://www.webgis.com

2.) Digital Terrain data is all we need. You can explore the links given. We will download from SRTM. You can read the documentation for information. Click on SRTM 3.

3.) Click on large map.

Digital Terrain Data create contour map

4.) Here you can determine the coordinates of the tile in which your location is lying. You must know where your location is on earth i.e. North East or North West etc. As you determine the coordinates of tile, go to previous page and Click on the map where your location is.

5.) Now click the tile from the index you determined from the large map. It will automatically downloaded to your computer after clicking the link.

Digital Terrain Data create contour map

Extract DEM and create contour Map:

Contour map shows contour lines with relative space indicating the relative slope of the surface. Here we will open DEM in QGIS and create the contour Map.  Here are the steps:

1.) After opening QGIS, we first need to extract the downloaded file, and import the .hgt file using add raster layer tool in QGIS, where you will see a singleband gray image as shown below.

Digital Terrain Data create contour map

2.) Go to layer properties and click style. Notice the minimum and maximum value. These values are in meters.

Digital Terrain Data create contour map

3.) In render type dropdown select singleband pseudocolor and click classify.

Digital Terrain Data create contour map

4.) Click apply and ok.

Digital Terrain Data create contour map

5.) Now we will extract contours from this image. Go to Raster-> Extraction-> Contour as shown. 

Digital Terrain Data create contour map

6.) Set the pop up as shown below.

Digital Terrain Data create contour map

7.) Click ok. The contour file is loaded into your canvas.

Digital Terrain Data create contour map

You may also be interested in QGIS tutorial. Now you can easily analyze the surface by seeing the contour map. Hope this tutorials helped you. If you want to share some suggestion or want to ask some question do comment below.

Create 3D Map from DEM

Switch between Google New Map and Google old Map (Classic)

Switch between Google New Map and Google old Map (Classic). Google Map is a web mapping service which offers satellite imagery, street view and street map with many other functionality. Google introduced their New map in mid of 2013, with new User Interface and other improved features. While people are used to old user interface, which makes them to think again of using old (Classic Map) interface of Google Map. Google always thinks and create their product with reference to common people perspective, and that would be a reason why they have given to revert to switch to Classic Google Map. Here are the steps to revert back to classic map:

Update: (As of April 29, 2015) The steps provided below to switch back to classic map, may not work, but you can still try to use any of the link provided, for some days may be, as it will soon be updated to Google New map:

Also you may look on 8 Best Alternatives to Google Map Engine API, Google announced to deactivate Google Map Engine API from 29 January, 2016.

As an alternative you may look on Features of Google Map Lite Mode.

Switch between Google New Map and Google old Map (Classic)

1.) Open Google Map.

2.) Click Help icon, which you may find in bottom right corner of map.

Switch between Google New Map and Google old Map (Classic)

3.) Click return to classic old Google map.

4.) You can write feedback about the new map for the improvement, and again click to revert to classic map, which finally returns you to Google classic old map.

Switch between Google New Map and Google old Map (Classic)

Here is the direct link to switch back to Google Classic map from new map:

You can also switch back to new version of Google Map. By default when you open up maps.google.com, it will response with new Google map. If you getting any problem with Switching back from Google new map to Classic map, do comment below, so that we could discuss and reslove the issue. Thank you.

Sorting feature from left to right – MySQL Spatial Sorting

MySQL Spatial Sorting. Let’s think of the situation where you want to color the map in such a way, that no adjacent group of features should have the same color, where group of feature is more than the number of colors you can draw. Obviously this problem can be solved if we sort feature group from left to right and assign the color in the same order. The above described situation has to be solved by us where we need to restrict our technology to only to, GeoJSON, Leaflet, Php and MySQL and no server side API or any GIS server as per the  Client requirement.

MySQL Spatial Sorting
MySQL Spatial Sorting from left to right

Now as the task is assigned to us, we need to identify and solve the same maintaining the time complexity and load at both client as well as server end.  Here we need to sort the feature according to upper left latitude longitude values  of each feature bounding box and not with an area or length or with any other attribute in ascending or descending order. Someone can think to sort the features by finding the center latitude longitude point of the features and then sort feature according to the center, but this will only work, when all features are of same size which is not in real world case.

Sorting the features with known bounding box from left to right can be performed with the array of geoJSON feature and leaflet alone at client side, but this will definitely increase the time complexity and load on the browser when spatial data file is very big. The last and the final option we have, is to store the Shapefile or GeoJSON file in MySQL Spatial Database and perform the spatial operation in MySQL to get selected feature in sorted order.  Sorting feature from left to right order means we need to work with longitude values of bounding box of feature. If you want to perform sorting the features from top down then use latitude values.

If you understand the store procedure easily then you may navigate to bottom of the page else you can follow the tutorial to know what steps are taken to make the complete stored procedure to sort the features in MySQL.

Note: The tutorial given here for the GI S person who don’t know to operate on database. To make them understand every step is detailed clearly. If you are expert in database, do navigate to bottom of the post and find the stored procedure.

MySQL Spatial Sorting – Steps Performed to Sort the features in MySQL:

1.) First step is to import the shapefile in the Database using ogr2ogr command tool and check whether every feature is inserted correctly in the desired table. Once inserted the next step we need to perform is to calculate MBR(minimum bounding rectangle) for each feature and only select the longitude values of the first starting point, as the first point is the upper left corner point of MBR.

2.) Let’s start our task by finding the MBR for the entire features. We can also call MBR as bounding box of the feature. If you noticed after importing the shapefile in MySQL all the features are saved in a column named SHAPE with a datatype GEOMETRY which makes us eligible to perform spatial query on this column. To find the bounding box of the feature there is a spatial function envelope(g) which returns the MBR for the geometry

SELECT ASTEXT( ENVELOPE(  `SHAPE` ) ) FROM  `feature`

  • In the above query ‘feature’ is the name of the table.
  • ASTEXT() function returns as text the result returned by the ENVELOPE().

Using this query you will get the MBR but we don’t need all the coordinates we only need the longitude of the first point of the result. So we need to take out that longitude and save it to the new column which will ultimately make very easy to sort feature in ascending order.

Unfortunately, we cannot save the result of the select query to the same table so we have to go little further and have to save the result into a new table or a view. Make a new table with two columns, one column for saving the longitude value having data type as text and one for foreign key referenced to the ID column in the main table. Don’t insert any other values or column in the table.

Now let’s do this tedious task:

INSERT INTO new_feature( stpoint ,id)  SELECT SUBSTRING( SUBSTRING_INDEX( ASTEXT( ENVELOPE(  `SHAPE` ) ) ,  ‘,’, 1 ) , 10, 9 ),id  FROM  `feature`

  • Above query take out the longitude of the starting point and save it into stpoint in the new_feature table and at same time save the same value of the id from feature table to the id in the new_feature table.
  • SUBSTRING_INDEX() function will take out the text before the first comma that appears in the result given by ASTEXT( ENVELOPE( `SHAPE` ) ).
  • SUBSTRING() will give us the required longitude value. 10 in this function represents the starting value and 9 represent the length of the value that we want.

If you analyse the result of the query i.e by

SELECT ASTEXT( ENVELOPE(  `SHAPE` ) ) FROM  `feature`

You will find that the result is in the form POLYGON((long lat,long lat…)).

From this result 10 and 9 came characters to be used in SUBSTRING(). Now we can join the two table using id column in both table and get the desired result. But the sorted result we get is wrong.

If you noticed during the process we get the result as text and we apply all the operation on the text and our stpoint column have data type as text. So the sorting will be done as text sorting so any longitude value starting with 1 will come first and values starting with 9 will come last. To avoid this problem we have to change the data type of the stpoint column to decimal.

ALTER TABLE new_feature MODIFY stpoint DECIMAL( 7, 4 )

In DECIMAL( 7, 4 ) 7 represent the length of the number. That we need and 4 represent the numbers after the decimal so the result be something like 23.4567 or 123.4567.

3.) Now we will join the two table and simultaneously sort the result:

SELECT feature.*, new_feature.stpoint FROM feature INNER JOIN new_feature ON feature.OGR_FID = new_feature.OGR_FID ORDER BY stpoint

We want all the columns from the main table and only stpoint from new_feature. The above query by default will sort the feature in ascending order. Save the result. MySQL will export the result as excel file.

MySQL Spatial Sorting
MySQL Spatial Sorting from left to right

You can also write a stored procedure for this process. In stored procedure you don’t have to create a new table instead you just need to create a temporary table which will destroy after the end of the session. Here is the Stored procedure:

MySQL Spatial Sorting from left to right – Stored Procedure:

CREATE DEFINER=`root`@`localhost` PROCEDURE `SortFeature`() MODIFIES SQL DATA COMMENT ‘sort feature in ascending order(long of 1st co. of mbr)’
begin

CREATE TEMPORARY TABLE longitude(OGR_FID int(4) not null , stpoint text(10));

INSERT INTO longitude( stpoint,OGR_FID )
SELECT SUBSTRING( SUBSTRING_INDEX( ASTEXT( ENVELOPE(`SHAPE`)) , ‘,’, 1 ) , 10, 9 ) , OGR_FID
FROM feature ;

ALTER TABLE longitude MODIFY stpoint DECIMAL(7,4);

SELECT feature.*, longitude.stpoint
FROM feature
INNER JOIN longitude ON feature.OGR_FID = longitude.OGR_FID ORDER BY stpoint ASC;

end

I hope the above lengthier post might helped you to find a way to sort the features from left direction to right direction with MySQL Spatial Sorting query.

Measure Area in Google Map – Print and share measurement

Google Maps, a web mapping service of Google provides a very easy way to calculate and measure Area in google Map along with distance measurement. This would let you measure an area of any geographic location viz home, buildings, Grounds, city, etc from any where without visiting the location with just few clicks with Google Maps.

Measuring area is of the most important part of GIS analysis before coming to a conclusion of any project of construction or any other industries. Yes, as a fact to show to your customer or client, you need to provide a printed or soft-copy version of area and its measurement. Google Map provide the feature to print and save soft copy of the map after performing operation, which can be performed with the steps written below.

measure area in Google map

Steps to Measure Area in Google Maps:

1.) Open Google Map and check whether you are not in a Lite Mode Google Map, as Lite Mode does not provide an option to calculate and measure area. If you are in Lite mode than switch back to Full mode of Google Maps.

2.) Navigate to area in a Map of which you want to calculate the area.

3.) Right click on Map from the starting point of the area and select Measure Distance as shown below. (Don’t worry and continue the process as it will calculate area also along with distance.)

measure area in Google map

4.) Click on the map to create points so as to create an appropriate area. If you want to get the correct and good result, you should zoom in the map and click along the points to make an area. Remember to get the result in area, you need to connect the last point with the first point on Google Map other wise the measured unit will always be length and not area. Once you connect last and first point, you will get the measurement in distance as well as area.

measure area in Google map

If you find any point to be incorrect you may drag the point to get in the correct position or you may again click the point to remove the same. You may also clear measurement with the option provided with the right click on map.

  • Note : Both English and Metric unit System is supported in Google map depending upon your location. If your map is zoomed out and you are measuring a large area, the distance unit will appear in square miles (sq m) or square kilometers (sq km) while if the distance measured in Zoomed in map, then the area unit appear to be in the square feet (sq ft) or square meters (sq m).

You can explore Google Map more feature with the following articles listed:

Print Measure Area in Google Maps

You can easily make a print of the area along with the measured unit, the area covered and the title of the map shown. After performing the above steps. Right click on Google map and select print option. It will take to print section where you can also put up your notes which will appear on just above the maps and the measurement units just below the map.

measure area in Google map

Now you can easily share the printed or soft copy of the measured area on the map. A sample example of the image generated by google map is shown below.

Print measure area in Google map

Comment below if you are getting any problem in performing the above steps. You may also list the tools which provide the same solution and which you prefer by commenting on the section provided below.

Add table attributes with joining two files in QGIS

Want to add more attributes in your Shapefile to respective feature? QGIS an open source tool, which I recommend to every Geographer for use, can give you direct solution. Sometimes we need to join more attribute to a GIS vector files which ultimately provide more power to you for analysis with more attributes. For joining two file to add more attribute you need to have a common attribute field in both the files, same as like you need to have primary and foreign key to join two table data in SQL. QGIS provide us the facility to Add more table attributes with joining two files .

You may also be interested to see how to perform Spatial Join in QGIS and other tutorial in QGIS.


Add table attributes with joining two files

Steps to Add table attributes with joining two files in QGIS:

We are performing this steps with Shapefile and csv file, while you can also perform the same steps with other GIS vector file and csv file.

1.) Open QGIS and add a shapefile and observe its attribute table.

Add table attributes with joining two files

Here we have two columns.

Add table attributes with joining two files2.) Now We have a comma separated file(.csv) which has to be added. Having two columns i.e osm_way_id and amenity as shown below.

Add table attributes with joining two files

Note : Both the field will store in String format as we have not defined the field type. To define field type, create a new file with the same name of that of csv file but with csvt format in the same folder. For above instance the content should be written as :

“Integer”,”String”

in the file. We can see that osm_way_id is the column which is common in attribute table of shapefile and .csv file. So we can join this two using the same.

3.) First we have to import this file in QGIS. QGIS provide us the facility of importing files which do not have any geographic information also. While importing .csv file we have to take care that default type for .csv file is string if .csvt file is not present in the folder.

QGIS will look for .csvt file for data type in the same folder of same name. If not found all the data would be imported as default type i.e String. Now here all the columns are string so we are not creating a .csvt file.

4.) Lets import this file in QGIS. Click layer than Add Layer and select Add Delimited Text Layer.

Add table attributes with joining two files5.) Select csv radio button and then select no geometry radio button.

Add table attributes with joining two files

6.) Click ok. The file is imported.

Add table attributes with joining two files7.) Let’s join both tables. Open properties dialog box of the layer for which we want to perform join.

Add table attributes with joining two files8.) Click on join.

Add table attributes with joining two files9.) Click on plus sign.

Add table attributes with joining two files10.) Set the dialog box as in the image. We have chosen the field according to which we want to join and the field which we want to join with the table. By default all the fields are added.

Add table attributes with joining two files

11.) Click ok.

Add table attributes with joining two files12.) Click ok for properties dialog box.

13.) The tables are joined. Open the attribute table for the layer for which you performed join. The column name Book1_amenity shows that it was imported from Book1.

Add table attributes with joining two files

Comment below if you are facing any problem in adding attributes data to respective features in QGIs with Join function.

QGIS 3.2.1 User Interface


Insert Shapefile in MySql as Spatial Data

MySQL supports Spatial data type that corresponds to OpenGIS Classes. While MySQL is not one of the recommended database to store spatial data, but it definitely adds value if you have only one option to store GIS data. For instance I need to dump the Shapefile in MySQL, when I need to render the spatial data with leaflet in order of sorted latitude longitude one by one. This could be easily possible to get the spatial data from MySQL where we don’t need to use any GIS API to get and perform spatial operation.

Insert Shapefile in MySql as Spatial Data

To dump or insert a shapefile in a MySQL server we need to install ogr2ogr tool in our machine. If you have a windows machine and you have installed QGIS using OSGeo4W then this tool comes with the org2ogr package.

update: You may also see the ogr2ogr in program files folder of QGIS as shown below.

Insert Shapefile in MySql as Spatial Data

Insert Shapefile in MySql as Spatial Data

1.) Now open the MySQL server and create one database or use one of the existing database. I have made a database named as “spatial”.

2.) Open the command prompt as administrator. I have ogr2ogr file in C drive->OSGeo4W->bin folder. So navigate to this path in command prompt with change directory command (cd).

Insert Shapefile in MySql as Spatial Data

3.) Now write the command as follows:

ogr2ogr –f MySQL MySQL:database_name,host=localhost,user=database_username, password=database_password path/to/shapefile  -nln datatable_name -update -overwrite -lco engine=MYISAM.

Where you need to edit the bold word written above according to system configuration and need.

Note: If table and its column is not created, then the above command will automatically will create the table name as “datatable_name” as indicated above. You may also define SRS by giving argument as  ‘-a_srs “EPSG:4326″‘.

Reference : http://www.bostongis.com/PrinterFriendly.aspx?content_name=ogr_cheatsheet

I hope this post would helped you to insert spatial data in MySQL easily and you are now eligible to perform Spatial Queries on MySQL data. If you still find problem in performing any step above, do comment below with details, we may look and discuss over the same.

Everything about Web 3D Map – Examples, Tools, Library and Uses

Map with third dimension on Web gives you a new way to visualize reality. Isn’t that cool if you get to know building level detail,  Analyze the surface by getting elevation detail and get the actual visualization to some extent even without visiting the area. Adding third dimension to a map is an add-on for geographers, government bodies and to every individuals for proper understanding the geographic area.
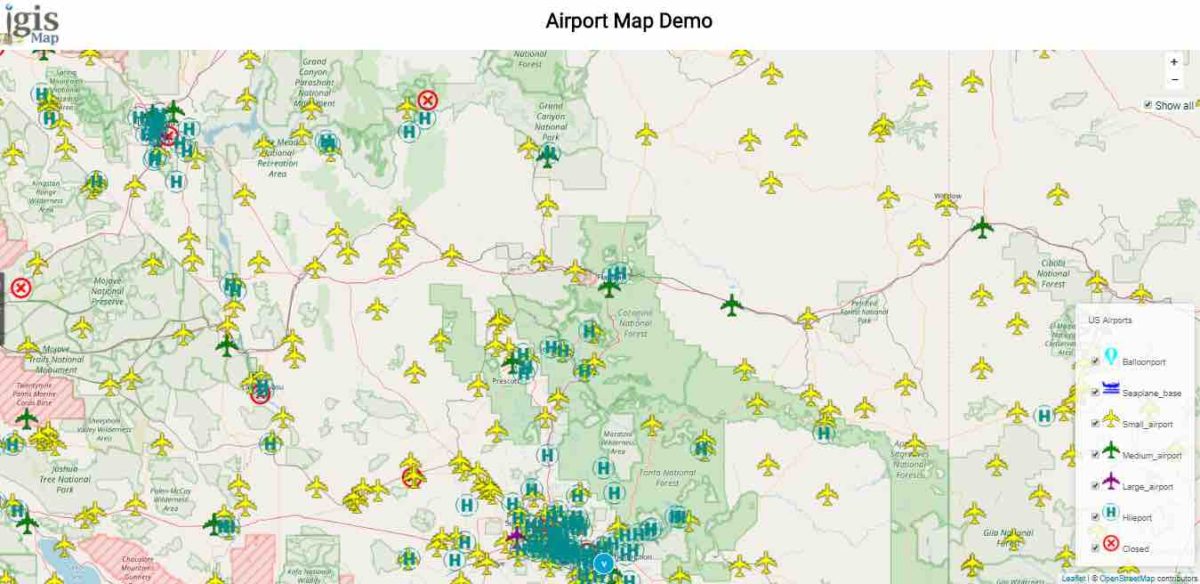
Website with power of internet is connecting every people in this world, to acquire knowledge and now creating and viewing a 3D map on website without adding a plugin is an awesome. Before moving to see Examples and Libraries lets list out some uses for 3D Map.

3D Map

Uses of Interactive 3D map:

Several industries like Retail, Real Estate, Tourism, Geo Advertising, Smart cities etc can take advantage of Web 3D Map with existing GIS database knowledge.

1.) Get introduced to a new place before taking a tour to an unknown area.

2.) Create a walk-through of newly constructed building to visualize new concept easily.

3.) Visualize 3D Flood modeling simulation while planning construction development.

4.) 3D urban map with existing GIS databases.

5.) Get better understanding of 3D elevation view of natural features like mountain, canyons etc.

6.) Campus planning – Better understanding shadow effects, sun exposure, road etc.

Finally 3D Map brings more idea to your GIS analysis.

Amazing Library which helps you to create web 3D Maps easily:

You can now easily build and visualize your 3D Map model on website without adding any plugin or additional addon. This all can be possible with the help of WebGL technology which is a JavaScript API for rendering interactive 3D graphics. This libraries can help you to create interactive map which helps you to see the data on basemap, zooming and panning functionality which can be incorporated easily with the help functionalities provided.

1.) OSMBuildings GL – 3D Map Library:

Osmbuilding 3D map

Demo : OSMBuilding Demo

Download Library Code : Github Code

Type : Open Source, MIT License

Technology : WebGL, OpenStreetMap, OpenCage Geocoder, MapBox tiles

Developed By : Jan Marsch

2.) ViziCities – 3D Map library:

Vizicities 3D map

Demo : ViziCities Demo

Download library Code : Github Code

Type : Open Source, MIT License

Technology : WebGL via Three.js and openstreetmap

Developed By : Robin Hawkes & Peter Smart

3.) CesiumJS – 3D Map Library:

Cesium 3D map

Demo : CesiumJS Demo

Download Library Code: Github Code

Type : Both Commercial and Open Source with Apache 2.0 License

Technology : WebGL

Developed By : Analytical Graphics, Inc. (AGI)

4.) Tangram – 3D Map Library

Tangram 3D Map

Demo : Tangram Demo

Download Library Code : Github Code

Type : Open Source, MIT License

Technology : WebGL, OpenStreetMap

Developed By : Mapzen

Other Libraries, Tool and Examples for 3D Map

ESRI CityEngine: A software which Transform 2D GIS Data into Smart 3D City Models. You may look further docs here.  An Awesome Example of 3D Map with the help of ESRI CityEngine.

Octomap: Probabilistic 3D Mapping framework. Its an open source map under New BSD license. You may see Github code from here developed by Kai M. Wurm and Armin Hornung, University of Freiburg.

Android 3D map with Nutiteq SDK: You may see the github code from here and is licensed under MIT License.

You may Further research over Glob3Mobile which is the multiplatform advanced visualization framework and
Ol3-Cesium – 3D for OpenLayers map.

What you think about 3D map on website. Do comment below with  if you are looking to develop or want to create a sample or you know any new libraries which I have not listed here?

How to Georeference Map Image with Geo Coordinate Control points

How to Geo-reference Map Image with Geo Coordinate points in QGIS (Quantum GIS). Georeference is a process to associate geographic location coordinates to any kind of physical object which is physically present over a Raster image map or to a physical map, with help of other georeferenced data or with know location coordinates of some points of image which is effectively called as control points. Georeference is one of the important concept of GIS (Geographic Information System). Here we will see how to Georeference map manually in QGIS. You can also see how to georeference from one map to another and other QGIS tutorial.

Here is the steps to georeference raster image map in QGIS:

1.) Open QGIS and Import your image map using ADD RASTER LAYER in QGIS.

Georeference Map Image with Geo Coordinate Control points in QGIS2.) We need to find the control point and known geolocation coordinates. I prefer Google Maps to get the Latitude and Longitude values.

Go to google map and search the location which matches your image map location on it. Select a point in google map which matches in your map. You can also switch to satellite view. Select a point such as any land mark place as per your convenience. Right click on that point in Google Map and click what’s here you will see it will display latitude and longitude of the point.

Georeference Map Image with Geo Coordinate Control points in QGIS 1

Georeference Map Image with Geo Coordinate Control points in QGIS 1

3.) Latitude is written first and the second one is longitude. Also notice (-) sign (if present). Note down the points. Likewise select at least 4 points in different directions and note down the latitude and longitude of them.

4.) Moving to QGIS tool, Right click on the Raster layer and click remove.

5.) Now go to Georeferencer, you will find it in Raster tab, if you already have installed georeferencer plugin. If you don’t see the option, click Plugins and then select manage and install plugins. Search for georeferencer and install the same as shown below.

Georeference Map Image with Geo Coordinate Control points in QGIS

Georeference Map Image with Geo Coordinate Control points in QGIS 56.) Import your map here and click add points. You can pan and zoom here.

Georeference Map Image with Geo Coordinate Control points in QGIS

Georeference Map Image with Geo Coordinate Control points in QGIS

7.) Click on the location on your map which you selected on google map as control points. You will see a window demanding X,Y values. Put longitude value in X and latitude value in Y.

Georeference Map Image with Geo Coordinate Control points in QGIS8.) Like wise add all the points. Go to Settings and click Transformation Setting.

Georeference Map Image with Geo Coordinate Control points in QGIS9.) Select any one Transformation Type and Give your output raster name.

Georeference Map Image with Geo Coordinate Control points in QGIS

10.) Click load in to map canvas when done or if you forget to do so you can import the georeferenced map from the location where you saved it. The extension for the map will be .GeoTiff.

11.) Select CRS WGS: 84 because we are using Latitude and Longitude.

Georeference Map Image with Geo Coordinate Control points in QGIS12.) Now click start Georeferencing symbol as shown below:

Georeference Map Image with Geo Coordinate Control points in QGIS

13.) Close georeferencer. You will see georeferenced image in canvas. Note the coordinates.

Georeference Map Image with Geo Coordinate Control points in QGIS

I hope this article would be helpful for you to know the basics of how to georeference raster image with the help of control points. You are getting problem in implementing the process do comment below, so that we can discuss over it.