Geographic Information System is a system intends to capture, Store, manage, manipulate, analyze the data. GIS system integrate data and convert it into maps. And as we know visuals are more powerful than words so it makes our understanding of data fast.
What is GIS ?
GIS is a tool to acquire geographic data and produce Geographic information. And generally those information are stored in tabular form. GIS can be defined as a “computer information system that can input, store, manipulate, analyze, and display geographically referenced (spatial) data to support decision making processes”.
Simply GIS visualize your data as a map. And these visualization makes the study interesting with interactive maps. It saves the time and make the system decisiveness that is main requirement.
It is not a whole HTML file or long scripts. It is just one HTML tags i.e <iframe>, to show map. On your computer, you can embed a map, Street View image, driving directions, or search of map into your website or blog. On your computer, phone, or tablet, you can share a location or map with others over email, Google+, Facebook, Twitter, or text. Lets see how to Embed HTML Google Map in your website.
There are three main part in iframe tag of google map which help us to set proper map.
1. Mode
2. API_key
3. parameter
Example of html iframe tag to embed html google map:
The mode section mainly consist place, directions, search, view, or streetview.
Place in google map link- Place displays a map of particular place or address, such as a landmark, famous building, geographic feature, or town.
Directions in google map link- mode displays the path between two or more specified points on the map, as well as the distance and travel time. Search- mode displays results for a search across the visible map region.
View- (streetview) mode returns a map with no markers or directions.
API_Key in Google Map to Embed html:
This is your free API key. You need to login to your mail account and navigate to
This includes some optional parameter which can be mode specified also.
The parameters are given as Center- To set this parameter you need to give comma separated latitude longitude value. This will set the map view in middle.
Zoom- To set Zoom level You need to give integer value from 0 to 21, where 0 defines the whole world view and 21 defines the building level zoomed view. This also depends on location selected and data availability of that location.
Map Type- there are two type of map roadmap or satellite. Region- defines the appropriate borders and labels to display, based on geo-political sensitivities.
Language- This set the language, which will be display on map tiles for User interface elements and labels available on map.
Other than these option we also have some option to set width and height of google map for html embed. We can also set frame border and style of that border. We can specify the allow full screen option to make map available on full window.
Steps to Embed HTML Google Map
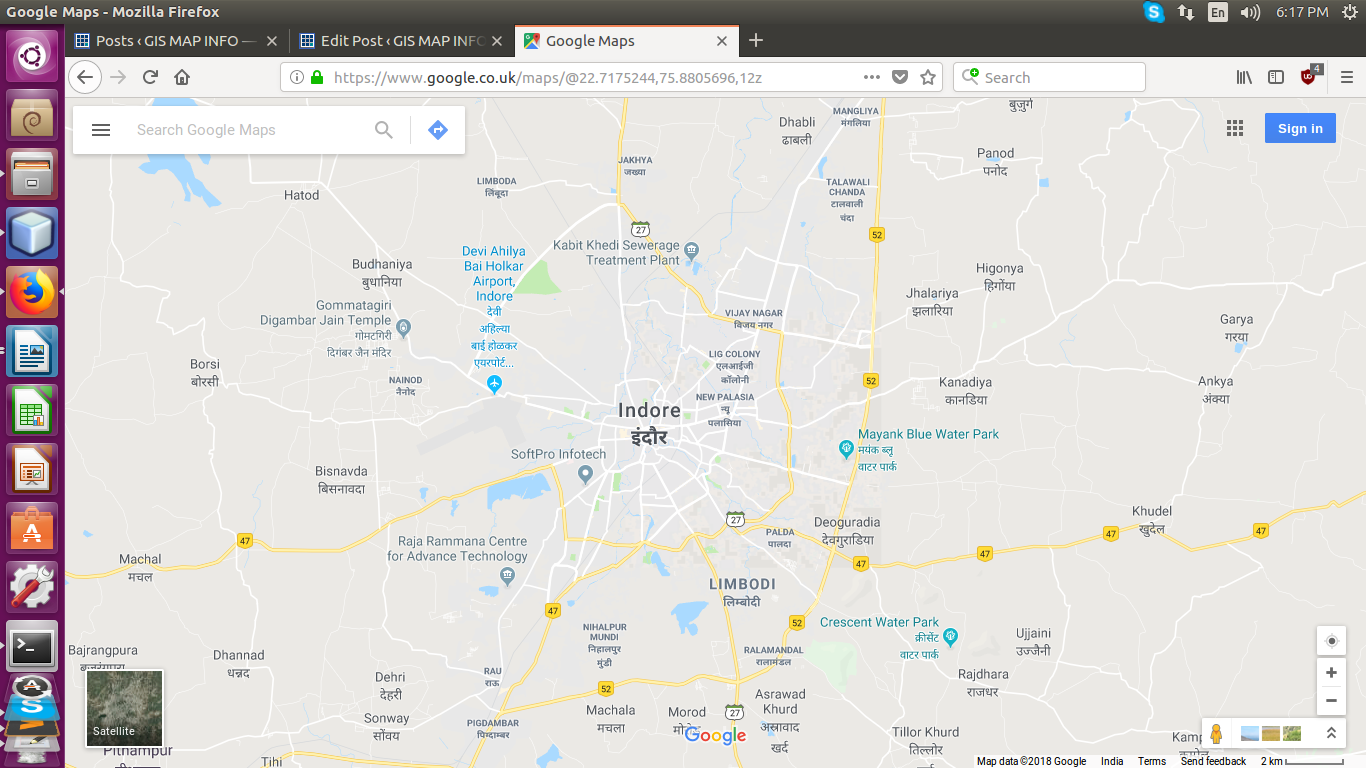
Step 1:
Navigate yourself to https://www.google.com/maps link.
Step 2:
Sign in with Google account.
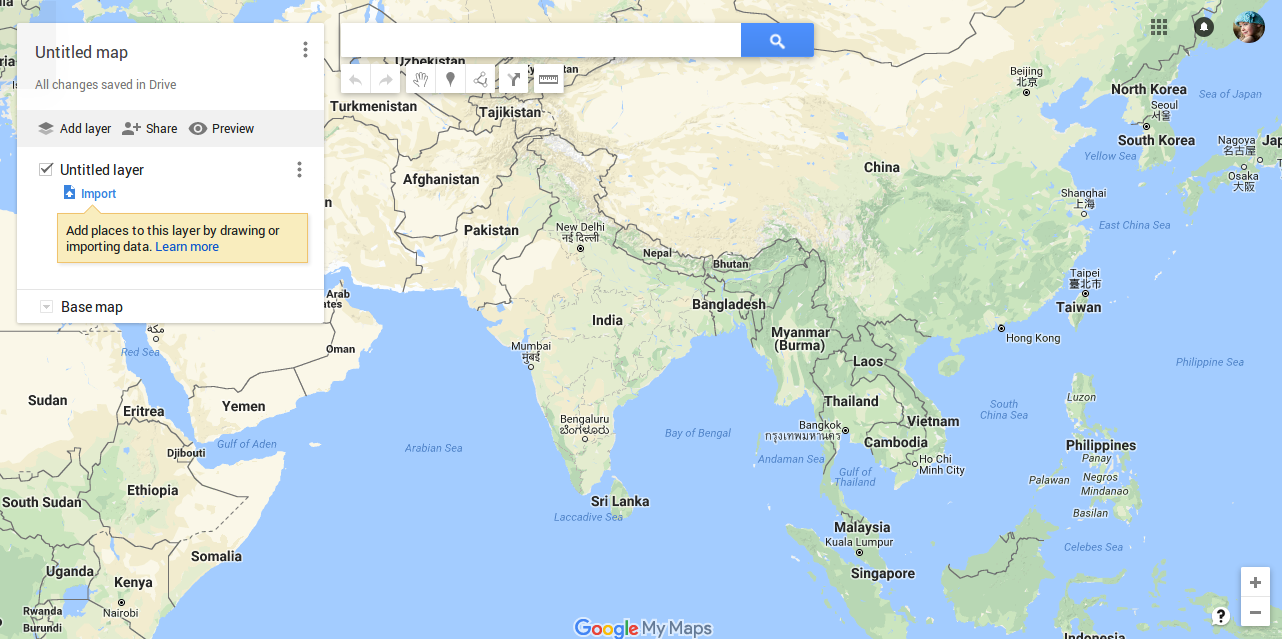
Step 3 to embed google map html:
click option menu and navigate to Your places-> maps-> create a map in bottom. A new window will open in new tab.
Embed HTML Google Map
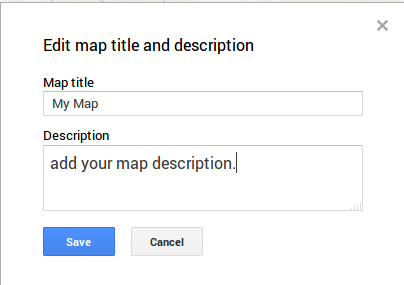
Step 4 to Embed HTML Google Map:
Now Click on Untitled Map, Write a title and description then hit to save.
Step 5:
You have two ways to add markers on map.
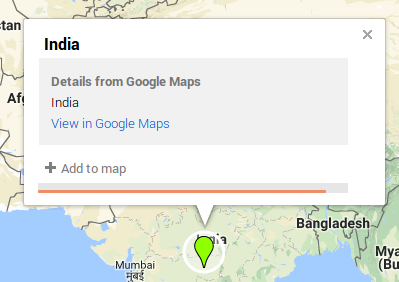
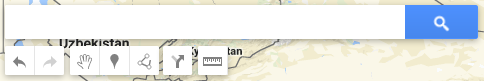
1. You can directly choose marker option and place them on map, wherever you need.
2. You can specify the location by providing location or address. After adding markers on map you must save the locations.
Step 6 to Embed HTML Google Map:
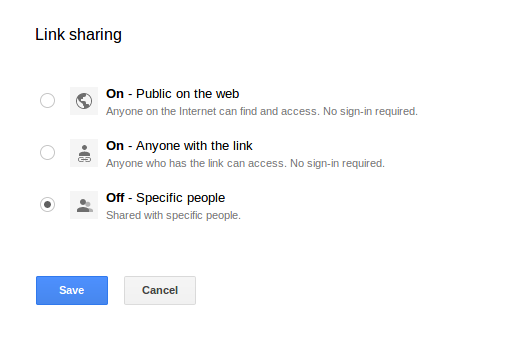
Now click to share option and set the privacy setting to “public on web” or you can choose people who can view and access the map. Then save the details and click to done.
Step 7:
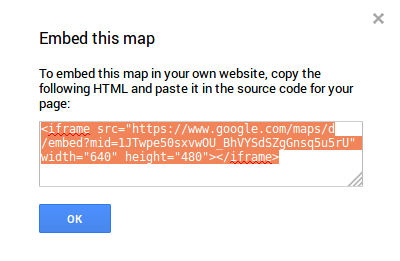
Then Click to option menu on title window and hit to embed on my site. This will provide you a link containing <iframe> tag. You can use this link any where you want.
Embed HTML Google Map
You can use this iframe link in your web site to show your business location on map. Hope you enjoyed this tutorial.
GoeServer is one of the best server for storing Vector data. Geoserver is open source software and free to use. To know how to publish vector data and style it on Geoserver you can follow this tutorial. Before this you need to install Geoserver on your system for that read out our previous tutorial, install first GeoServer on Windows or Ubuntu operating system. You can also look for publish and style raster dataset in GeoServer.
GeoServer supports various Vector DataSet:
Shapefile
Directory of spatial files
Java Properties
GeoPackage
GML
Here we will use Shapefile as vector dataset as an example to publish and style in map in geoserver.
A shapefile stores non-topological geometry and attribute information for the spatial features in a data set. The geometry for a feature is stored as a shape comprising a set of vector coordinates whereas attribute information can be seen in the attribute table.
GeoServer has been optimized for serving large shapefile (GB size) with good speed. We need to publish shapefile and then using WMS service we can use data with high speed. The OGC Web Map Service (WMS) specification defines an HTTP interface for requesting georeferenced map images from a server.
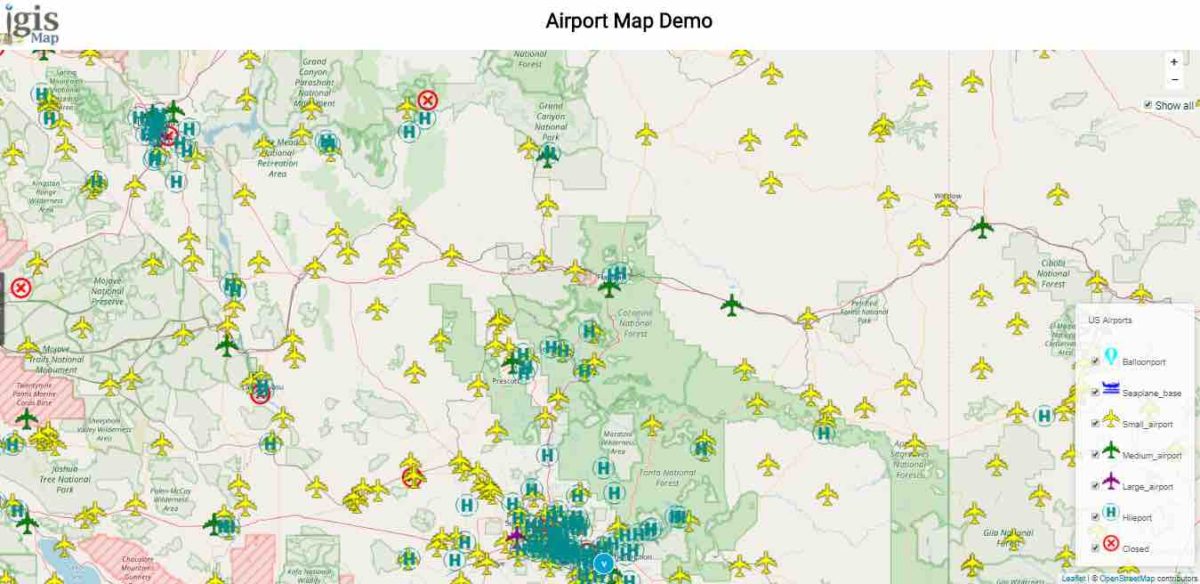
How a shapefile can be published on geoserver is described below. The published and styled data will look something like image showed as feauregiven in the post . This geometry for shapefile is point and icon based styling has used.
Publish Style Vector Dataset on GeoServer
Publish Vector Data on GeoServer – Host Shapefile SHP
We can publish many type of files on geoserver that can be in raster or vector format. In this tutorial we will see how we can publish shape file on GeoServer.
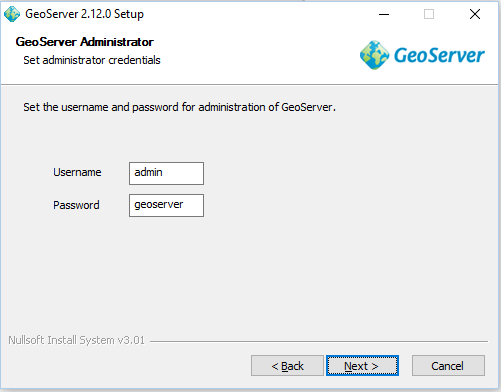
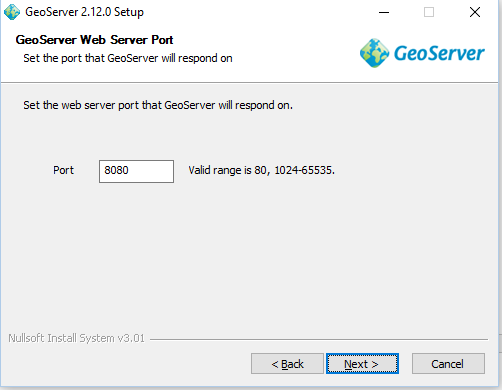
Start GeoServer application in your computer. It will run in command prompt then in web browser search localhost:8080/geoserver/web. Provide the Username and Password and click login to login as administrator of GeoServer.
Step 1 to publish vector data in geoserver:
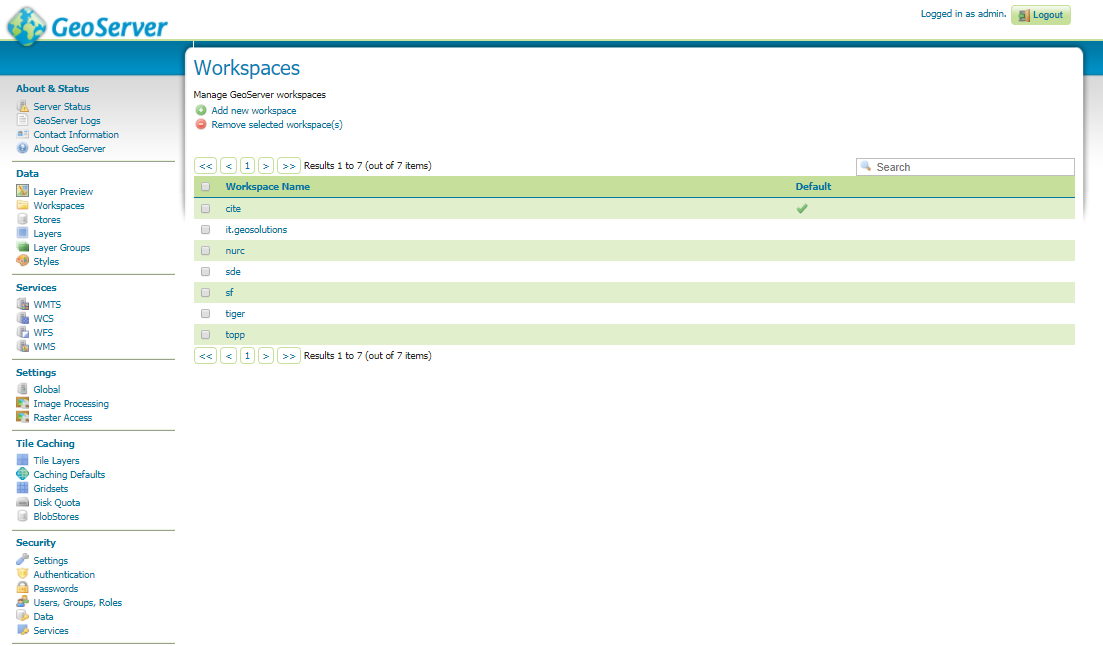
First of all you need to login to GeoServer then create a workspace, which can be done by selecting workspace option on the right side of screen under data section. Add the new workspace give a name and URI. In information technology, a Uniform Resource Identifier (URI) is a string of characters used to identify a resource, which can be same as name and submit the information.
Step 2:
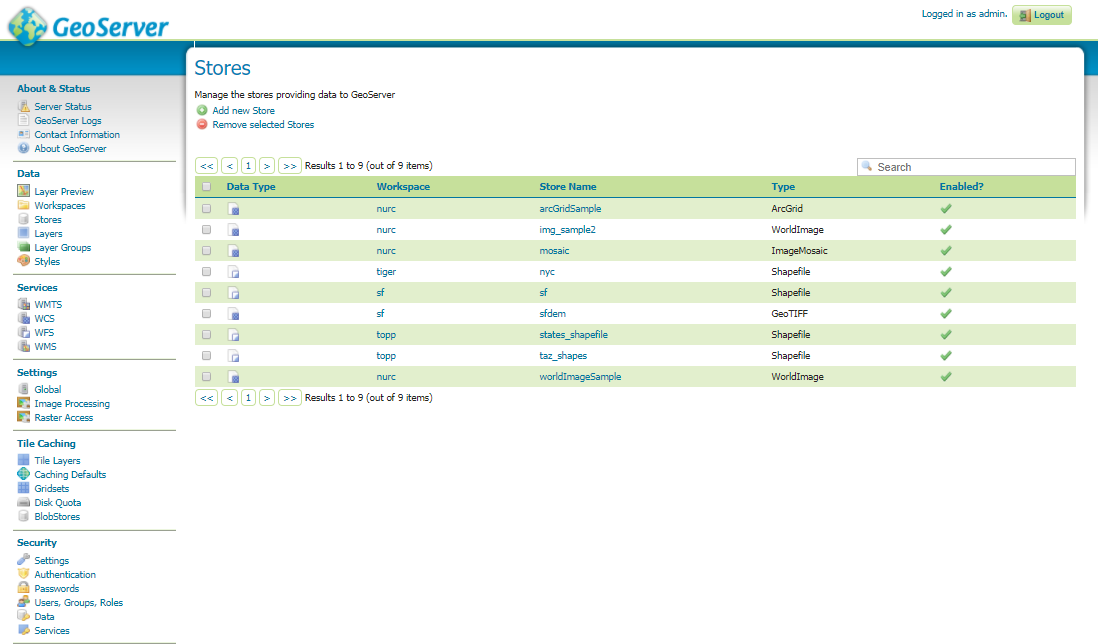
Now add the store by selecting stores option under same section. Click Add new store and select shapefile or directory of spatial files. Under directory of spatial file add your work space and data source name. Under connection parameters browse your file location then click save option. After saving you will be able to publish the layer. Click publish option.
Step 3 to publish vector data in geoserver:
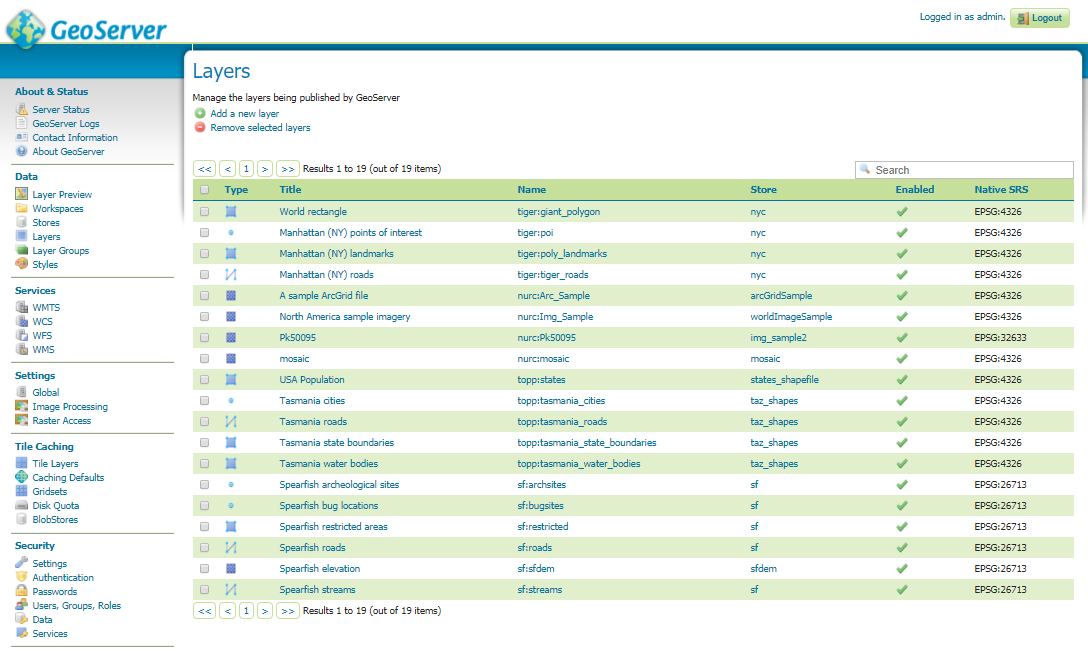
after selecting publish option check the name of shape file. Under Coordinate Reference Systems heading check the coordinate system of your shape file. Under bounding boxes select Computes from SRS (spatial reference system) bound and in the next part select compute from native bound. Then save the information. After saving you will be able to see the shapefile name with your workspace and store name.
Publish Style Vector Dataset on GeoServer
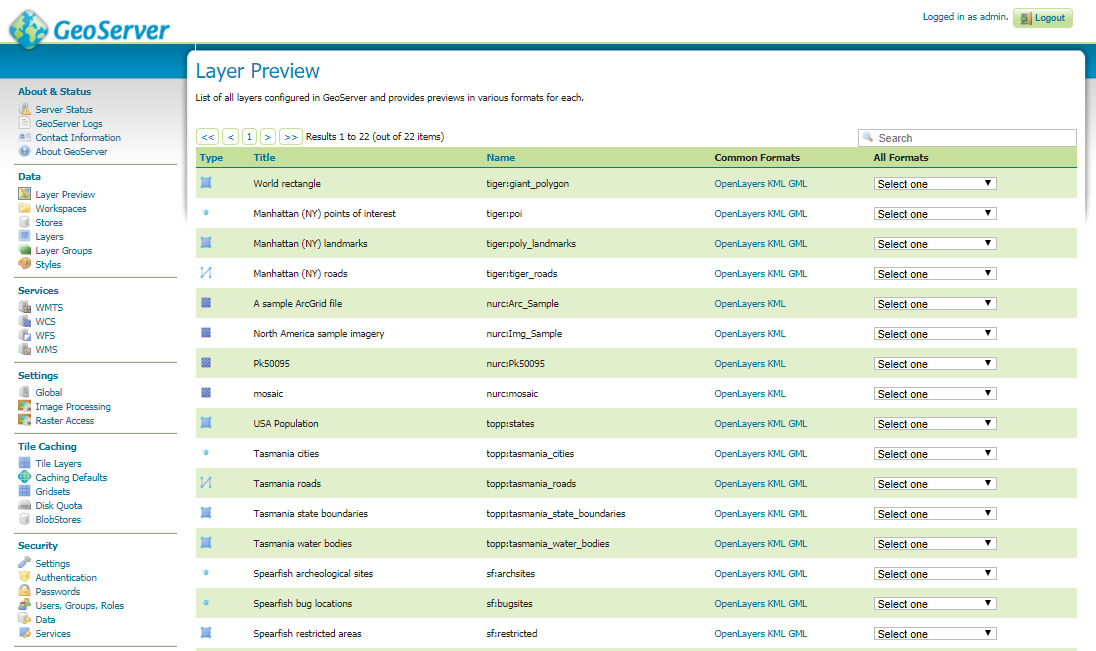
Step 4:
Now select the Layer Preview option under same section. And open your shape file using openLayer option in Command format column.
As the layer is visible now you have a link in URL bar. You can add this link in QGIS using add WMS/WMTS layer and see the shape file.
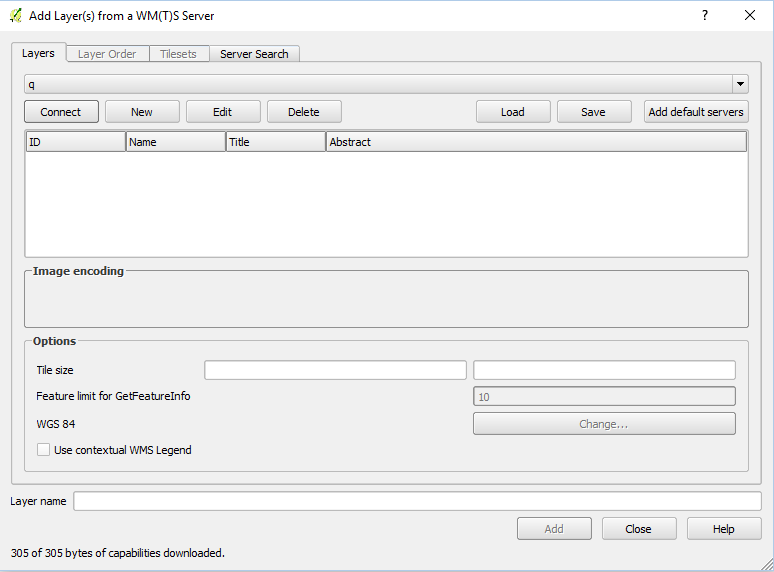
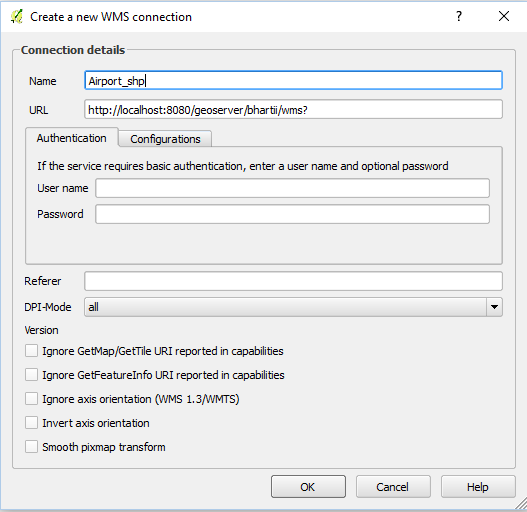
Open QGIS and click the add WMS/WMTS layer option and then click new button to add new WMS layer.
Publish Style Vector Dataset on GeoServer
Add the URL and click ok.
Then connect the layer and add to display.
Shape file can contain point, line or polygon, which can be styled on geoServer. To style any feature on geoserver we required to add style name. This style can be customised. Some styling is already given in style option under Data section.
To add built in style to your shapefile follow the given steps-
Step 1:
First of all make sure your file has been added on server. Then open that layer using layer option in data section.
Step 2:
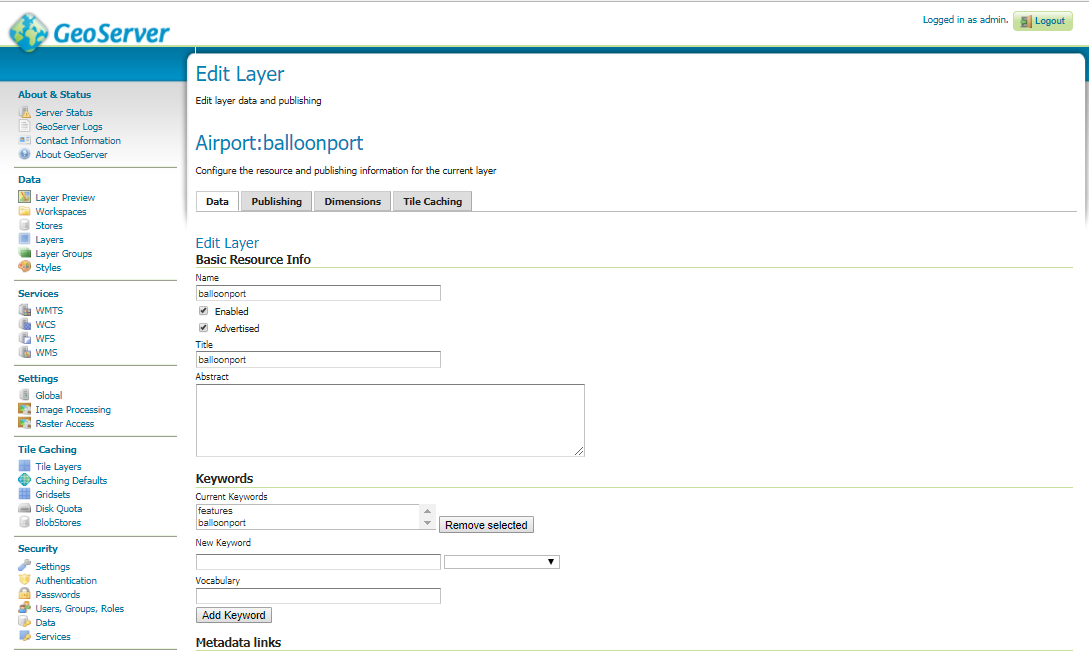
There will be 4 tabs as data, publishing, dimensions and tile caching. As on adding layer you already have visited data tab and set SRS coordinates. Now click publishing tab.
In publishing tab find the WMS setting option, under that option check the Queryable checkbox and select style in default style dropdown.
There are styles for point, line, polygon and raster.
1. Burg: point
2. Dem: raster
3. Capitals: points
4. Roads: line
5. Lakes: polygon
6. Raster: raster
7. Point: point
8. Line: line
9. Polygon: polygon
10. Rain: raster
11. Population: raster
According to your shape file you can add the style and click to save.
Step 3 of style vector dataset in geoserver:
Now to check the styling click the layer preview option under same data section. Open as openLayer.
For more details you can visit http://docs.geoserver.org/latest/en/user/data/webadmin/layers.html website.
Styling Based on Attributes: Sometimes we need to style according to attributes. For example population greater than 5000, population equal to 5000 and population less than 5000 so we need some coding to define all these.
The Styled Layer Descriptor (SLD) Profile of the Web Map Service (WMS) Encoding Standard defines an encoding that extends the WMS standard to allow user-defined symbolization and colouring of geographic feature (vector data) and coverage data (raster data).
SLD (Styled Layer Descriptor ) has some elements in geoserver for vector dataset as :
The root element for an SLD is <StyledLayerDescriptor>. It contains a Layers and Styles elements which describe how a map is to be composed and styled.
<NamedLayer>: A reference to a named layer in the server catalogue
<UserLayer>: A layer defined in the style itself
<FeatureTypeStyle>: The FeatureTypeStyle element specifies the styling that is applied to a single feature type of a layer. It contains a list of rules which determine the symbology to be applied to each feature of a layer.
Under Rule element we specified filter with binary comparison operators PropertyIsEqualTo. Where property name is the attribute column you want to perform operation on and literal is the attribute value.
<ogc:Filter>
<ogc:PropertyIsEqualTo>
<ogc:PropertyName>type</ogc:PropertyName>
<ogc:Literal>balloonport</ogc:Literal>
In this article we have used Airport shape file, containing attributes as name and type of airports as point feature. So here we have styled this data based on type of airport.
PointSymbolizer: which styles features as points
LineSymbolizer: which styles features as lines
PolygonSymbolizer: which styles features as polygons
TextSymbolizer: which styles text labels for features
RasterSymbolizer: which styles raster coverages
<PointSymbolizer> in geoserver for vector dataset:
contains an optional <Geometry> element, and a required <Graphic> element specifying the point symbology. So as we want to change the point with icons so graphic element is used. <ExternalGraphic> element specifies an external image file to use as the symbol. Then using onlineResource define the path of graphic and format. The xlink:href attribute specifies the location of the image file. The value can be either a URL or a local pathname relative to the SLD directory. The value can contain CQL expressions delimited by ${ }. The attribute xlink:type=”simple” is also required. The graphic size can be by using size element. Then close all the elements by using “/”.
To apply this code open the style option, add a new style and give name and workspace. After that select SLD ( Styled Layer Descriptor ) from format drop down and copy this code in editor. Validate apply and submit this.
After this open your shape file and repeat the steps described above. In the last open this layer as Openlayer from layer preview section.
Publish Style Raster Dataset On GeoServer. Do you have raster data and want to host the data on geoserver and create a proper map with styling according to dataset? Well GeoServer gives you a direct and simple method to create a styled map. Before implementing steps to publish and sytle raster dataset on geoserver you need to install first GeoServer on Windows, mac or Ubuntu Pc or Server. If you are looking for publish and style vector dataset on geoserver, you can check this link.
Raster Dataset GeoServer coverage:
Coverage/raster data that geoserver can access are,
1. GeoTIFF (Tagged Image File Format with Geographic information)
2. GTOPO30
3. WorldImage
4. ImageMosaic
5. GeoPackage
In this article we will discuss how we can publish GeoTIFF (.tiff/.tfw format) data on server. The data for this article has been downloaded from the links provided in this article. The raster data contains 3 bands (red, blue, green) information. Here we will use GeoTiff data to demonstrating raster dataset to publish and style in GeoServer.
To publish Raster Dataset data – Steps – Publish Style Raster Dataset
Here we will first publish the geotiff raster dataset in geoserver as an example:
Step 1:
First of all you need to login to GeoServer then create a workspace, which can be done by selecting workspace option on the right side of screen under data section. Add the new workspace give a name and URI. In information technology, a Uniform Resource Identifier (URI) is a string of characters used to identify a resource, which can be same as name and submit the information.
Step 2 of Publish Raster Dataset on GeoServer:
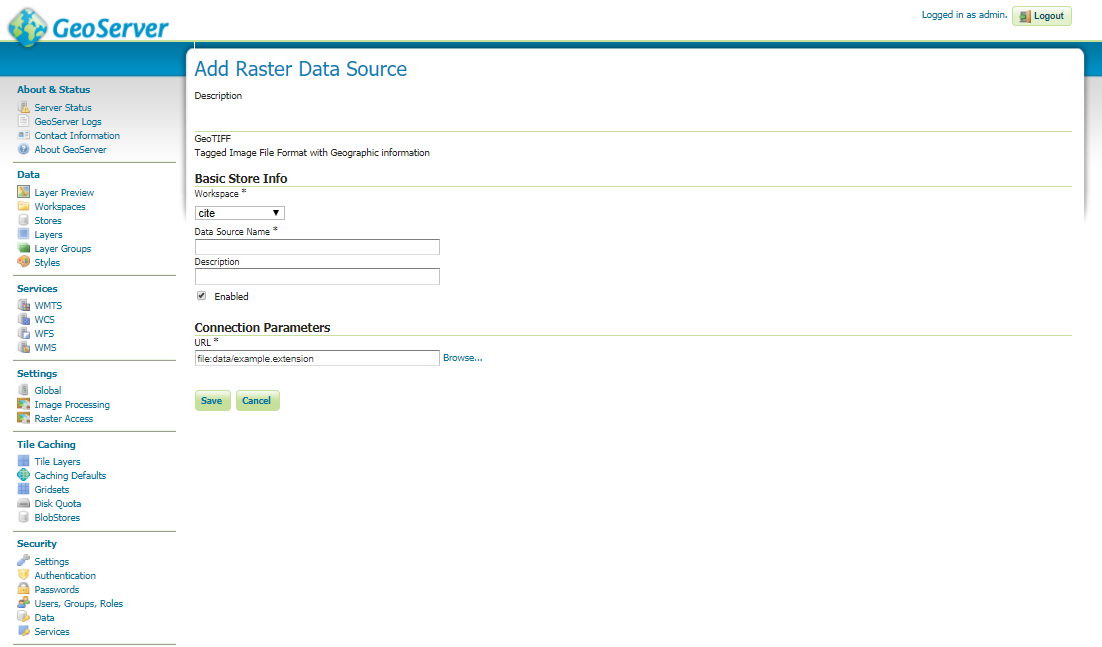
Now add the store by selecting stores option under same section. Click Add new store and select GeoTIFF option in Raster Data Sources list.
Publish and Style Raster Dataset On GeoServer
Under this option add the workspace, you created and give data source name. Provide the description about your data. Now browse the GeoTIFF file to add and publish this data.
Step 3:
Check the Coordinate Reference Systems and the Bounding Boxes fields are properly set and click on Save.
Step 4 of publish raster dataset on geoserver:
Now you can see the layer and get the WMS link. For this go to Layer Preview option in data section and open the published data as OpenLayer option.
To Style Raster Dataset on GeoServer Steps – Publish Style Raster Dataset
To add built in style to your GeoTIFF file follow the given steps.
Step 1:
First of all make sure your file has been added on server. Then open that layer using layer option in data section.
Step 2 to style raster dataset in geoserver:
There will be 4 tabs as data, publishing, dimensions and tile caching. As on adding layer you already have visited data tab and set SRS coordinates. Now click publishing tab.
Publish and Style Raster Dataset On GeoServer
In publishing tab find the WMS setting option, under that option check the Queryable check box and select style in default style drop down.
There are styles for point, line, polygon and raster in Geoserver:
1. Burg: point
2. Dem: raster
3. Capitals: points
4. Roads: line
5. Lakes: polygon
6. Raster: raster
7. Point: point
8. Line: line
9. Polygon: polygon
10. Rain: raster
11. Population: raster
According to your shape file you can add the style and click to save.
Step 3:
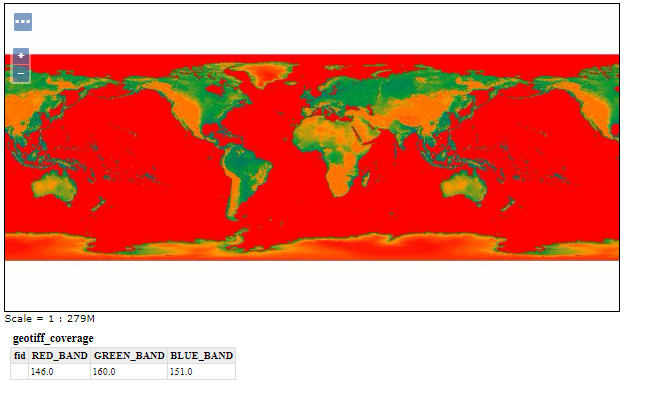
Now to check the styling, add Raster option as style and click the layer preview option under same data section. Open as openLayer.
You can add your own SLD (Styled Layer Descriptor) profile to style the GeoTiff data. For this you can follow this article and for more information you can visit http://docs.geoserver.org/latest/en/user/styling/sld/reference/rastersymbolizer.html link.
The Styled Layer Descriptor (SLD) supported in geoserver raster dataset:
Profile of the Web Map Service (WMS) Encoding Standard defines an encoding that extends the WMS standard to allow user-defined symbolisation and colouring of geographic feature (vector data) and coverage data (raster data).
SLD has some elements as:
<StyledLayerDescriptor> Which is the root element for an SLD. It contains a Layers and Styles elements which describe how a map is to be composed and styled. <NamedLayer>: A reference to a named layer in the server catalogue
<UserLayer>: A layer defined in the style itself
<FeatureTypeStyle>: The FeatureTypeStyle element specifies the styling that is applied to a single feature type of a layer. It contains a list of rules which determine the symbology to be applied to each feature of a layer.
<Rule>: Styling rules define the portrayal of features. A rule combines a filter with any number of symbolizers. Features for which the filter condition evaluates as true are rendered using the symbolizers in the rule.
<RasterSymbolizer>: styles raster coverages.
The <Opacity> element sets the transparency level for the entire rendered image. As is standard, the values range from zero (0) to one (1), with zero being transparent, and one being opaque.
The <ChannelSelection> element specifies how dataset bands are mapped to image colour channels. Named dataset bands may be mapped to red, green and blue channels, or a single named band may be mapped to a grayscale channel.
Here we can select any of the band or all three band. But particularly in this article we have selected a single band of an RGB image as a grayscale channel and re-colorizing it via a ColorMap.
A color map is defined by a sequence of <ColorMapEntry> elements. Each <ColorMapEntry> element specifies a color and a quantity attribute. The quantity refers to the value of a raster pixel. The color value is denoted in standard hexadecimal RGB format (#RRGGBB). <ColorMapEntry> elements can also have opacity and label attributes. As in the code quantity is given as 0, 150, 200 and 255. Then the pixels having other values get interpolated range of color.
In the last close all the elements and save the style.
After that open the layer option and select the geotiff file. Add the style in publishing tab and save the layer. To view this style over layer, open layer preview option and open this layer as Openlayer option.
Full length code Publish Style Raster Dataset On GeoServer
Hope this article to Publish Style Raster Dataset On GeoServer is helpful for you and you might be easily able to create a beautiful colour map with the help of geoserver. If you find any problem in following the steps to style and publish the raster layer of geoserver do comment below with the problem in the box provided below.
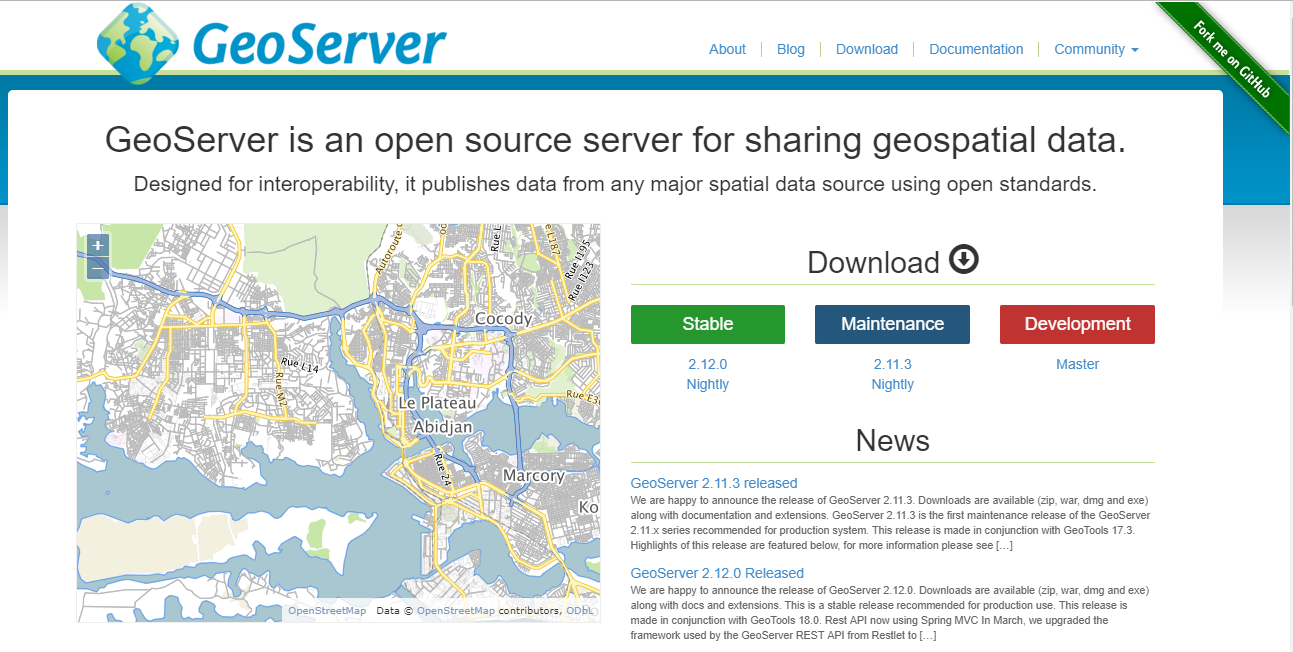
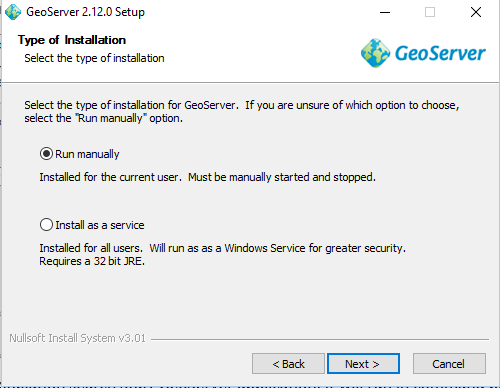
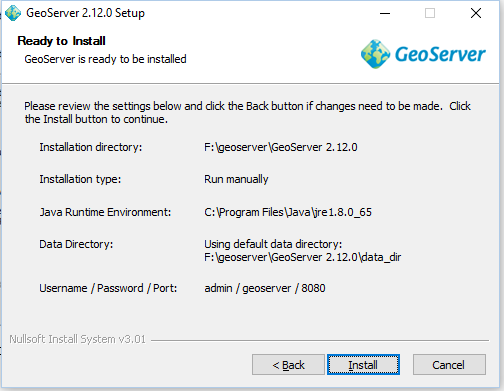
GeoServer is an open source server for sharing geospatial data in both vector and raster format. It is designed to host major data sources, which can easily render on maps.
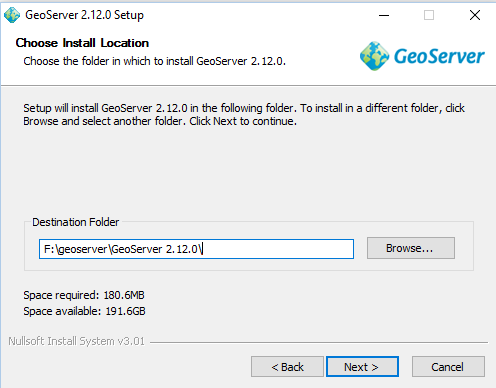
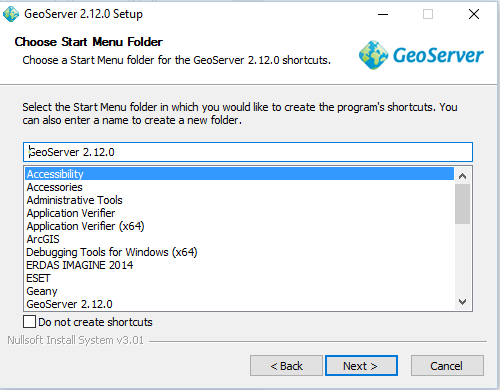
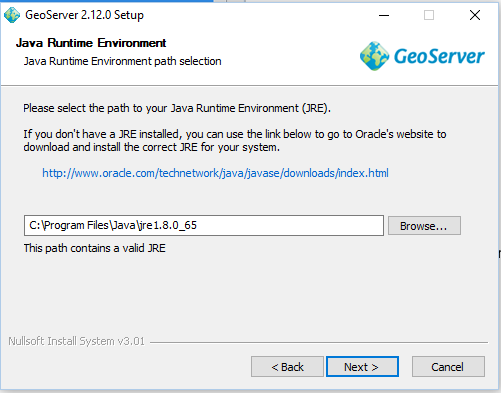
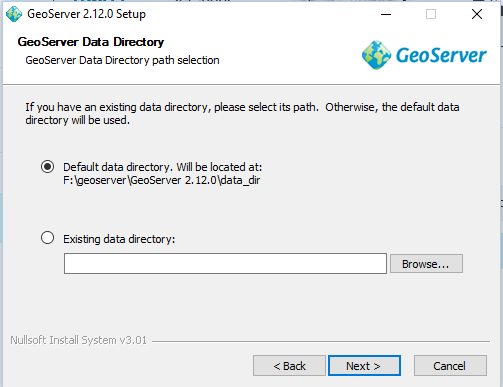
Hit the Download tab and install the stable version of geoserver. In this tutorial we have downloaded GeoServer 2.12.0. Before installation make sure that you already have JRE installed. If you have not installed that please visit
Shapefile shp can be converted in pgsql file using shp2pgsql command line tool. Sometimes you have a shapefile and want to upload the same in postgresql database, you can directly use shp2pgsql command and upload shapefile to postgis. While there might be possibilites that you would not be having access to your production server to install shp2pgsql command line tool, so you can convert shapefile into a sql file and then upload the same to Database. Lets check how to convert shp to sql file.
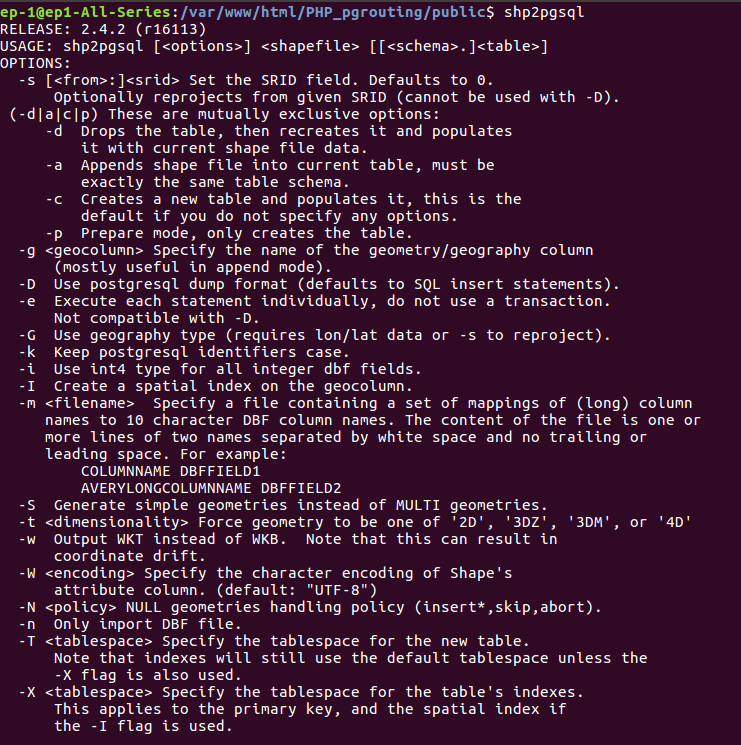
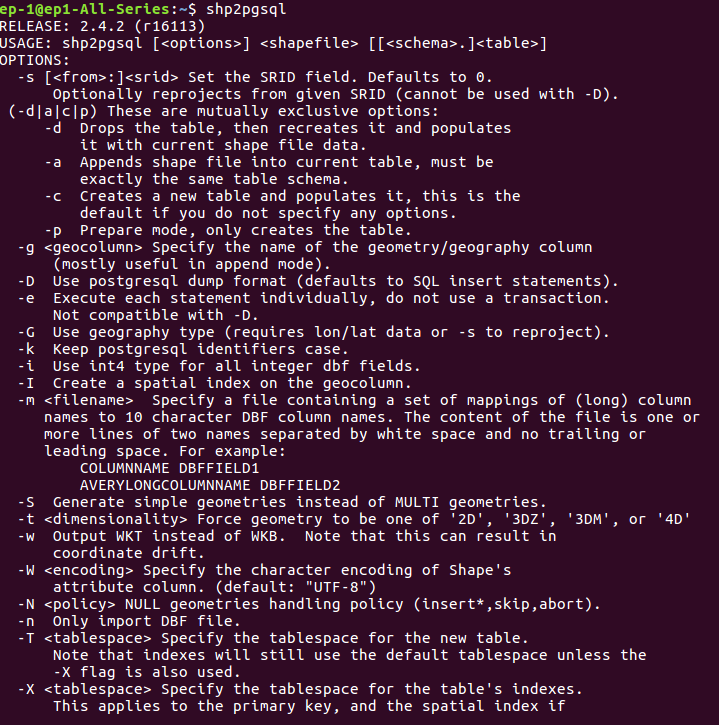
For executing this command you need to have shp2pgsql utility in your system. You can check the presence of utility by typing shp2pgsql in terminal. If this utility is present then you will see the following result.
Convert- Shapefile Shp to SQL postgersql file
Shp2pgsql has some option, some for them are used here. Option -I creates a spatial index on the geocolumn. Option -s specifies the SRS (Spatial Reference system) in EPSG (European Petroleum Survey Group) number.
After executing this command, you can run the sql file in postgres to insert data in table.
Code – Convert- Shapefile Shp to SQL postgersql filE
If you know to read binary files by knowing its format, you can easily read and convert shapefile to sql, as shapefile has an open standard file format. For instance, you can look over tutorial I had created in how to read shapefile bounding box using c++ or reading shapefile header.
In codeigniter framework of php, we can use shell_exec() by providing command as input. In command we need to export PGPASSWORD, where password is supplied.
While writing command in PHP, we need to take SRS (Spatial Reference system) of shape file, input shapefile and output file name from the user. The passwrThen query is written in string format and supplied to shell_exec() method. This method returns output as string and generates file in folder.
PGPASSWORD behaves the same as the password connection parameter. Use of this environment variable is not recommended for security reasons, as some operating systems allow non-root users to see process environment variables via ps; instead consider using the ~/.pgpass file. For more detail you can visit https://www.postgresql.org/docs/9.1/static/libpq-envars.html link.
public function shptosql($shpfilepath,$output){
$srs=4326;
$query=”export PGPASSWORD=’download1′; shp2pgsql -I -s $srs $shpfilepath $output > $output.sql”;
shell_exec($query);
}
You can check for SQL file in the same folder where shapefile is kept. The generated result will look like-
Convert- Shapefile Shp to SQL postgersql file
Change coordinate system – shp to sql
While converting shapefile into sql, you can not change the coordinate system. But you can execute this process in two steps as-
Hope you enjoyed the conversion and executed it successfully. Let us know you face any difficulty during execution of this tutorial via commenting in provided box.
Many people uses MapServer as their Server, so they might need to store shape file as MIF (Map Info File) file on server. The OGR Simple Features Library allows MapServer users to display several types of vector data files in their native formats. For example, MapInfo Mid/Mif and TAB data can be seen on MapServer when using OGR support with it. So lets see how to convert Shapefile shp to mif or map info file.
Lets look what is MIF ( MapInfo Interchange Format) Before converting shp to Mif
MIF (Map Info File) File format used by MapInfo mapping and geographic analysis software. This stores a map visualization in a format that can be recognized by third party applications. Also used as an exchange format between GIS applications. This sometimes accompanied by a .MID (MapInfo data) file that contains additional spatial data. MID files are GIS data files created by MapInfo, a spatial data analysis and visualization software, saves spatial data for a corresponding .MIF (MapInfo Interchange Format) file. Also used for storing larger data sets not expressed in the MIF file. What is Shapefile – collection of geometry with other supported files as shx, dbf, prj ect.
MIF file show some general property when open with QGIS software, as like :
i.) Storage type of this layer
–> MapInfo File
ii.) Description of this provider
–> OGR data provider (compiled against GDAL/OGR library version 2.2.2, running against GDAL/OGR library version 2.2.2)
iii.) Source for this layer
–> /var/www/html/PHP_pgrouting/public/shpfolder222/newwhello.mif
iv.) Geometry type of the features in this layer
–> Line
v.) The number of features in this layer
–> 19148
vi.) Capabilities of this layer
–> Fast Access to Features at ID, Presimplify Geometries, Presimplify Geometries with Validity Check
vii.) In layer spatial reference system units
–> xMin,yMin 68.4982,7.92528 : xMax,yMax 97.3348,35.5013
viii.) Layer Spatial Reference System
–> +proj=longlat +datum=WGS84 +no_defs
Convert Shapefile SHP TO MIF format using ogr2ogr utility-
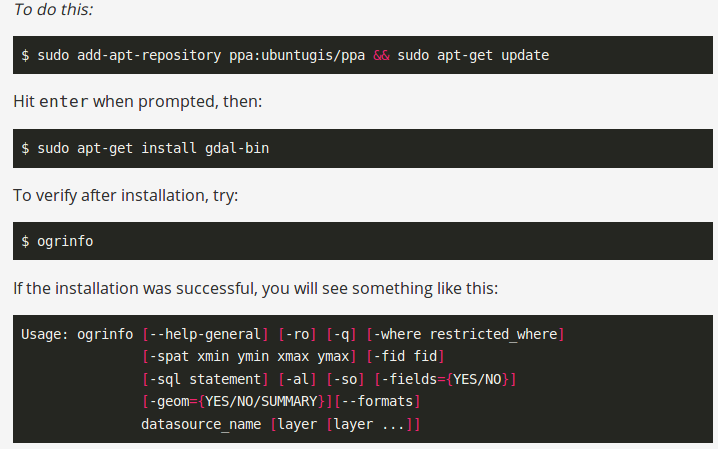
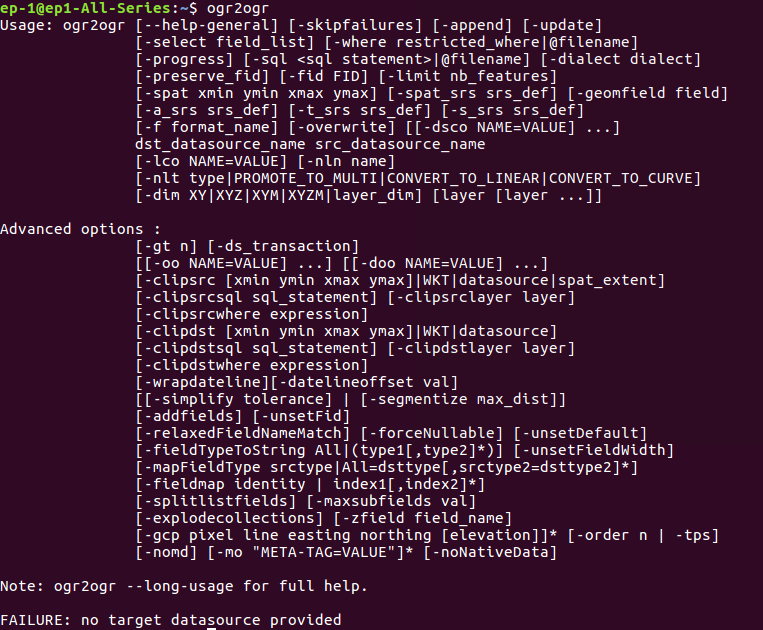
ogr2ogr supports some file format MIF is one of them. You can write a simple command to convert your shapefile. Before this you must check for ogr2ogr utility. That can be done by typing ogr2pgr in your terminal.
Convert- Shapefile Shp to MIF – Map Info File
If this utitlity is not available, you should run the given commands-
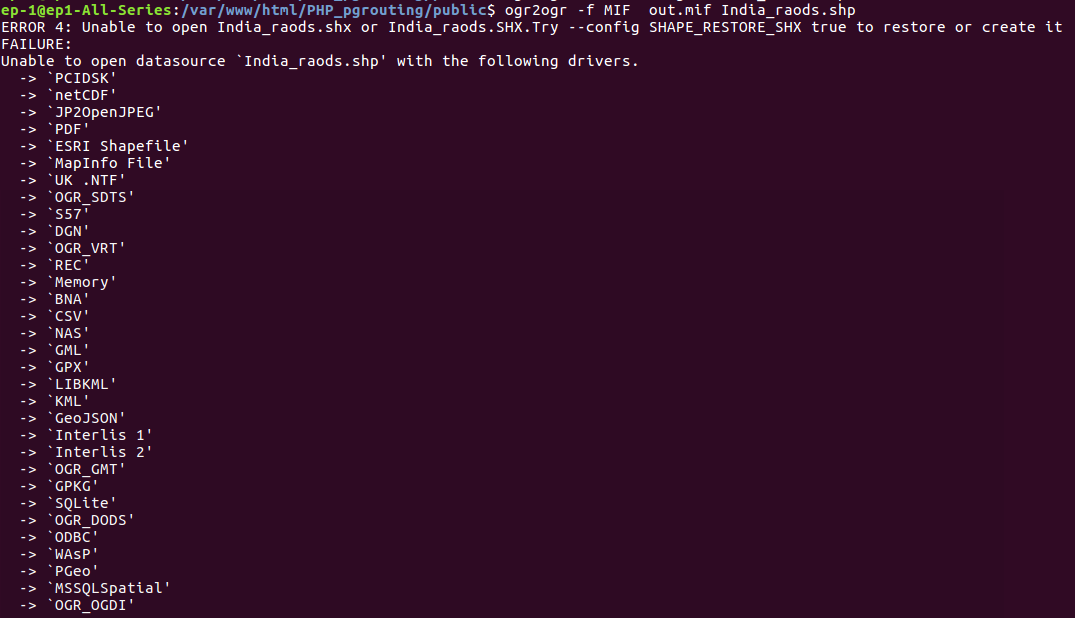
You must have shp along with .shx and .dbf file for proper conversion.
If you only have shp file you will got an error something like.
Convert- Shapefile Shp to MIF – Map Info File
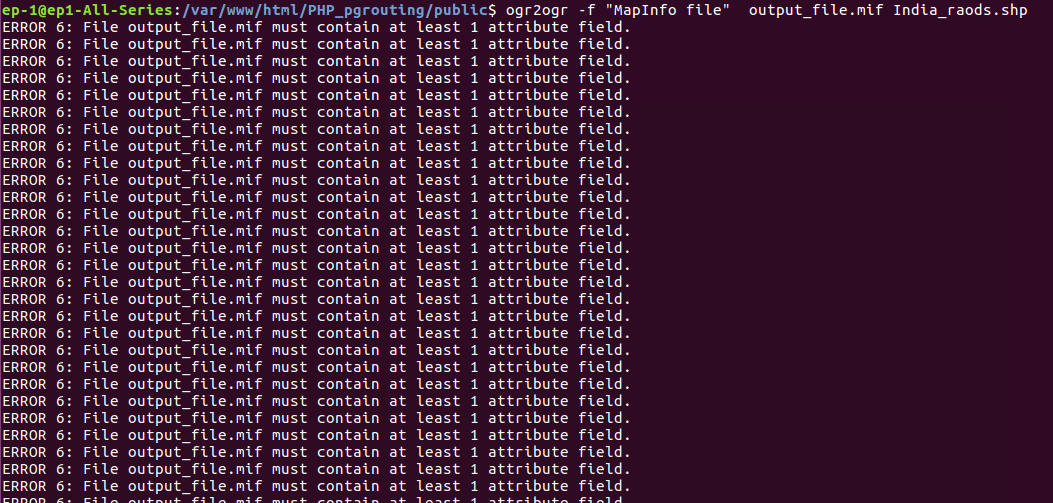
And if you don’t have .dbf file, then you following error will appear
Code to Convert Shp to MIF
If you are aware of reading binary file by knowing the file format, you can easily read and parse shapefile and convert the same to any other format. You can check out one such tutorial which I had created to read header of shapefile using c++ or bounding box of shapefile using c++.
This same work can be done in PHP using shelll_exec() method, which execute the command and gives output as string. The following function describes the $query variable, which takes command as string and given to shell_exec(0 method.
public function shptomif($shpfilepath,$output) {
$query=”ogr2ogr -f ‘MapInfo file’ $output.mif $shpfilepath.shp”;
shell_exec($query);
}
Output of mif file from shp file-
The Output will contain .mif and .mid files. You can open MIF file in QGIS software.
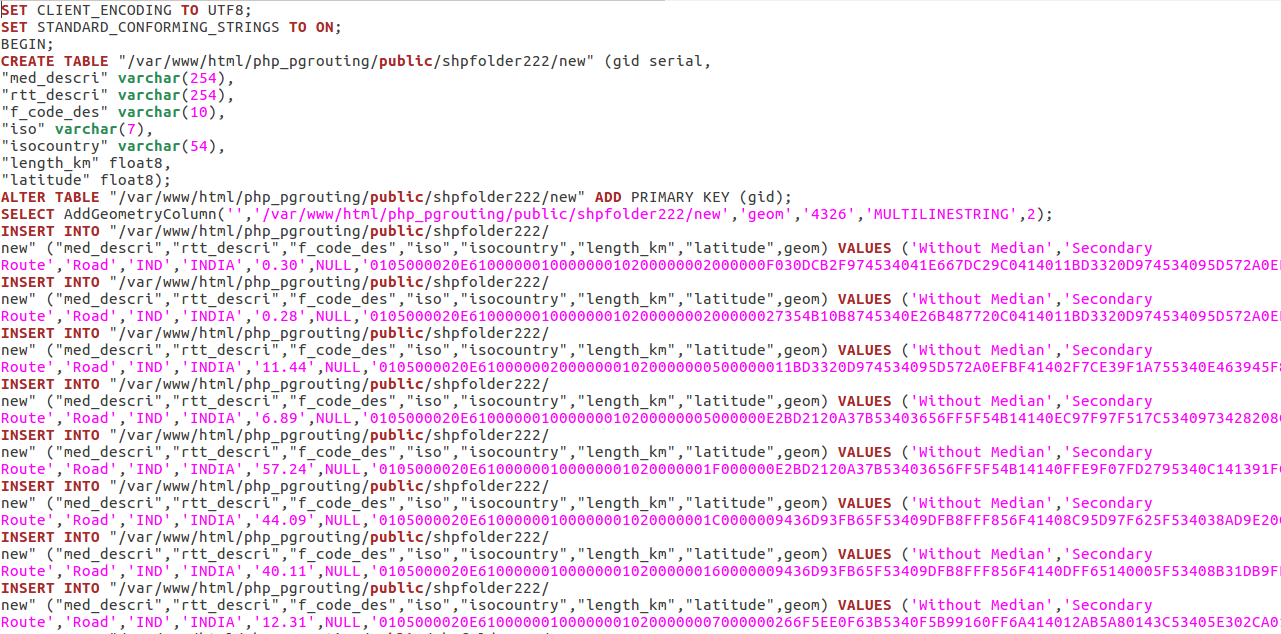
If you are using Windows operating software than you can open .mif (Map Info File) with microsoft word. The following result will appear
Version 300
Charset “Neutral”
Delimiter “,”
CoordSys Earth Projection 1, 104
Columns 7
MED_DESCRI Char(254)
RTT_DESCRI Char(254)
F_CODE_DES Char(10)
ISO Char(7)
ISOCOUNTRY Char(54)
Length_km Decimal(11,2)
Latitude Decimal(11,2)
Data line(…..)
Change Coordinate System of MIF from shp format
Converting shapefile into MapInfo File with desired coordinate system can be done by using ogr2ogr utility. It has some options related to SRS (Spatial reference system), given below-
Sometimes we just need to see attribute details not geometry. So instead of carrying heavy shape files we can convert them in XLSX format. XLSX file contains on attribute detail or can say non spatial data. XLSX files are light in weight. Along with shp to xlsx convert you may also check for shp to ods, shp to csv conversion which also more focuses on attribute details.
KNOW ABOUT XLSX AND SHAPEFILE format -BEFORE CONVERTING SHP TO XLSX
An XLSX file is an Excel spreadsheet created by Microsoft Excel or another spreadsheet program. It stores data in worksheets, which contain cells arranged in a grid of rows and columns, and may also contain charts, mathematical functions, styles, and formatting. XLSX files create simple or complex mathematical models.
What is shapefile? Each object within a SHP file contains an individual geographic feature and its attributes.
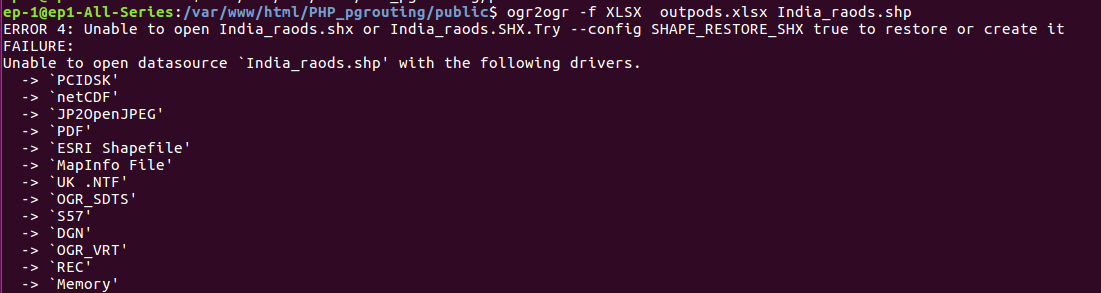
Conversion from shapefile to XLSX using ogr2ogr utility-
In command -f is file format and XLSX is driver. Then you can specify the output file name with .xlsx extension and input shapefile. This command can be executed on terminal or using PHP code. Here you must look for the ogr2ogr utility in your system. If not available you can install it using given line of code.
Then you can check the presence of utility by typing ogr2ogr in terminal. The output will look like-
SHP to XLSX
Note that while converting shapefile to XLSX, you must check for .shx file. If shx file is not available you may get following error.
Shapefile has some supporting file like .dbf, .shx, .prj etc. So you must take all file whenever you perform conversion.
PHP CODE – SHP to XLSX
If you are aware of Shapefile Open description format, then you can easily access shapefile data through coding. As i have created one such shapefile minimum bounding box parser in c++. Below in the php code to execute ogr2ogr tool.
Here you can perform the conversion using shell_exec() method, which actually executes the command and returns string as output.
public function shptoxlsx($shpfilepath,$output) {
$query=”ogr2ogr -f XLSX $output.xlsx $shpfilepath.shp”;
shell_exec($query);
}
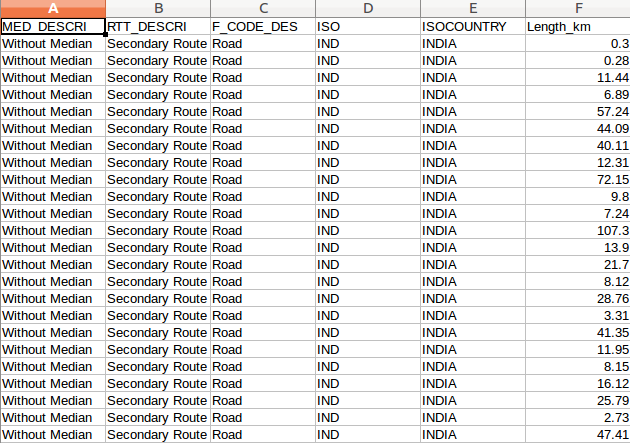
After execution of command you can check the specified folder to see generated xlsx file. The content of file will be something like-
Hope you enjoyed the article and successfully converted shape file into XLSX file. If you have any problem regarding conversion please feel free to write in comment box.
Shape file to ODS (Open Document Spreadsheet) conversion is required when you only need non spatial information i.e. only attribute information. This conversion need ogr2ogr utility. Or you may also you any other tool to convert shp to ods easily.
What is ODS (Open Document Spreadsheet) and Shapefile-Shp to ODS CONVERT
An ODS (Open Document Spreadsheet) file is a spreadsheet. It stores data in cells that are organized into rows and columns. ODS files are formatted using the OASIS Open Document XML-based standard. Whereas shape files are collection of geometry with non spatial data as attributes.
To install ogr2ogr utility you can follow the given lines of command.
Then check for presence of ogr2ogr utility by typing ogr2ogr in your terminal.
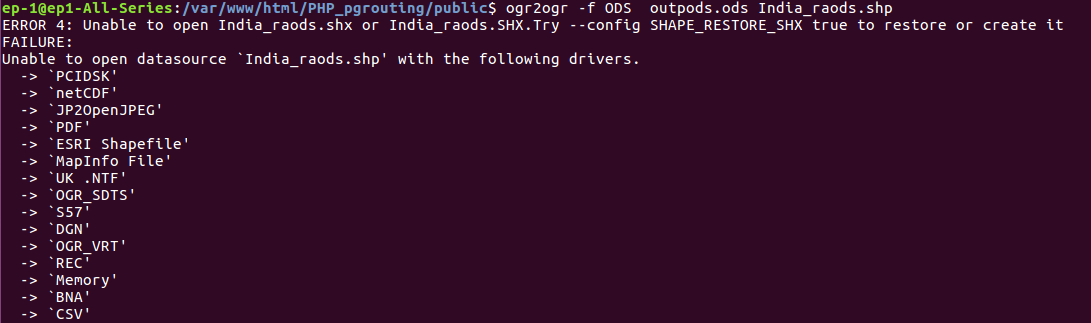
Conversion- Shapefile shp to ODS (Open Document Spreadsheet) using Ogr2ogr utility-
Here, in the command -f is the option for file format.
Note that while converting shx file should be present in same folder where shp file is kept. Otherwise you will get error like-
All the supported file (.shx, .prj and .dbf etc.) should be kept together while performing any conversion.
Code- Convert shp to ods
You can use any programming language to convert between shapefile to ods, if you know the format of shapefile and ods file. I have created one such minimum example of code to find the minimum bounding box of shapefile with c++ programming lanauage. Below is the php code.
public function shptoods($shpfilepath,$output) {
$query=”ogr2ogr -f ODS $output.ods $shpfilepath.shp”;
shell_exec($query);
}
The generated output can be seen in the same folder, where shapefile is kept. Output will look as-
Hope this post is helpful for you to convert shp to ods document. If you find any difficulty in implementing the conversion of shapefile to open document spreadsheet, let you know by commenting below in the box provided.
Shape file shp to GML conversion is required when you carry data from one place to another. Shapefiles are heavy as compared with GML (Geography Markup Language). On the other hand we can say that GML makes you able to do many of the same things that you would do with heavyweight desktop GIS files.
For a more in-depth guide on this topic, be sure to check out our accompanying video tutorial, where we walk you through each step visually and provide practical demonstrations.
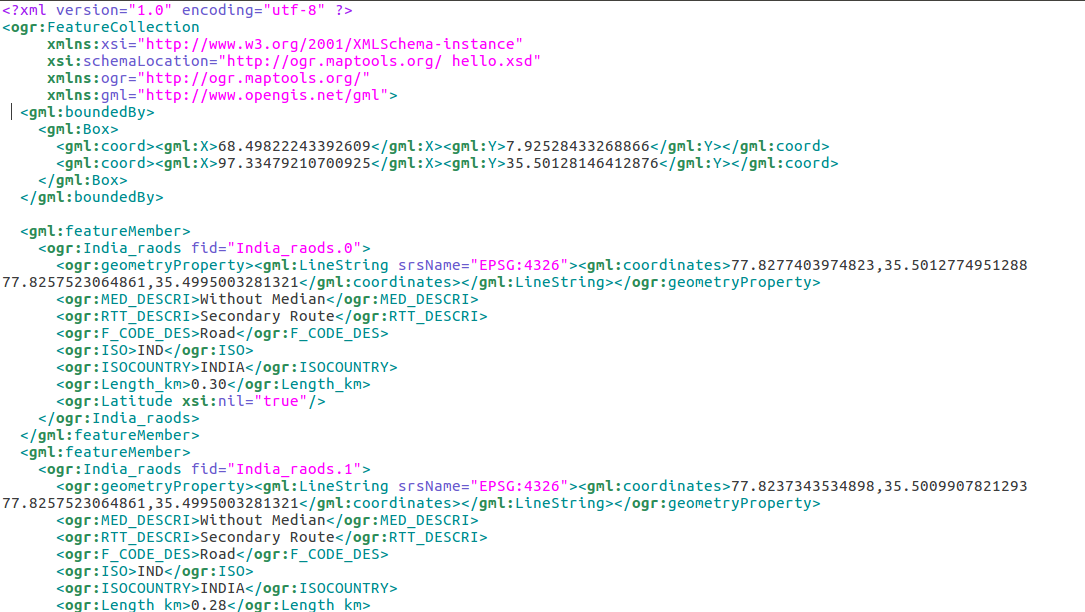
GML (Geography Markup Language) is about describing kinds of geographic objects. This is XML based language that contain two part- the schema that describes the document and the instance document that contains the actual data. GML schema allows users and developers to describe generic geographic data sets that contain points, lines and polygons. Using this schema user can differentiate between geometry primitives.
GMl format composed of geometry property and attribute detail in feature member tag. Here geometry defines which primitive is available in data. Whether it is point, line or polygon. These can be multilinestring or multipolygon. The given line of GMl defines the lineString, contains attributes as MED_DESCRI, RTT_DESCRI, F_CODE_DES, ISO and ISO_country in ogr tag. The srsName(Spatial reference system name) is given is file for each geometry as EPSG number.
LineString as Example of GML file Describing feature – Know Before performing shp to gml convert
Convert shapefile Shp to GML (Geography Markup Language) using Ogr2Ogr –
For converting shapefile in GML format you need to have ogr2ogr utility in your system. If this is not available you can follow the given procedure.
Convert Shapefile shp to GML – Geography Markup Language
After installing, you can check the availability of ogr2ogr in terminal by typing ogr2ogr, then you will be able to see the following result.
Command Line conversion – shp to gml-
Now, to convert Shapefile to GML you need to execute the following command-
In this command -f is the output file format i.e. GML then specify the output file name with .gml extension and after that input shapefile name with .shp extension. Note- while executing this command you must check for .shx file, which contains the positional index for geometry objects.
Code- Convert shp to GML
If you want the conversion using programing or don’t want to use terminal then this can also be done using PHP. You can create a function that defined this command as string and can give this string in shell_exec() method to execute. Shell_exec() actually execute the command and returns output as string.
public function shptogml($shpfilepath,$output){ $query=”ogr2ogr -f GML $output.gml $shpfilepath”; print_r($query); shell_exec($query); }
The GML output file will be something like this-
Change coordinate system of GML file from shp-
Many of times, we need the output file in other coordinate system. For this we can use options of ogr2ogr utility. It has
-t_srs srs_def:
Reproject/transform to this SRS on output
-s_srs srs_def:
Override source SRS
So using these option, we can get the data in required coordinate system. So for this you can write the query as-
Shapefile shp can be converted into GPS ( Global Positioning System) using ogr2ogr utility. The GPS data is best option when routes and tracks are required in XML format. Here we will check how to convert shapefile shp to GPX / GPS.
Convert Shp to GPX – Using IGIS Map Tool
Go to MapOG Conversion Tool . Login with registered id and password or if you are new then register with valid email id. Then tap on Switch To button select conversion in the drop down list.
Upload your file from system or drive or from drop box. After uploading the file choose the output format. And in the last click on Convert File button. You will be directed to the map where converted file is published.
Download the converted SHP to GPX file from the download icon. For detailed conversion watch the video provided below.
Details for GPX/GPS (GPS Exchange Format) and Shapefile Format Before Converting Shapefile to GPX GPS data-
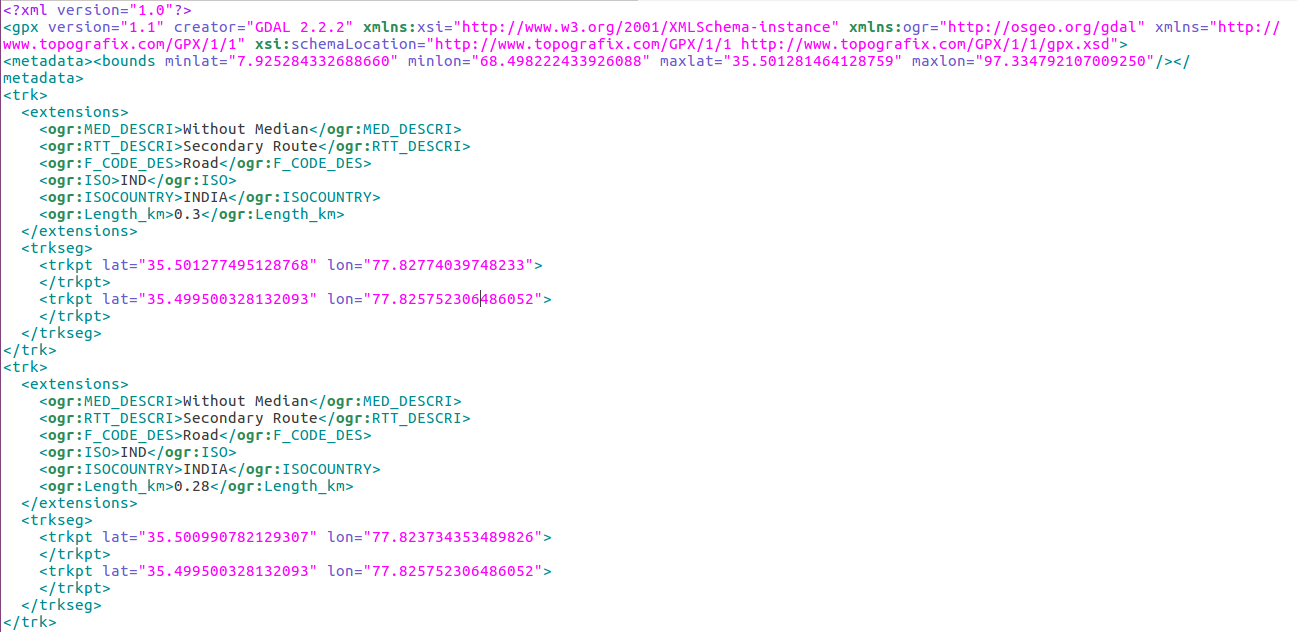
GPX (GPS Exchange Format) is a light-weight XML data format for the interchange of GPS data (waypoints, routes, and tracks) between applications and Web services on the Internet. Shapefile is collection of geometry with attributes mainly comprised of three files .shp for which stores geometry, .shx which stores index and .dbf which stores data of respective attributes.
The example is given below for linestring feature of gpx version. Here metadata contains the bounding box with min (lat,long) and max (lat, long). The tag trk defines the tracks, which contains extension tag, trkseg tag and trkpt tag. Here extension tag contains all the attributes in ogr tag with values. Trkseg tag is the track segment, which is composed of track points with latitude longitude.
Convert- Shapefile shp to GPX / GPS- Global Positioning System
Convert shp to GPX /GPS using ogr2ogr utility-
Ogr2ogr utility has some options some of them are give below,
-dsco NAME=VALUE:
Dataset creation option (format specific)
-nlt type:
Define the geometry type for the created layer. One of NONE, GEOMETRY, POINT, LINESTRING, POLYGON, GEOMETRYCOLLECTION, MULTIPOINT, MULTIPOLYGON or MULTILINESTRING.
-f option:
format_name
GPX_USE_EXTENSIONS:
By default, the GPX driver will discard attribute fields that do not match the GPX XML definition (name, cmt, etc.).
If GPX_USE_EXTENSIONS=YES is specified, extra fields will be written inside the <extensions> tag.
If you don’t have ogr2ogr utility in your system please execute the given commands to install ogr2ogr,
Check the presence of utility by typing ogr2ogr in command prompt-
Code to Convert GPX GPS from Shp
The conversion thing can be done in PHP using shell_exec() method, given below-
public function shptogpx ($shpfilepath,$output,$type) {
$query=”ogr2ogr -f GPX -dsco GPX_USE_EXTENSIONS=YES $output.gps $shpfilepath.shp -nlt $type”;
shell_exec($query);
}
Change coordinate system of GPS/GPX file-
Changing coordinate system using ogr2ogr is a one of the simple task. It has various option, here two are given, which will help to convert the coordinate system into desired one.
-t_srs srs_def:
Reproject/transform to this SRS on output
-s_srs srs_def:
Override source SRS
So using these option, we can get the data in required coordinate system. So for this you can write the query as-
If you find any problem during implementing this tutorial, please let us know. Feel free to comment in given comment box.
Loading Comments...
We use cookies to ensure that we give you the best experience on our website. If you continue to use this site we will assume that you are happy with it.Ok
 Geographic Information System is a system intends to capture, Store, manage, manipulate, analyze the data.