Geographic Information System is a system intends to capture, Store, manage, manipulate, analyze the data.
 Exciting news for GIS enthusiasts! MAPOG now extends its coverage to the Canary Islands in our comprehensive GIS dataset, offering intricate geographical and administrative information. From water features to road networks, and airports, our user-friendly formats like Shapefile, KML, and GeoJSON make data access effortless. Join us in enriching your mapping endeavors with the latest GIS data for the Canary Islands!
With MAPOG’s versatile toolkit, you can effortlessly upload vector, add WMS (Web Map Service) layers, upload Excel or CSV data, incorporate existing files, perform polygon splitting and merging, generate new polygon and polyline data, use the converter for various formats, conduct buffer analysis, create grids, transform points into polygons, calculate isochrones, and utilize the geocoder for precise location information.
Our array of data formats is diverse, including KML, SHP, CSV, GeoJSON, Tab, SQL, Tiff, GML, KMZ, GPKZ, SQLITE, Dxf, MIF, TOPOJSON, XLSX, GPX, ODS, MID, and GPS. This ensures compatibility and accessibility for a variety of applications and analyses.
Note:
- All data available are in GCS datum EPSG:4326 WGS84 CRS (Coordinate Reference System).
- You need to login for downloading the shapefile.
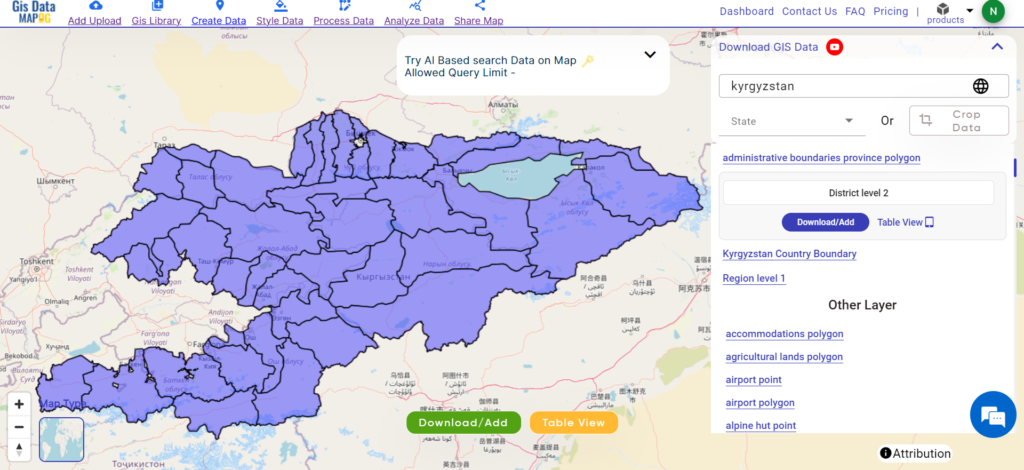
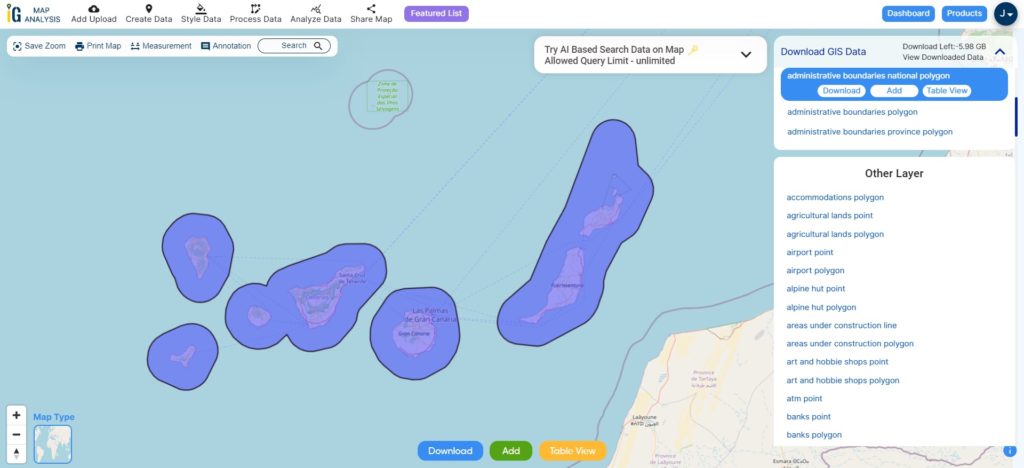
Download Shapefile Data of Canary Islands
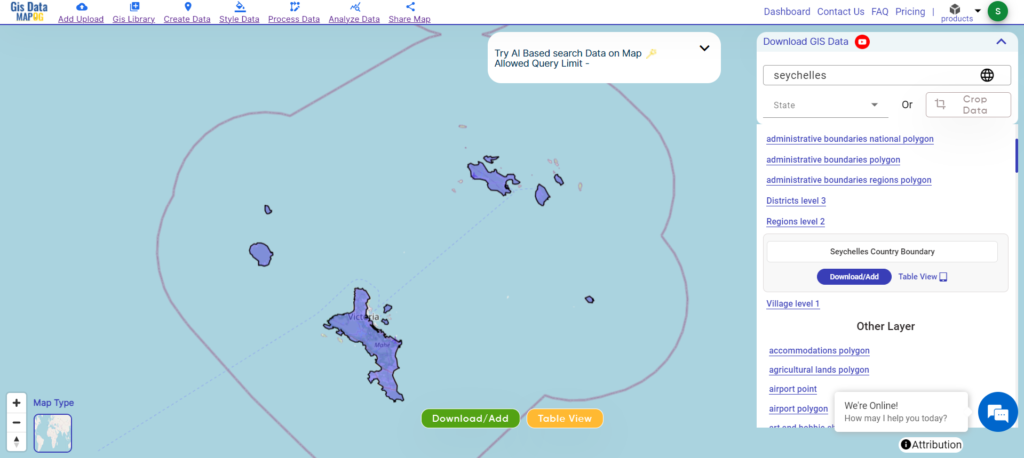
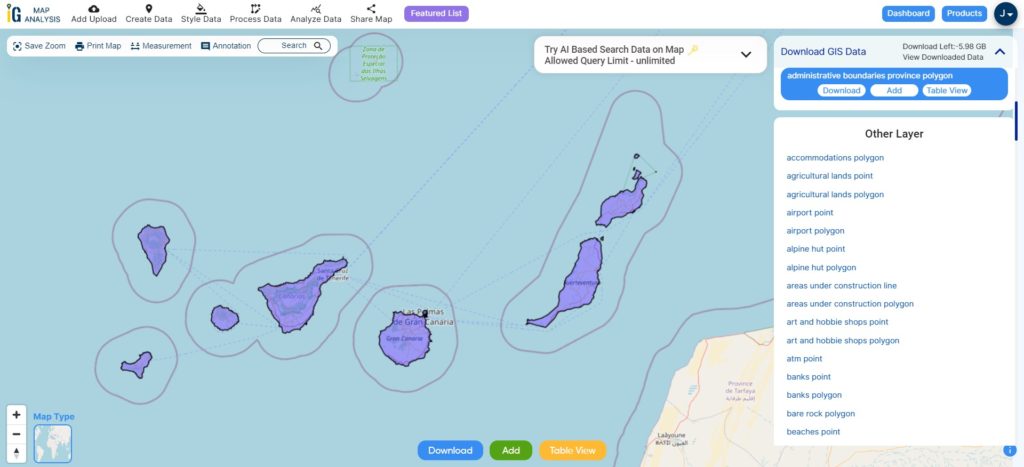
The Canary Islands, informally referred to as the Canaries, constitute a Spanish autonomous community and archipelago situated in Macaronesia within the Atlantic Ocean. Positioned just 100 kilometers (62 miles) to the west of Morocco at their closest point to the African mainland, they stand as the southernmost among Spain’s autonomous communities. Boasting a population of 2.2 million individuals, these islands represent the most densely inhabited special territory within the European Union.
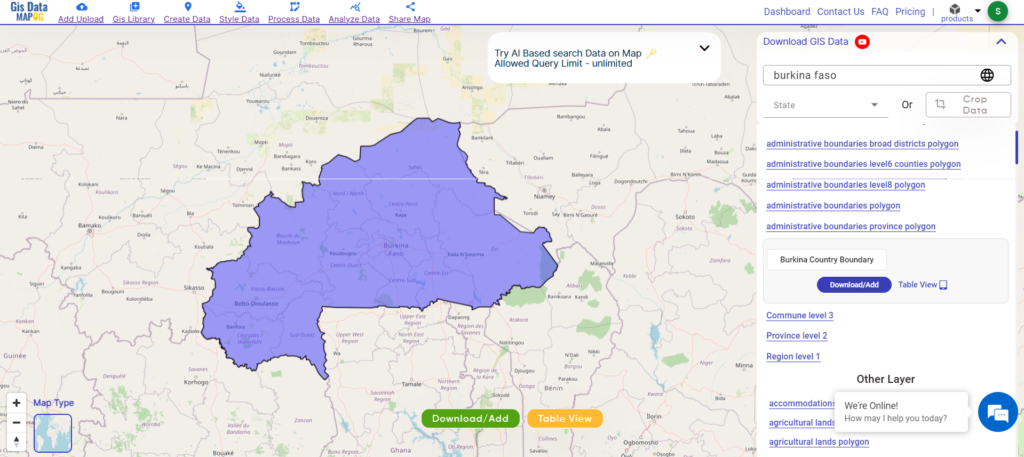
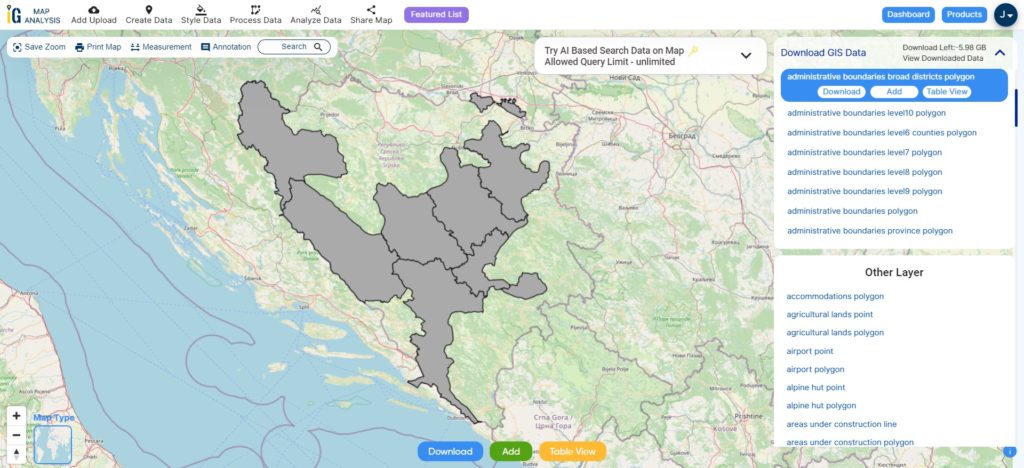
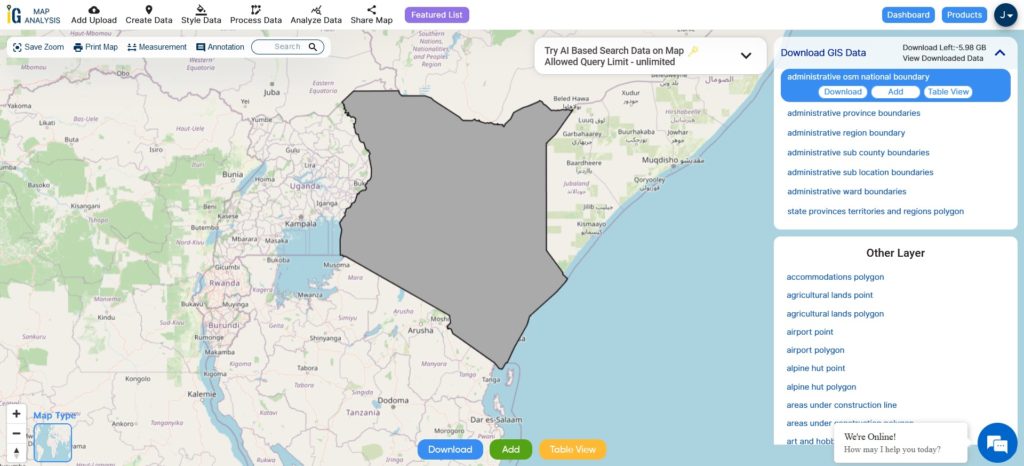
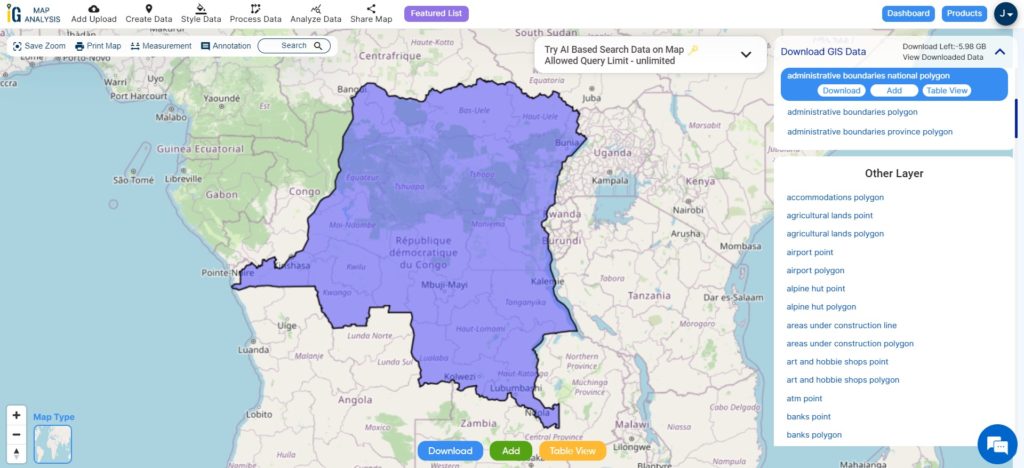
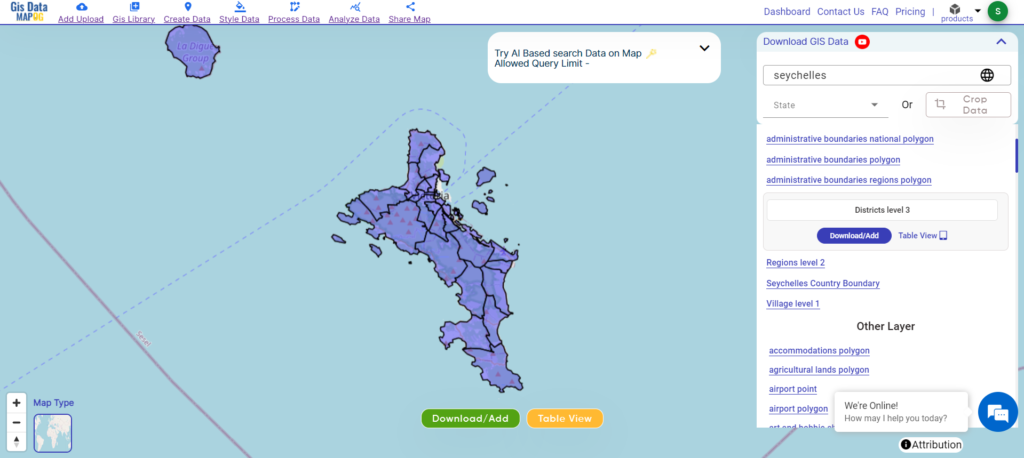
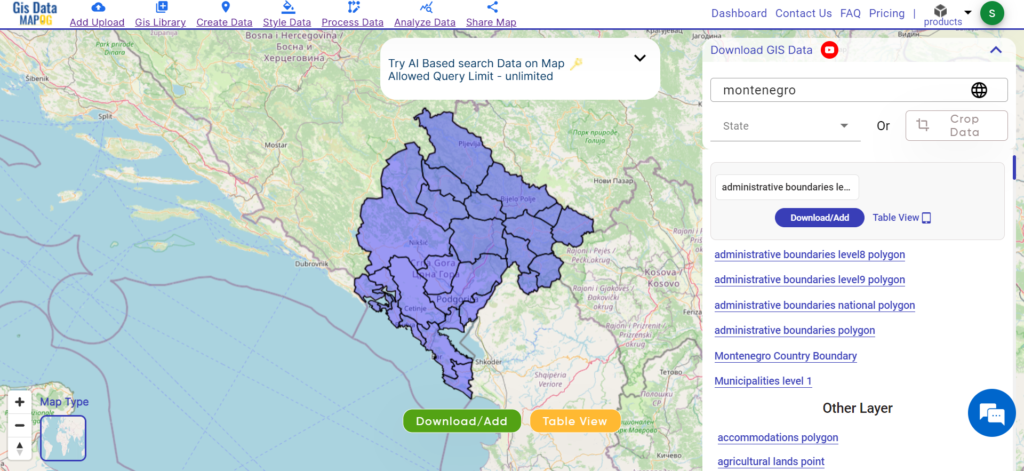
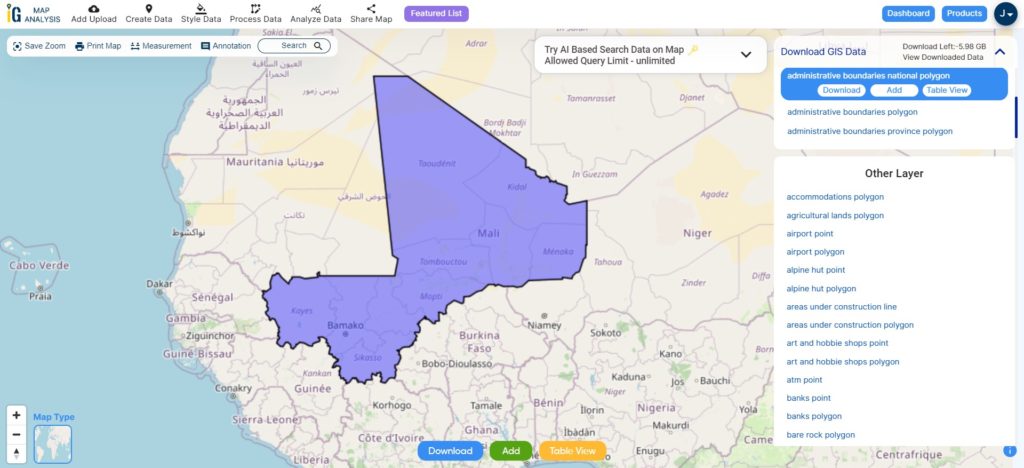
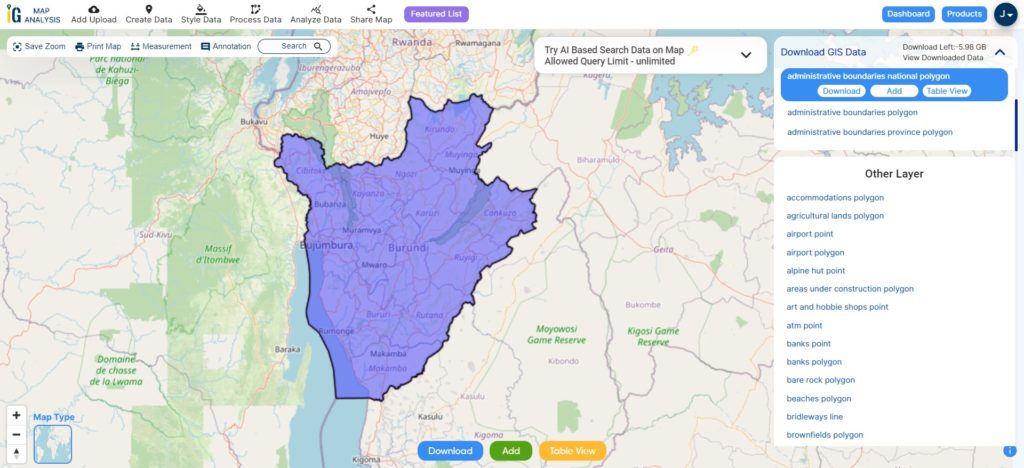
Download Canary Islands National Boundary Shapefile
After successfully logging in with a legitimate email address, select the country you want to work with. Next, choose the specific layer you need and click on the download option. Once that’s done, pick the desired format to acquire the essential GIS data. Before proceeding with the data download, make sure to review the data table for any relevant information.
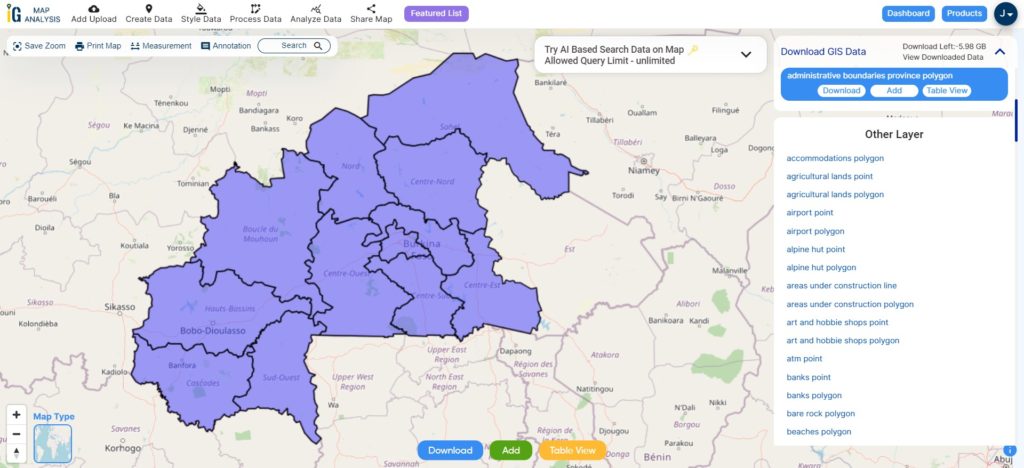
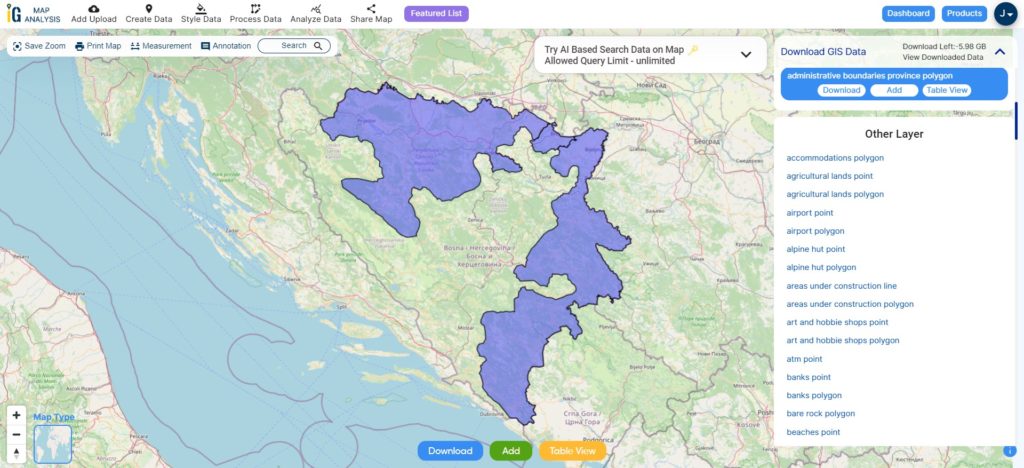
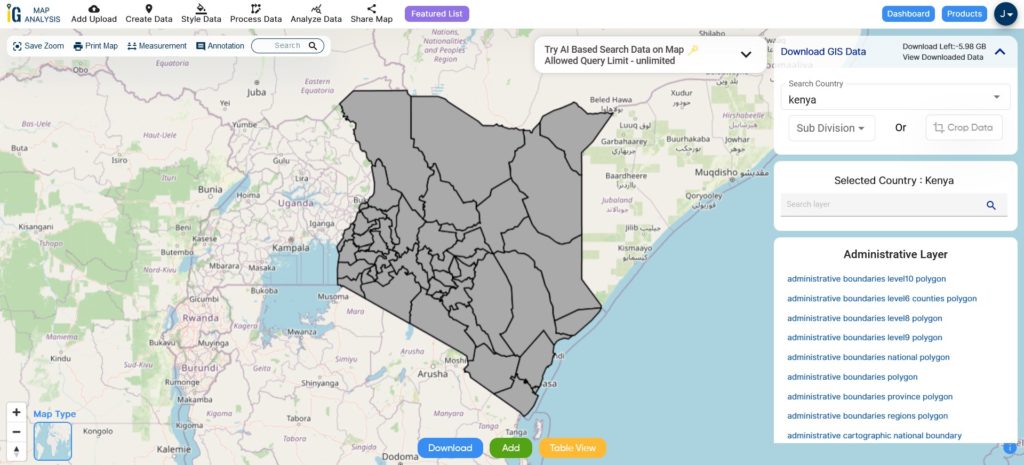
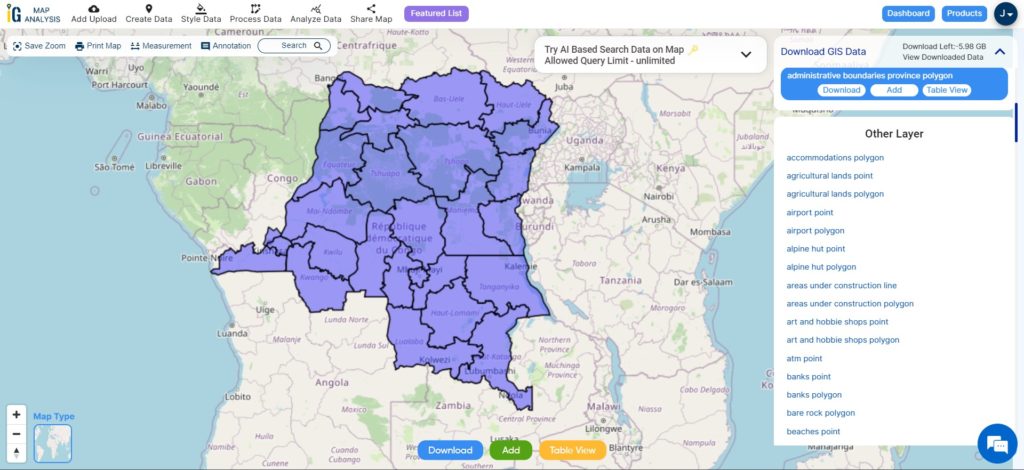
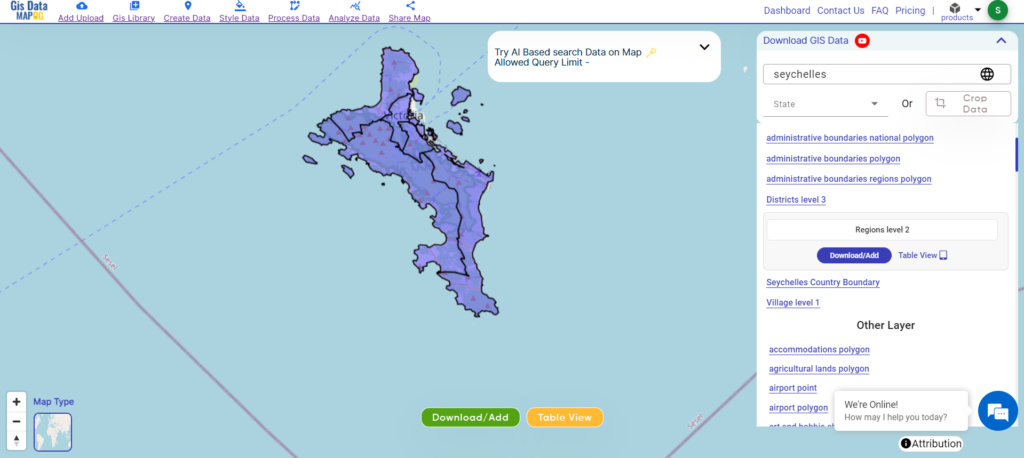
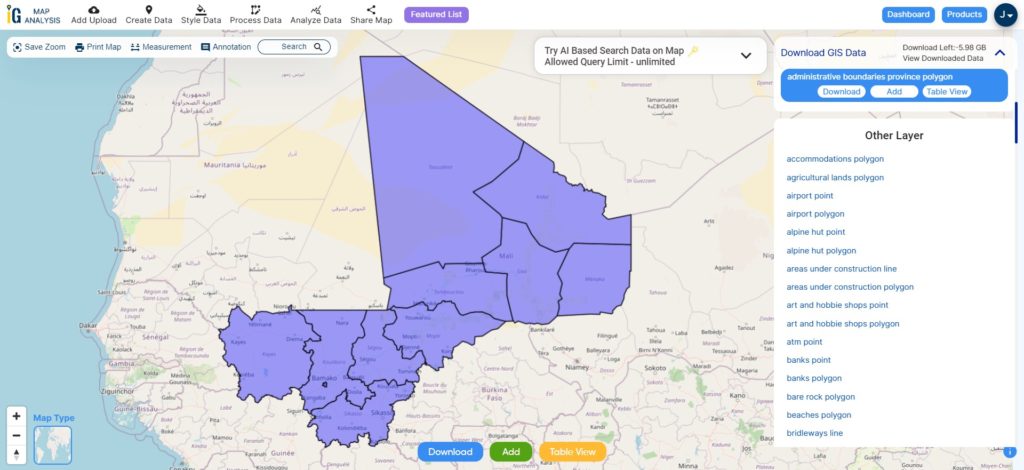
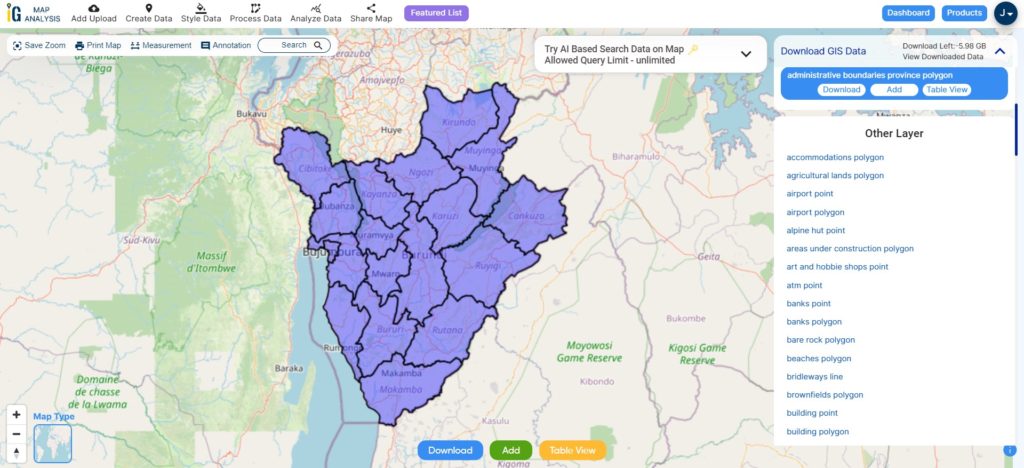
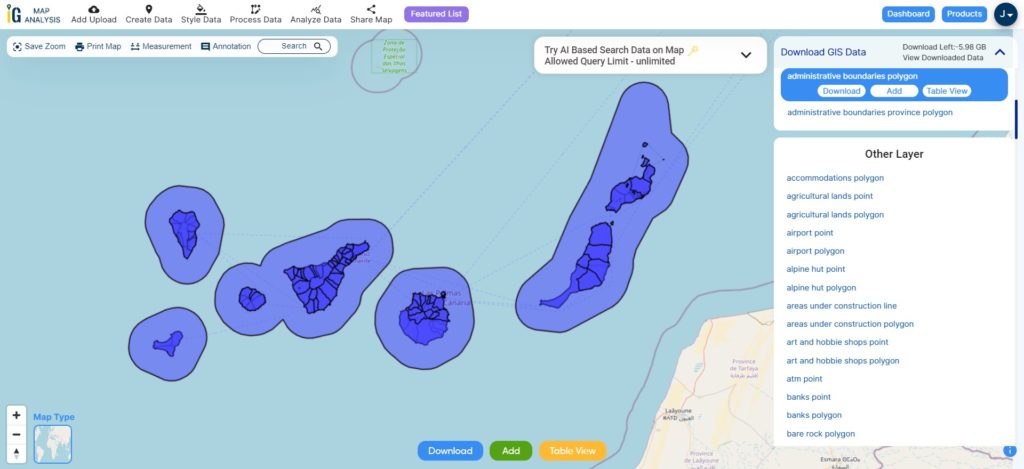
Download Canary Islands Provinces Shapefile Data
The former province comprising the Canary Islands was referred to as the Province of Canary Islands. It had its administrative center in the city of Santa Cruz de Tenerife. Following the territorial reorganization in 1927, this province consisted of two parts: the province of Santa Cruz de Tenerife, which included the western islands of the Canaries, and the province of Las Palmas, which encompassed the eastern islands.
Download Canary Islands Provinces Shapefile
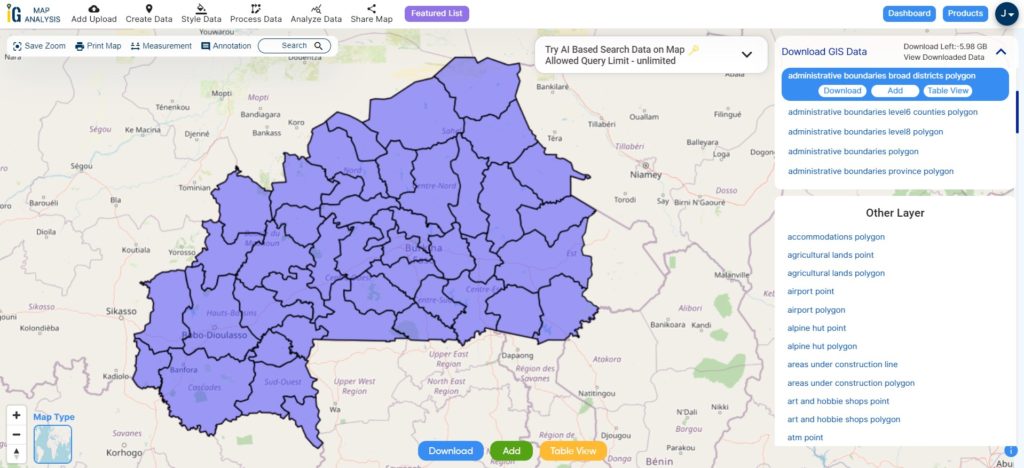
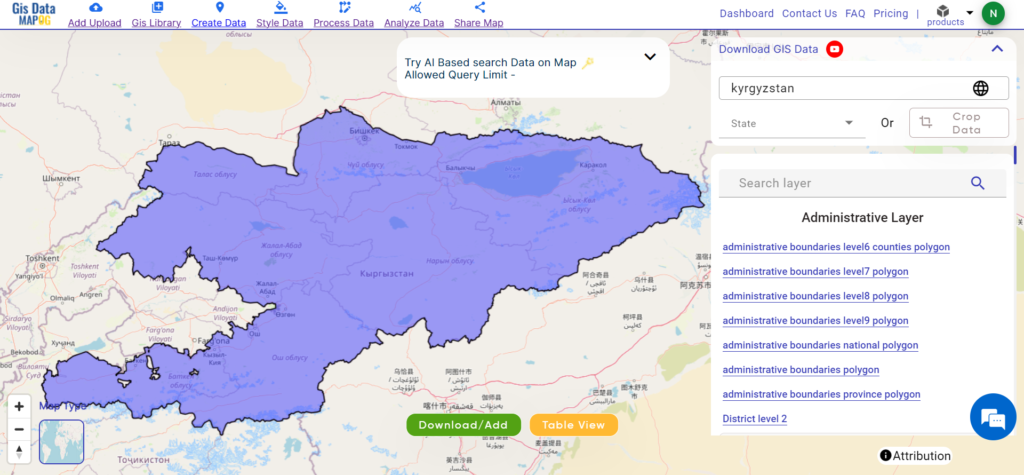
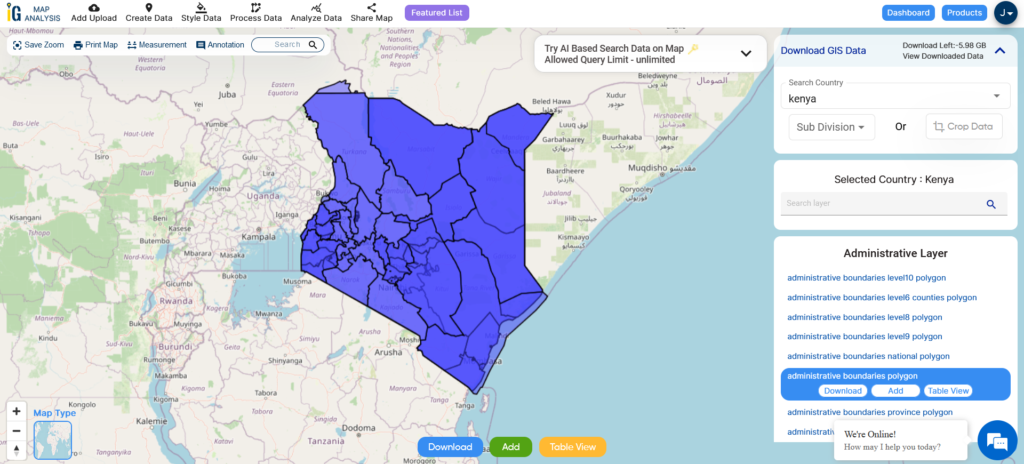
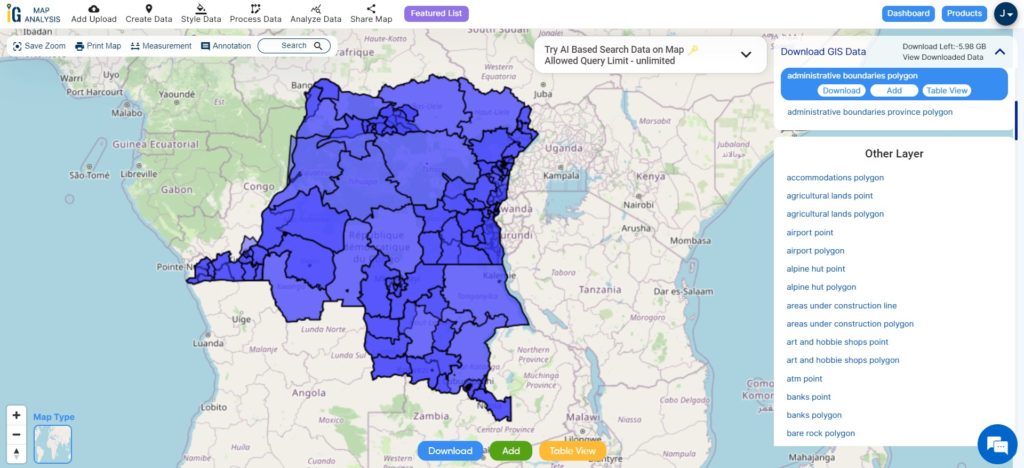
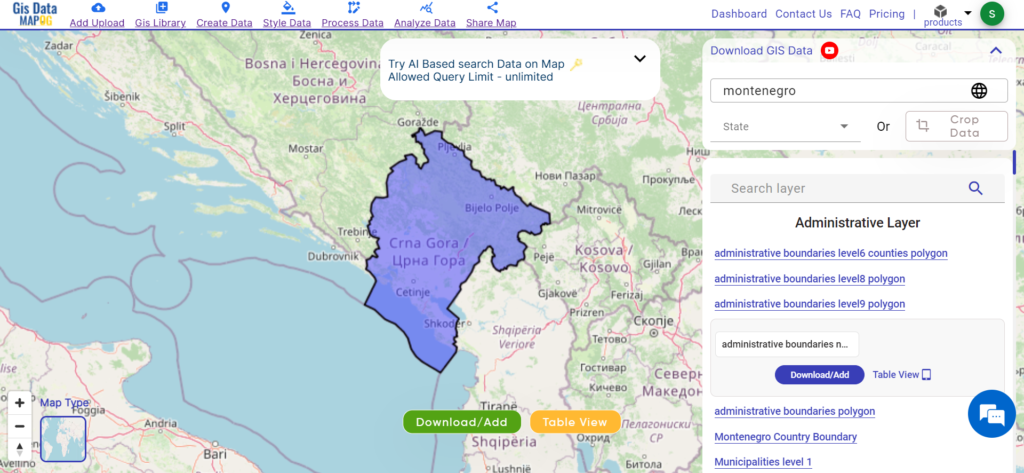
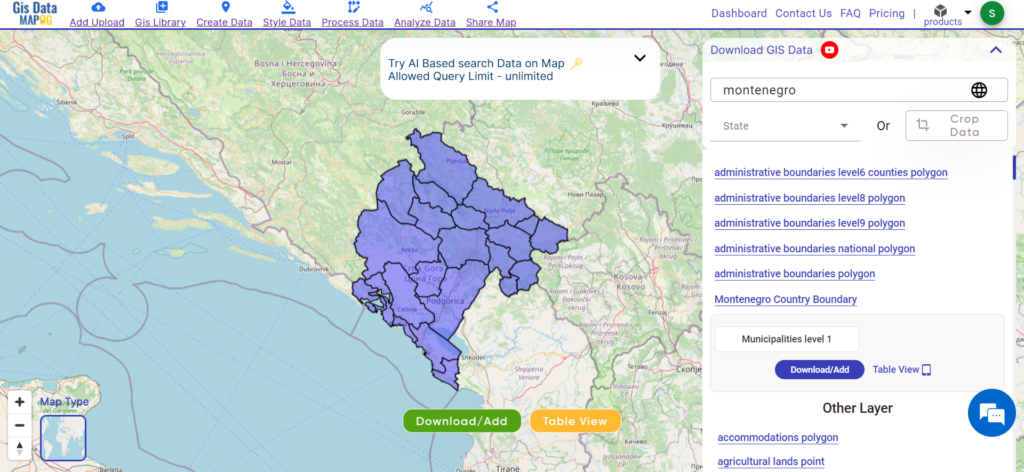
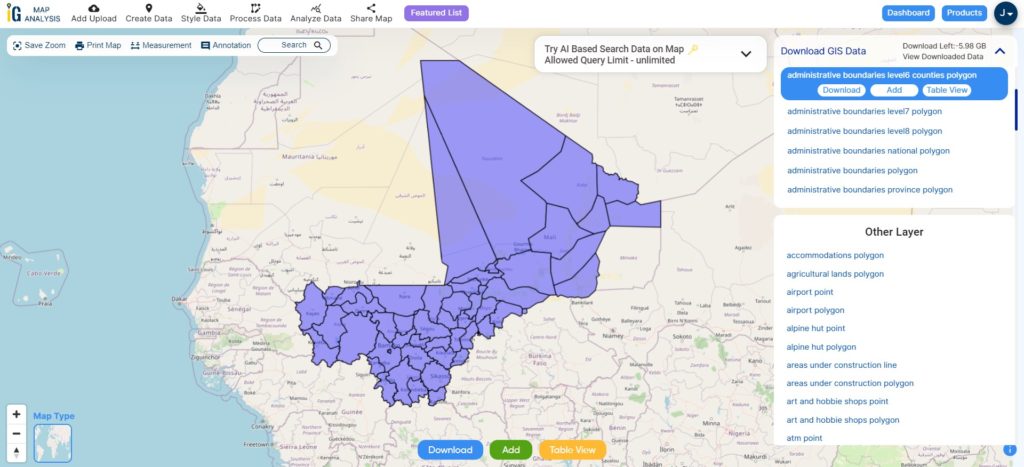
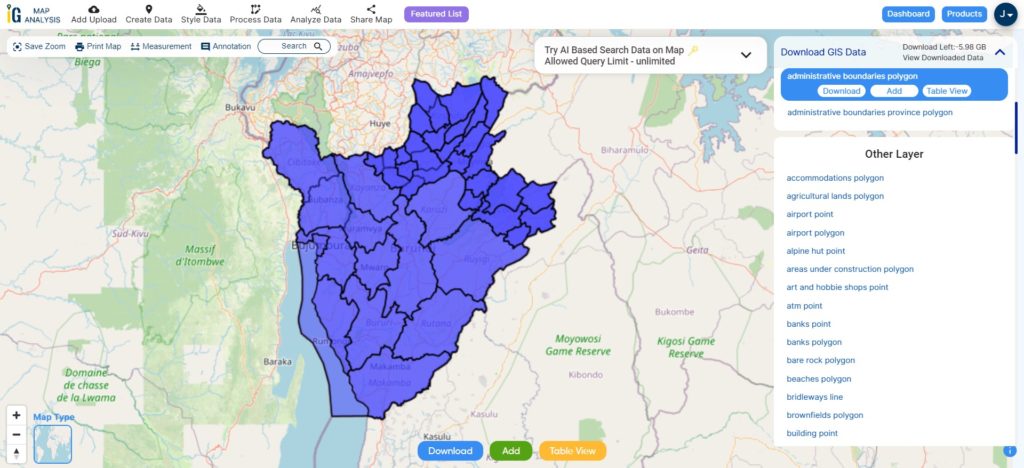
Download Canary Islands National, Provinces and Municipality Combined Shapefile Data
The Canary Islands are administratively divided into two provinces: Santa Cruz de Tenerife and Las Palmas. Each province is further divided into municipalities, which are the local administrative units. Santa Cruz de Tenerife province covers the western islands, including Tenerife, La Palma, La Gomera, and El Hierro, while Las Palmas province encompasses the eastern islands of Gran Canaria, Fuerteventura, and Lanzarote.
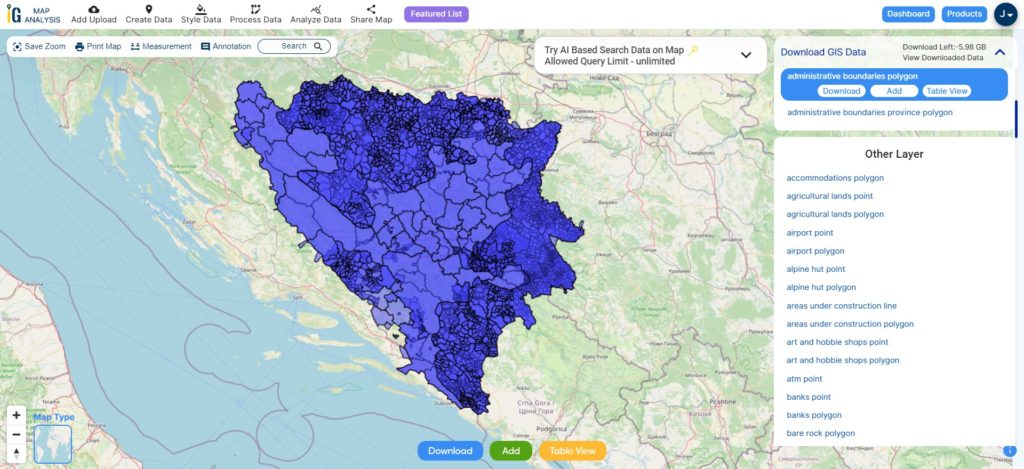
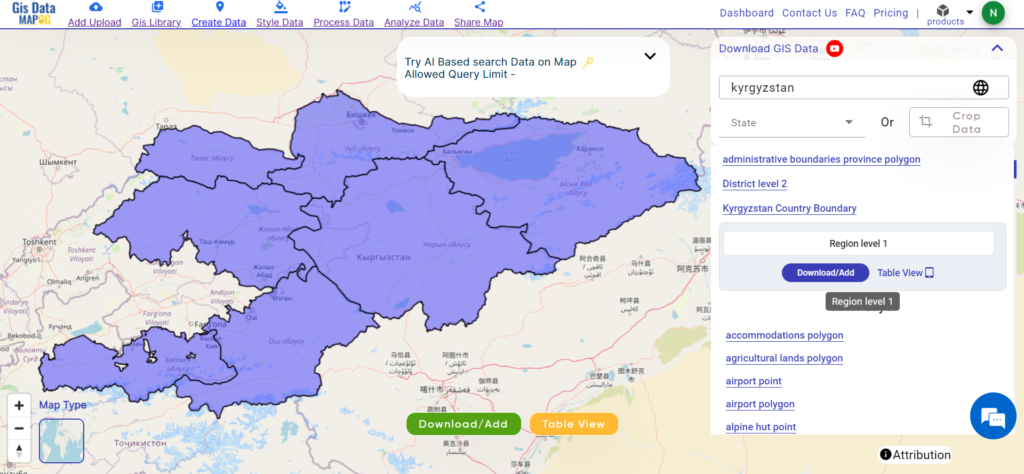
Download Canary Islands National, Province, Municipality Shapefile
Other Administrative Boundary Data:
Other GIS Data:
- Download Canary Islands River Lines Shapefile
- Download Canary Islands Agricultural Lands Shapefile
- Download Canary Islands Water Lines Shapefile
- Download Canary Islands Airport Point Shapefile
- Download Canary Islands Road Line Shapefile
Above all links are provided for GIS data of Canary Islands if you are looking for any specific data please write us on support@mapog.com
Download Shapefile for the following:
- World Countries Shapefile
- Australia
- Argentina
- Austria
- Belgium
- Brazil
- Canada
- Denmark
- Fiji
- Finland
- Germany
- Greece
- India
- Indonesia
- Ireland
- Italy
- Japan
- Kenya
- Lebanon
- Madagascar
- Malaysia
- Mexico
- Mongolia
- Netherlands
- New Zealand
- Nigeria
- Papua New Guinea
- Philippines
- Poland
- Russia
- Singapore
- South Africa
- South Korea
- Spain
- Switzerland
- Tunisia
- United Kingdom Shapefile
- United States of America
- Vietnam
- Croatia
- Chile
- Norway
- Maldives
- Bhutan
- Colombia
- Libya
- Comoros
- Hungary
- Laos
- Estonia
- Iraq
- Portugal
- Azerbaijan
- Macedonia
- Romania
- Peru
- Marshall Islands
- Slovenia
- Nauru
- Guatemala
- El Salvador
- Afghanistan
- Cyprus
- Syria
- Slovakia
- Luxembourg
- Jordan
- Armenia
- Haiti And Dominican Republic
Disclaimer : If you find any shapefile data of country provided is incorrect do contact us or comment below, so that we will correct the same in our system as well we will try to correct the same in openstreetmap.