Switching between Google Maps and OpenStreetMap in React Native : In this post I am going to discuss about Google Maps and OpenStreetMap in react native with one example.This example code will just show the Google Maps and OpenStreetMap on the screen of mobile ,but before going to detail of this article I suggest you to read the following page:
react-native-maps
Switching between Google Maps and OpenStreetMap in React Native
Installation :
First create a react native project by following command :
react-native init MyProject
Install React Native Map components in your React Native project:
cd MyProject

npm install react-native-maps --save
Build configuration on iOS :
For this go to Link
Build configuration on Android:
Define the react-native-maps project in android/settings.gradle:
...
include ':react-native-maps'
project(':react-native-maps').projectDir = new File(rootProject.projectDir, '../node_modules/react-native-maps/lib/android')
Add the react-native-maps as an dependency of your app in android/app/build.gradle:
...
dependencies {
  ...
  implementation project(':react-native-maps')
}
In build.gradle of android(If you’ve defined project-wide properties ):
buildscript {...}
allprojects {...}

/**
 + Project-wide Gradle configuration properties
 */
ext {
    compileSdkVersion   = 26
    targetSdkVersion    = 26
    buildToolsVersion   = "26.0.2"
    supportLibVersion   = "26.1.0"
    googlePlayServicesVersion = "11.8.0"
    androidMapsUtilsVersion = "0.5+"
}
If you do not have project-wide properties defined and have a different play-services version then use the following instead :
...
dependencies {
   ...
   implementation(project(':react-native-maps')){
       exclude group: 'com.google.android.gms', module: 'play-services-base'
       exclude group: 'com.google.android.gms', module: 'play-services-maps'
   }
   implementation 'com.google.android.gms:play-services-base:10.0.1'
   implementation 'com.google.android.gms:play-services-maps:10.0.1'
}
Specify your Google Maps API Key:
Add your API key to your manifest file (android/app/src/main/AndroidManifest.xml):
<application>
   <!-- You will only need to add this meta-data tag, but make sure it's a child of application -->
   <meta-data
     android:name="com.google.android.geo.API_KEY"
     android:value="Your Google maps API Key Here"/>
</application>
To get API key:
Google maps API Key
Add import com.airbnb.android.react.maps.MapsPackage;and new MapsPackage() in your MainApplication.java:
import com.airbnb.android.react.maps.MapsPackage;
...
    @Override
    protected List<ReactPackage> getPackages() {
        return Arrays.<ReactPackage>asList(
                new MainReactPackage(),
                new MapsPackage()
        );
    }
Example:
In our example ,there are four java script file as follow:
- index.js
- App.js
- GoogleMapScreen.js
- OpenStreetMapScreen.js
index.js:
import {AppRegistry} from 'react-native';
import App from './App';
import {name as appName} from './app.json';

AppRegistry.registerComponent(appName, () => App);
App.js :
import React, { Component } from 'react';
import {View,Text ,ScrollView} from 'react-native';
import { createDrawerNavigator,createAppContainer,DrawerItems, SafeAreaView } from 'react-navigation'
import {Container} from 'native-base';
import GoogleMapScreen from './src/GoogleMapScreen';
import OpenStreetMapScreen from './src/OpenStreetMapScreen';

const CustomDrawerContentComponent = (props) => (
     <ScrollView>
        <View style={{height:80,backgroundColor:'#1a8cff',alignItems:'center',justifyContent:'center'}}>
         <Text style={{ color:'white',fontSize:30}}>Maps</Text>
        </View>
        <SafeAreaView style={{flex:1}} forceInset={{ top: 'always', horizontal: 'never' }}>
        <DrawerItems {...props} />
       </SafeAreaView>
     </ScrollView>
);

const MyDrawerNavigator = createDrawerNavigator(
   {
    GoogleMap:GoogleMapScreen,
    OpenStreetMap:OpenStreetMapScreen,
   },
   {
    contentComponent:CustomDrawerContentComponent
   }
);

const MyApp = createAppContainer(MyDrawerNavigator);

class App extends React.Component{
   render(){
      return(
        <Container>
          <MyApp />
        </Container>
     );
   }
}

export default App;
Explaination of App.js :
In App.js java script file,we are importing component from native-base and React-Navigation 3.x ,we need to install:
Install NativeBase
npm install native-base --save
Install Peer Dependencies
react-native link
Install the react-navigation package
npm install --save react-navigation
install react-native-gesture-handler :
npm install --save react-native-gesture-handler
Link all native dependencies:
react-native link
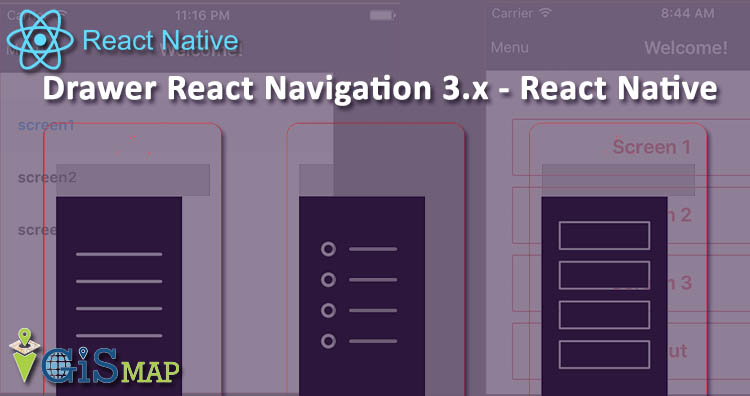
In this code , one drawer is created for two screen namely GoogleMapScreen and OpenStreetMapScreen , for more detail on drawer in react-navigation 3.x ,you can refer to following post:
drawer in react-navigation 3.x
GoogleMapScreen.js
import React, { Component } from 'react';
import {
StyleSheet,
View,
Dimensions,
ScrollView,
Image
} from 'react-native';
import {Button,Container,Header,Left,Right,Icon,Text,Body } from 'native-base';
import MapView from 'react-native-maps';

const { width, height } = Dimensions.get('window');

const ASPECT_RATIO = width / height; //,
const LATITUDE = 22.720555;
const LONGITUDE = 75.858633;
const LATITUDE_DELTA = 0.0922;
const LONGITUDE_DELTA = LATITUDE_DELTA * ASPECT_RATIO;

class GoogleMapScreen extends React.Component {
   static navigationOptions = {
     drawerLabel: 'Google Maps',
     drawerIcon: ({ tintColor }) => (
           <Image
                 source={require('../image/icons8-google-maps-48.png')}
            />
     ),
};
constructor(props) {
  super(props);
  this.state = {
    region: {
      latitude: LATITUDE,
      longitude: LONGITUDE,
      latitudeDelta: LATITUDE_DELTA,
      longitudeDelta: LONGITUDE_DELTA,
    },
  };
}
render() {
  return (
   <Container>
    <Header>
     <Left style={{ flexDirection: 'row' }}>
      <Icon onPress={() => this.props.navigation.openDrawer()} name="md-menu" style={{ color: 'white', marginRight: 15 }} />
     </Left>
     <View style={{alignItems:'center',justifyContent:'center'}}>
       <Text style={{ color: 'white' }} >Google Maps</Text>
     </View>
     <Right>
       <Icon name="md-cart" style={{ color: 'white' }} />
     </Right>
    </Header>
    <View >
     <MapView
        provider={this.props.provider}
        style={styles.map}
        scrollEnabled={true}
        zoomEnabled={true}
        pitchEnabled={true}
        rotateEnabled={true}
        initialRegion={this.state.region}
     />
    </View>
  </Container>
  );
 }
}// End of MyHomeScreen class
export default GoogleMapScreen;

const styles = StyleSheet.create({
   map: {
    width: 400,
    height: 800,
   },
});
Explaination of GoogleMapScreen.js:
This code is going to show google maps on the screen of mobile. These constants are define :
const { width, height } = Dimensions.get('window');

const ASPECT_RATIO = width / height;
const LATITUDE = 22.720555;
const LONGITUDE = 75.858633;
const LATITUDE_DELTA = 0.0922;
const LONGITUDE_DELTA = LATITUDE_DELTA * ASPECT_RATIO;
In constructor ,region object is initialize as follow:
this.state = {
  region: {
    latitude: LATITUDE,
    longitude: LONGITUDE,
    latitudeDelta: LATITUDE_DELTA,
    longitudeDelta: LONGITUDE_DELTA,
  },
};
The following MapView tag will shaow Google Maps on screen:
<MapView
   provider={this.props.provider}
   style={styles.map}
   scrollEnabled={true}
   zoomEnabled={true}
   pitchEnabled={true}
   rotateEnabled={true}
   initialRegion={this.state.region}
/>
OpenStreetMap.js
import React, { Component } from 'react';
import {View,StyleSheet,StatusBar,Image,Dimensions} from 'react-native';
import {Button,Container,Header,Left,Right,Icon,Text,Radio } from 'native-base';
import MapView ,{ MAP_TYPES, PROVIDER_DEFAULT,UrlTile } from 'react-native-maps';

const { width, height } = Dimensions.get('window');

const ASPECT_RATIO = width / height;
const LATITUDE = 22.720555;
const LONGITUDE = 75.858633;
const LATITUDE_DELTA = 0.0922;
const LONGITUDE_DELTA = LATITUDE_DELTA * ASPECT_RATIO;

class OpenStreetMapScreen extends React.Component {
  static navigationOptions = {
    drawerLabel: 'OpenStreetMap',
    drawerIcon: ({ tintColor }) => (
    <Image
         source={require('../image/Openstreetmap_logo.png')}
         style={{width:40,height:40}}
    />
   ),
};
constructor(props) {
   super(props);
     this.state = {
       region: {
         latitude: LATITUDE,
         longitude: LONGITUDE,
         latitudeDelta: LATITUDE_DELTA,
         longitudeDelta: LONGITUDE_DELTA,
       },
     };
 }
get mapType() {
   return this.props.provider === PROVIDER_DEFAULT ? MAP_TYPES.STANDARD : MAP_TYPES.NONE;
}
render() {
  return (
   <Container>
    <Header>
     <Left style={{ flexDirection: 'row' }}>
      <Icon onPress={() => this.props.navigation.openDrawer()} name="md-menu" style={{ color: 'white', marginRight: 15 }} />
     </Left>
     <View style={{alignItems:'center',justifyContent:'center'}}>
      <Text style={{ color: 'white' }} >OpenStreetMap</Text>
     </View>
     <Right>
      <Icon name="md-cart" style={{ color: 'white' }} />
     </Right>
    </Header>
    <View >
     <MapView
       region={this.state.region}
       provider={null}
       mapType={this.mapType}
       rotateEnabled={false}
       style={{flex: 1}}
       style={styles.map}
       showsUserLocation>
       <UrlTile
urlTemplate="http://a.tile.openstreetmap.de/tiles/osmde/{z}/{x}/{y}.png"
maximumZ={19}
/>
      </MapView>
     </View>
    </Container>
   );
  }
}
export default OpenStreetMapScreen

const styles = StyleSheet.create({
   map: {
    width: 400,
    height: 800,
   },
});
Explaination of OpenStreetMap.js :
Code of OpenStreetMap.js is similar to GoogleMapScreen.js only difference is in MapView tag as follow:
<MapView
  region={this.state.region}
  provider={null}
  mapType={this.mapType}
  rotateEnabled={false}
  style={{flex: 1}}
  style={styles.map}
  showsUserLocation>
  <UrlTile
urlTemplate="http://a.tile.openstreetmap.de/tiles/osmde/{z}/{x}/{y}.png"
maximumZ={19}
/>
</MapView>
Here MapView has one child tag <UrlTile> and prop of this tag is set to url as shown above in code which will print OpenStreetMap.
prop
mapType={this.mapType}Here mapType function is called ,and return of this function is assign to mapType prop.
mapType function:
get mapType() {
    return this.props.provider === PROVIDER_DEFAULT ? MAP_TYPES.STANDARD : MAP_TYPES.NONE;
}
When you will run above Project ,following output will come:

In the header ,we are having menu on left side. On the click of this menu,a drawer will open as shown below:
We are having two option in drawer 1)Google Maps 2)OpenStreetMap. When we will click Google Maps ,Google Map will be on screen as shown by first ScreenShot , now when we will click second option of OpenStreetMap then output will be as shown below:
So, this all about switch from Google Map to OpenStreetMap in react native. Please do comment if something’s missing.
Check out more on GIS Apps –
If you want to hire our team then visit Hire us
 Geographic Information System is a system intends to capture, Store, manage, manipulate, analyze the data.