Geographic Information System is a system intends to capture, Store, manage, manipulate, analyze the data.
 Consider a customer service manager working for a supermarket company wants to connect with some of their best customers for giving winning prizes and to promote their business. The manager has a list of contacts along with their address which is located all over America. In order to deliver the winning prizes to their doorstep, he has to find the best route which takes a minimum number of days to receive it. Hence he has to give the delivery partner the best route which is easier and less time-consuming.
In such cases, Geocoding helps to make the process easier. Geocoding is the process of converting one or more valid address with location details into GIS points.Geocoder tool of IGISMap can be used for converting address details to point GIS data in a few steps. You only need to upload the spreadsheet file with address columns and assign the address columns to start plotting. Option to review the plotting and edit the points are also available in this tool.
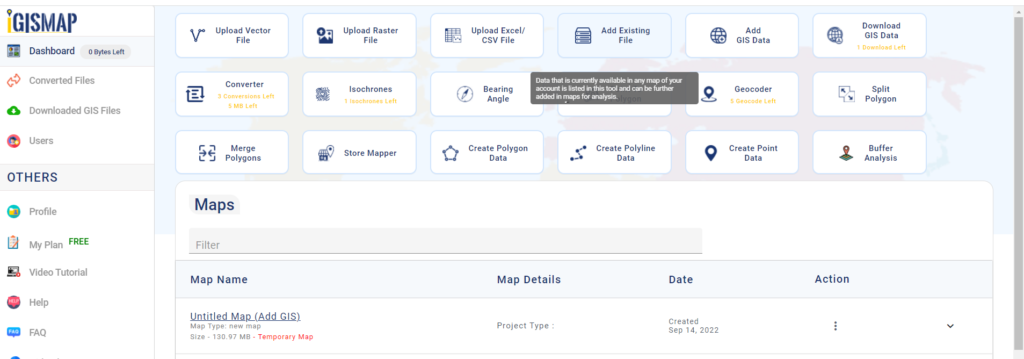
IGISMap is a GIS-based web platform, that provides multiple GIS applications that are most important in the field of geospatial analytics. The peculiarity of IGISMap in the GIS Industry is its UI/UX, which helps the user to perform effortless geospatial operations. IGISMap allows users to edit the data table of vector data by editing the name of the columns, deleting the columns, and adding new columns. The Geocoder tool on the IGISMap increases efficiency by enabling different companies to better coordinate their sales in both domestic and foreign marketing activities.
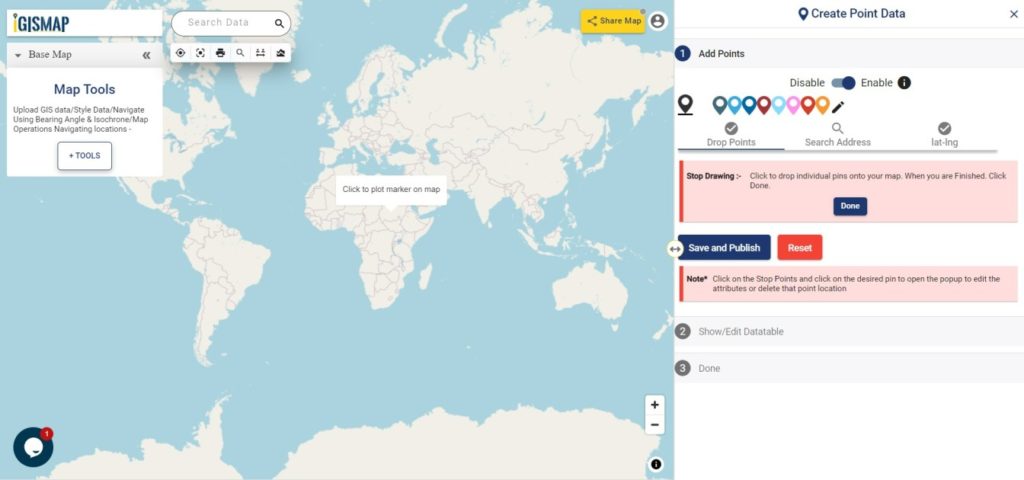
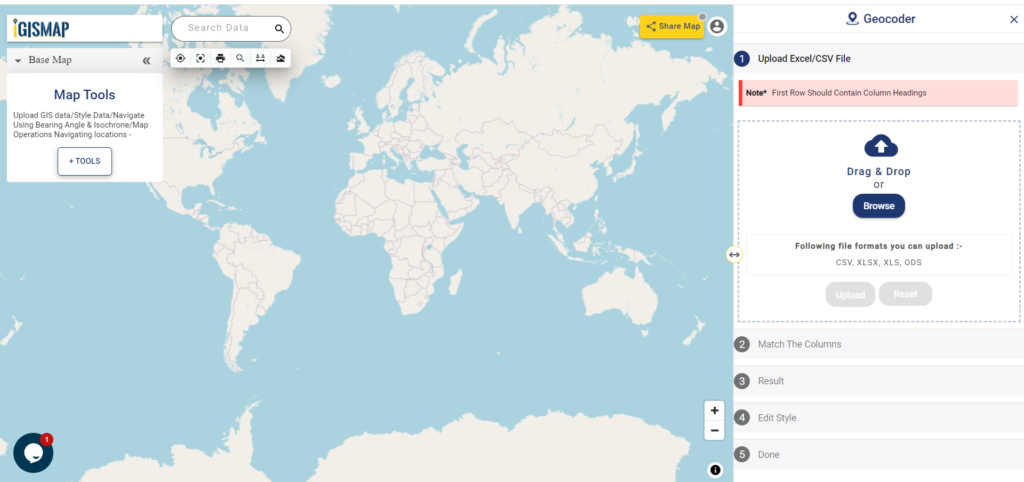
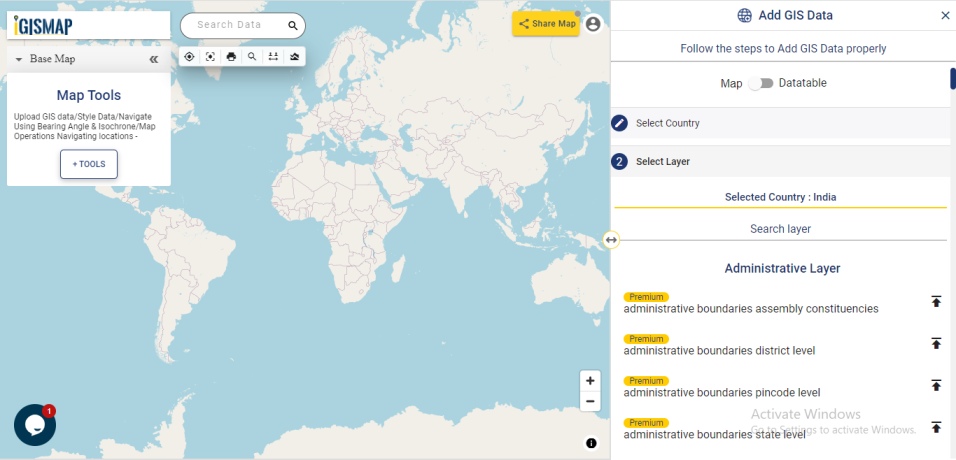
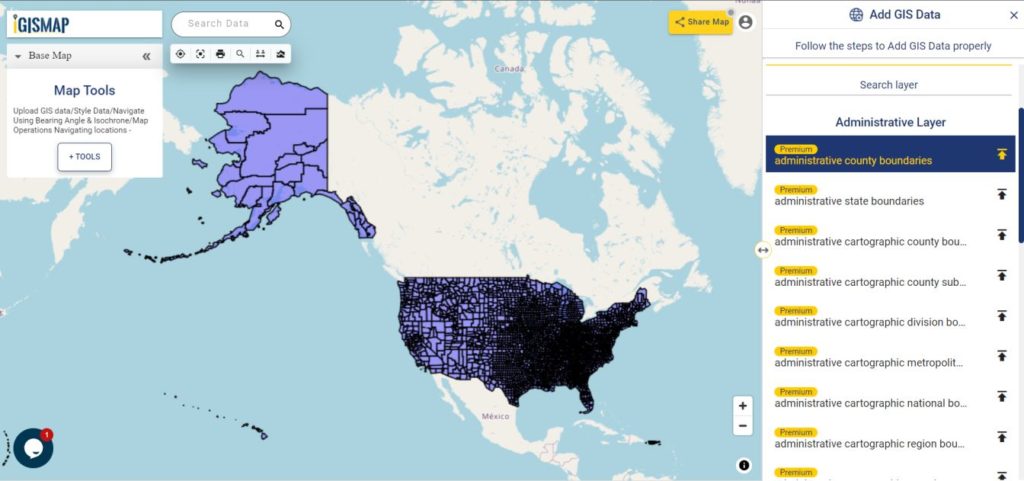
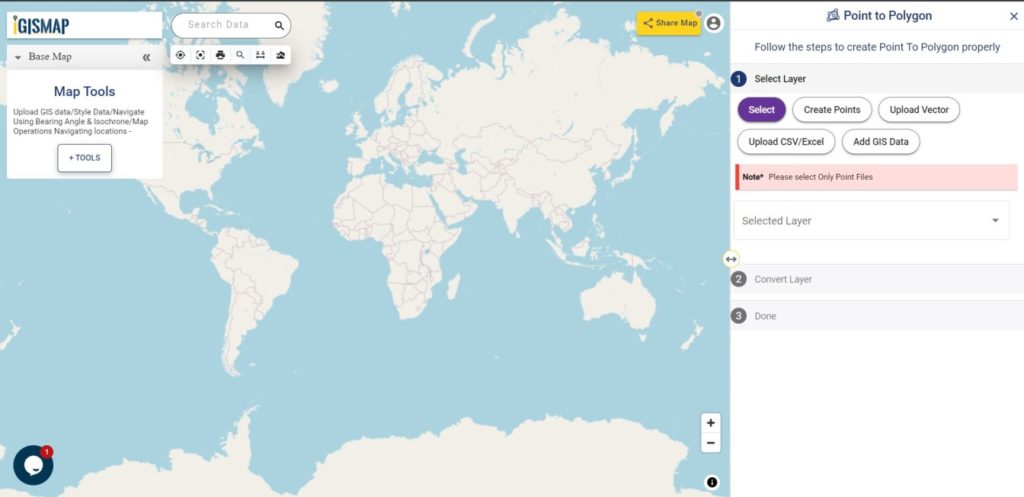
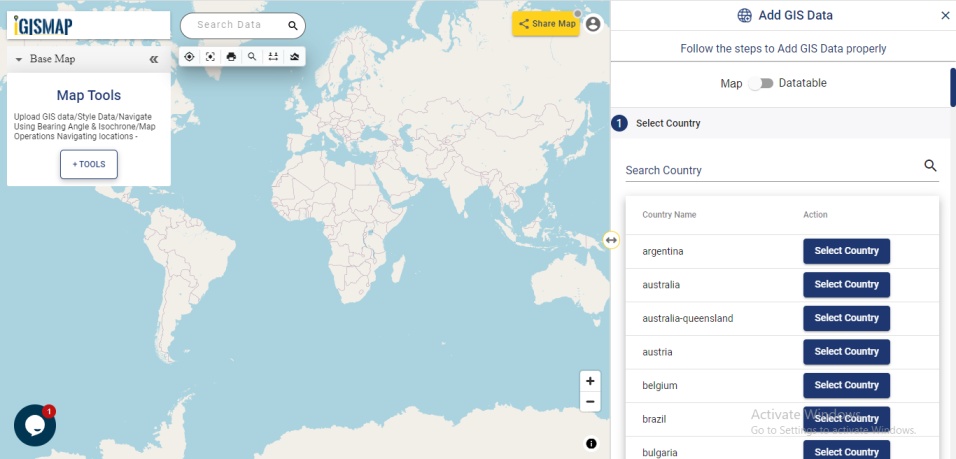
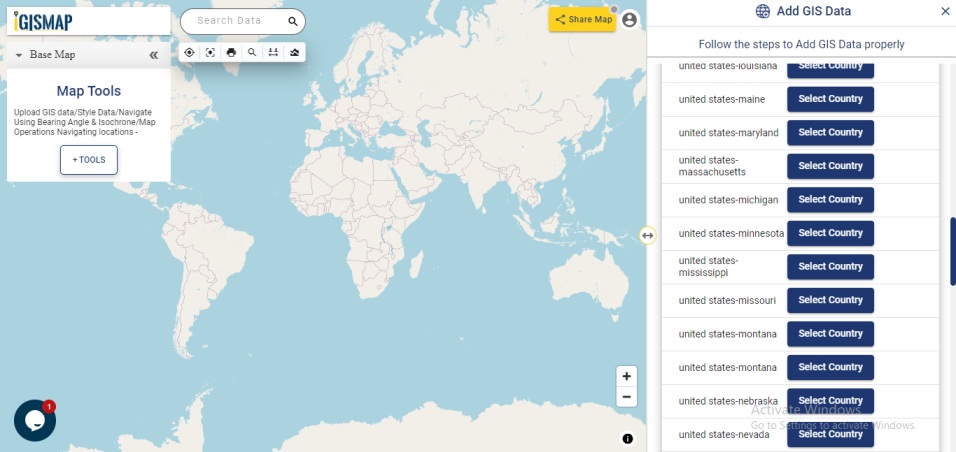
Open Geocoder tool using the following link https://map.igismap.com/geocoder
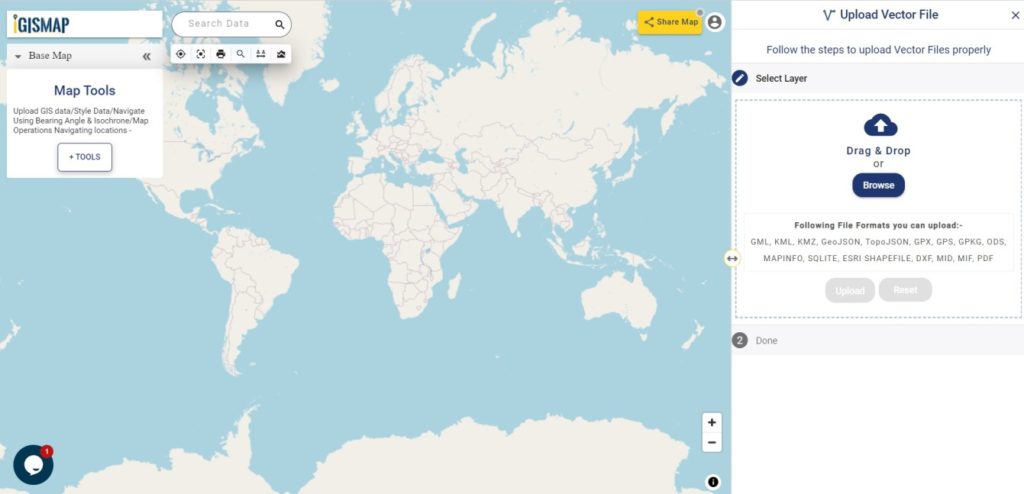
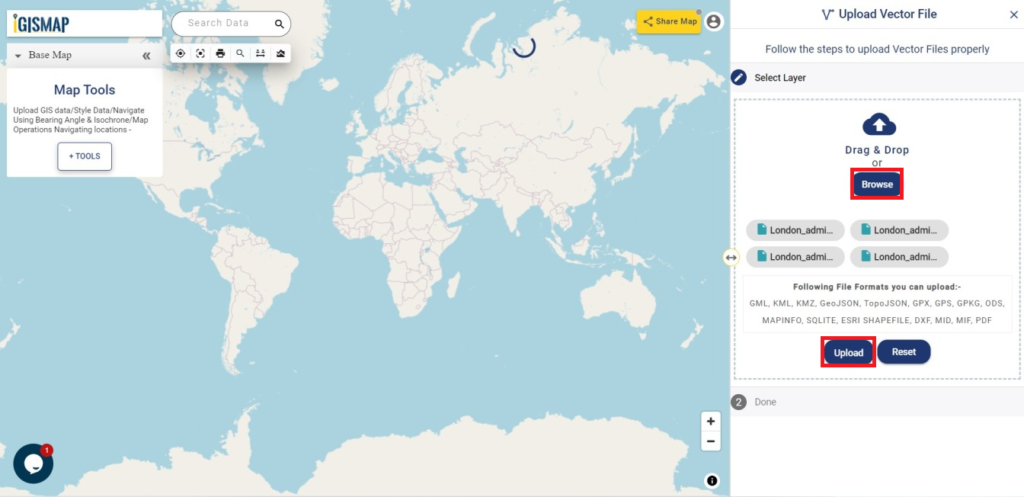
Upload spreadsheet file
For uploading the input file, click on the Browse option, select the excel/CSV file from your system that you want to visualize on IGISMap, and click on the Upload option.
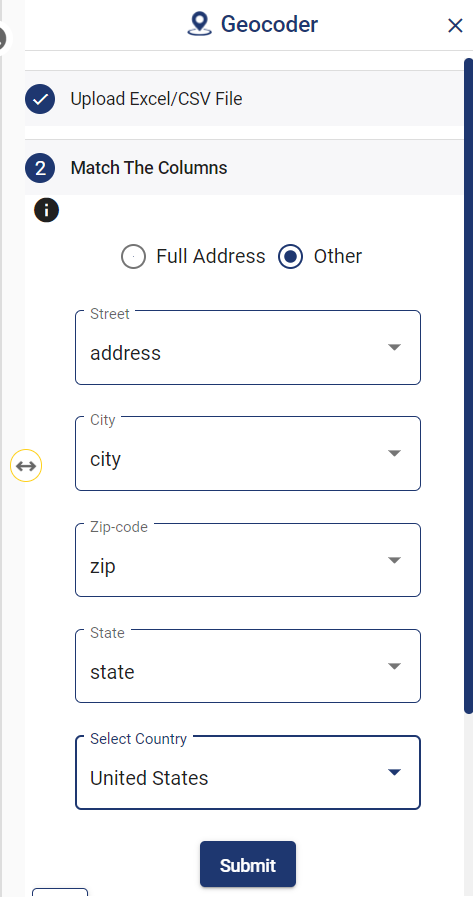
Match the Columns
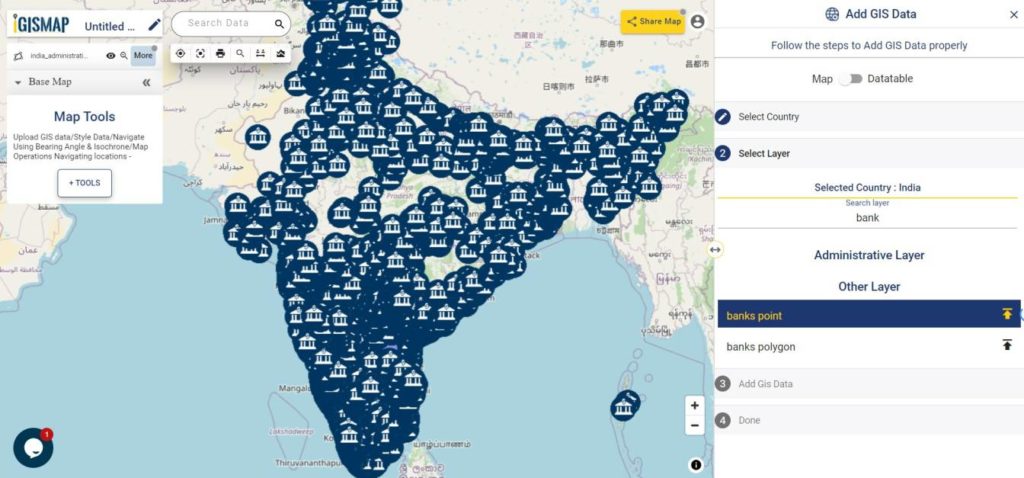
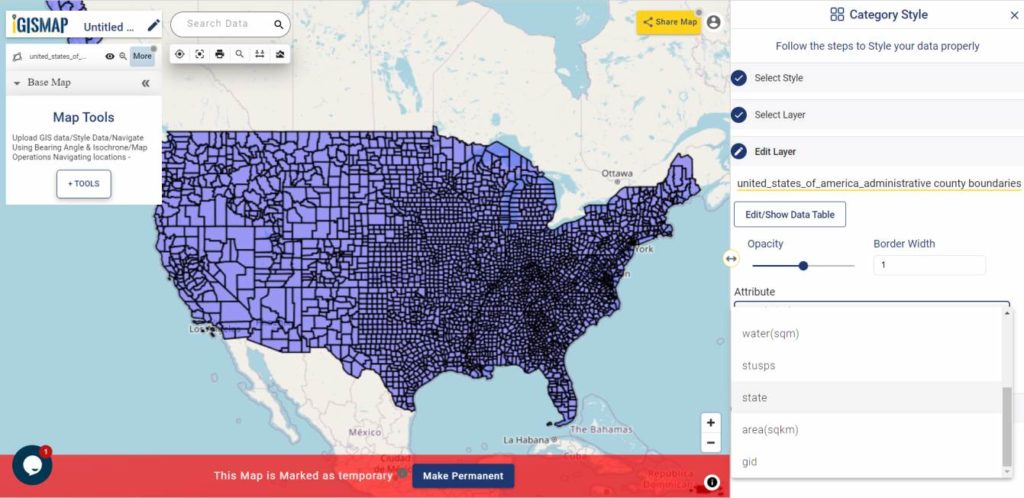
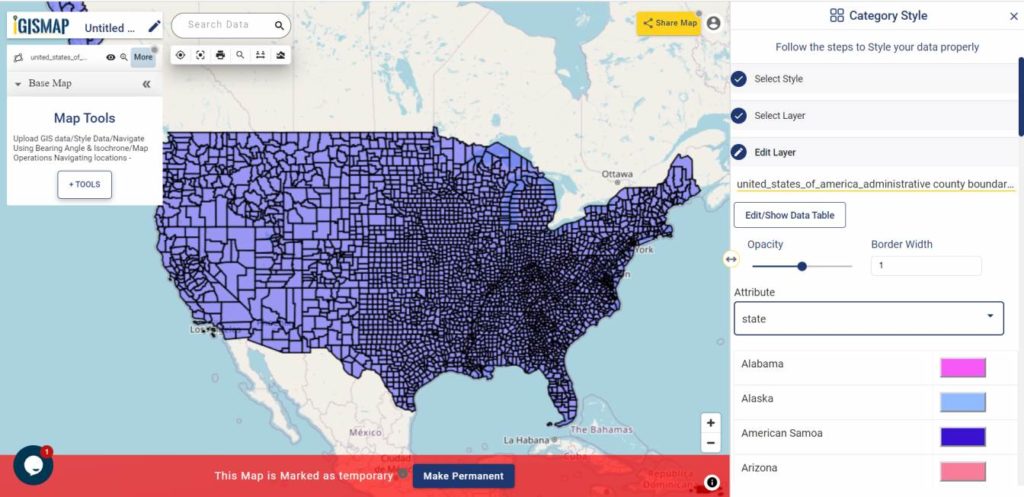
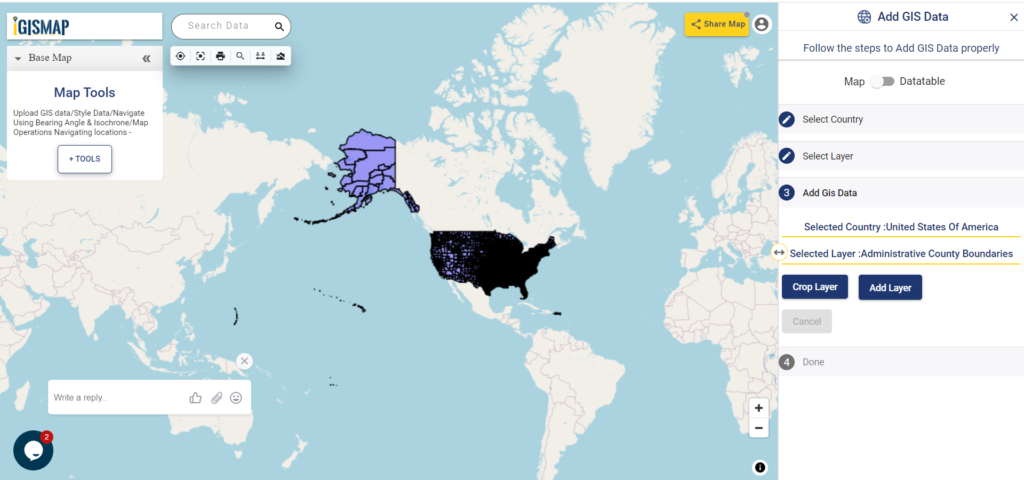
After successfully uploading the file, the next step is to assign the address columns in your file to be used for geocoding. There are 2 options to match the columns – Full Address and Other. Full Address option is used for files with address information provided in a single column. In our case, we have address distributed in several columns, thus we will choose Other option. Click Other option and select the right address columns from you file at the right address types such as address, city, zip, state. Then select the country and click Submit button to geocode the address.
Review the geocoded locations
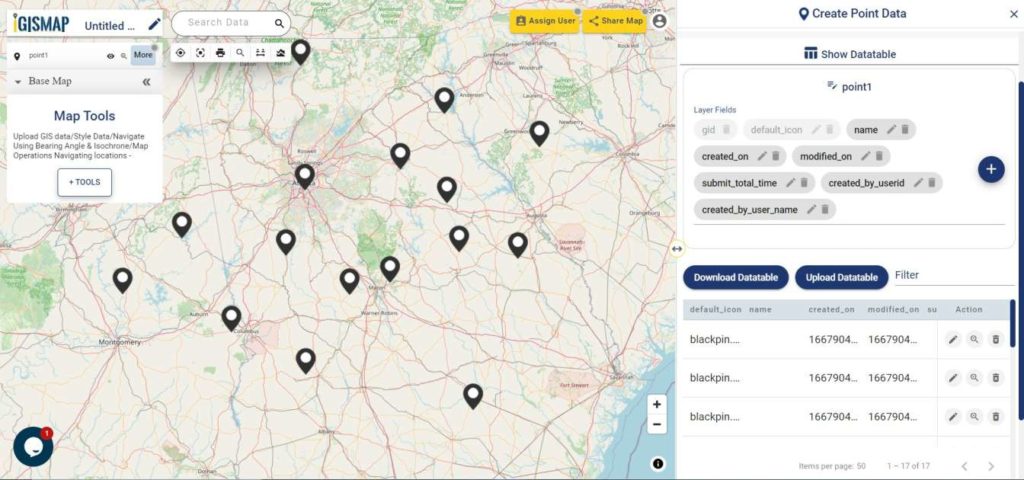
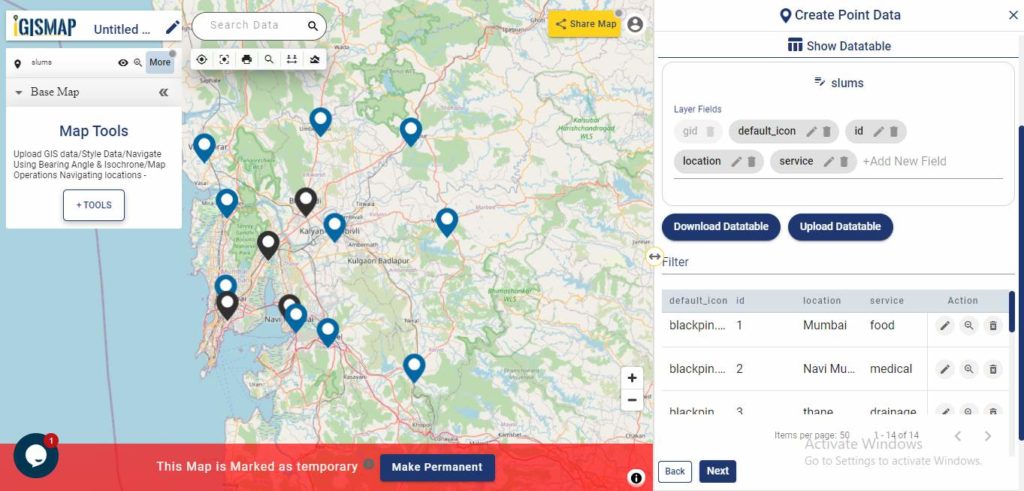
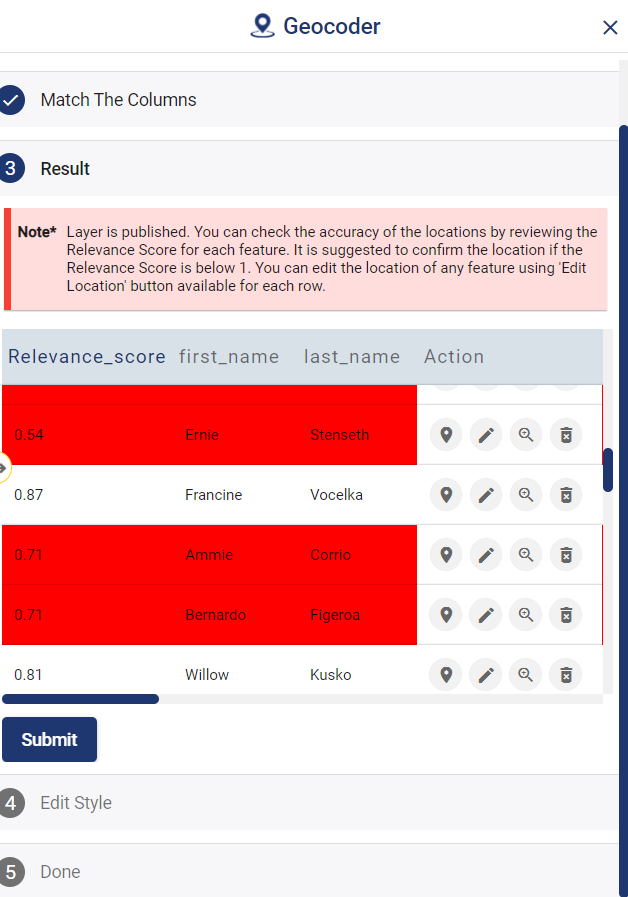
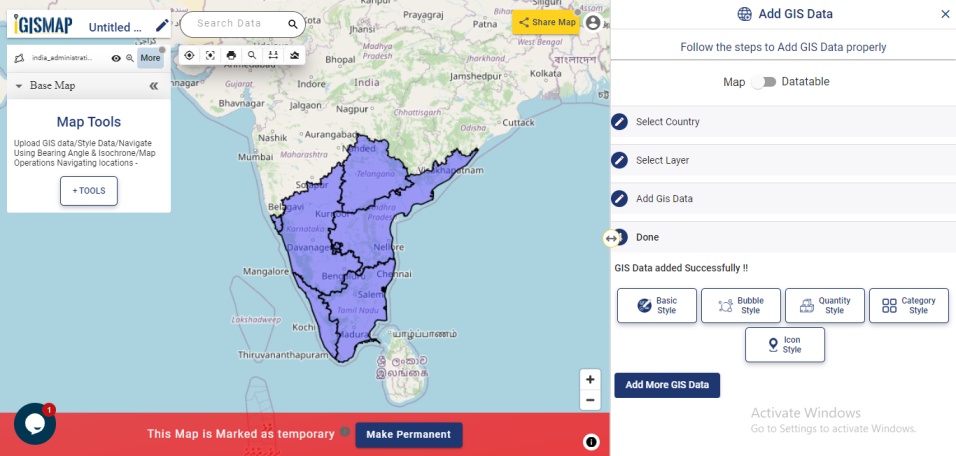
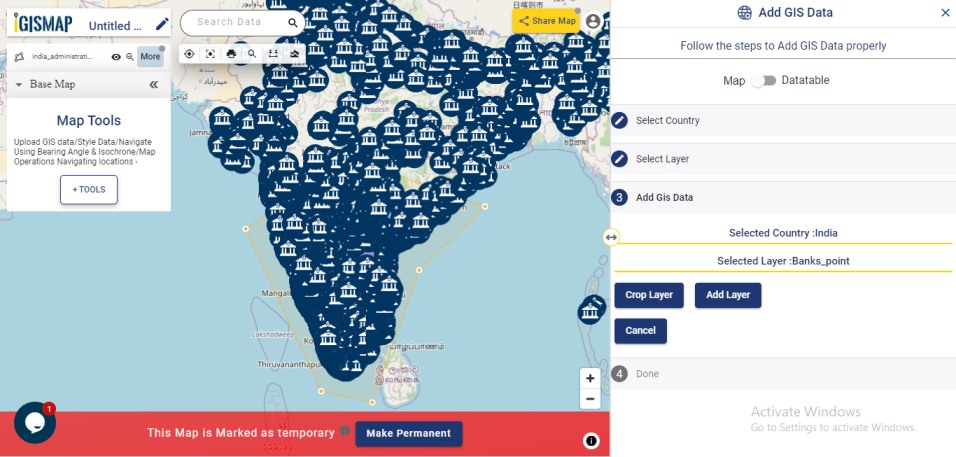
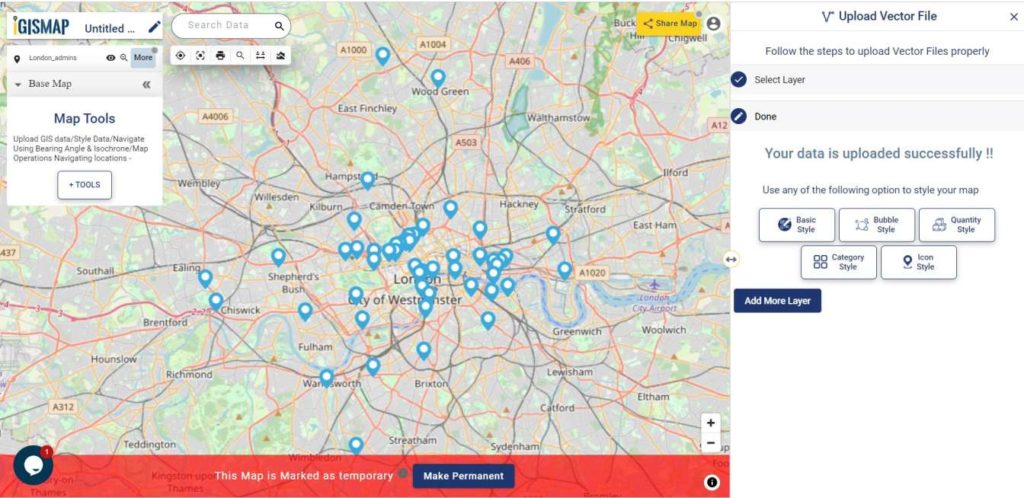
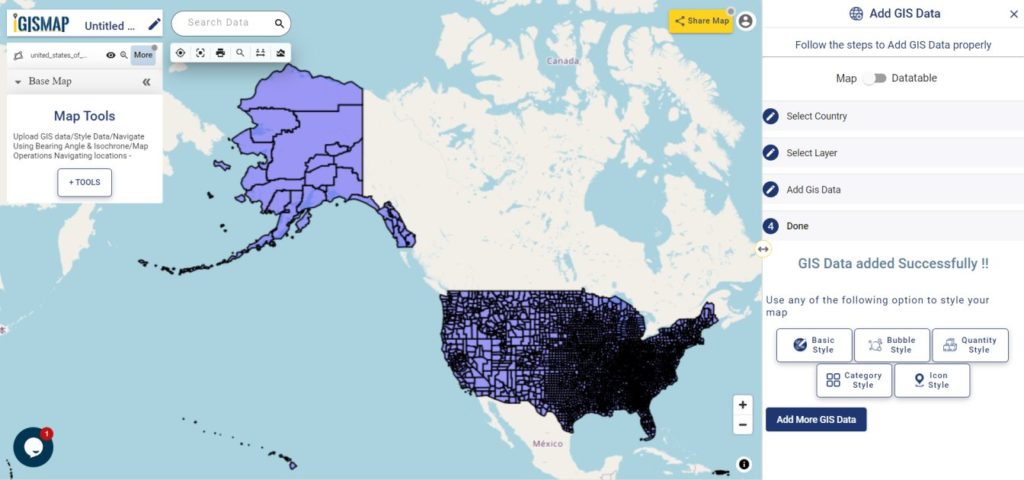
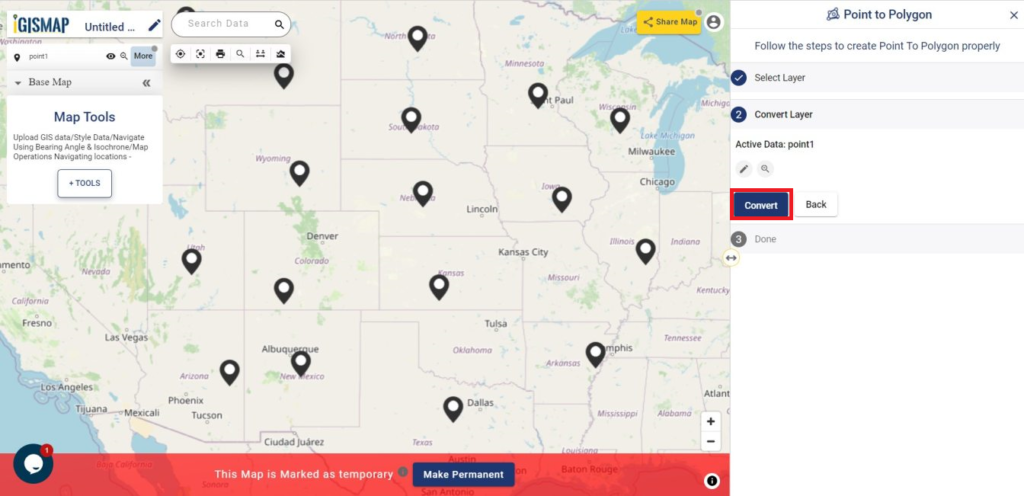
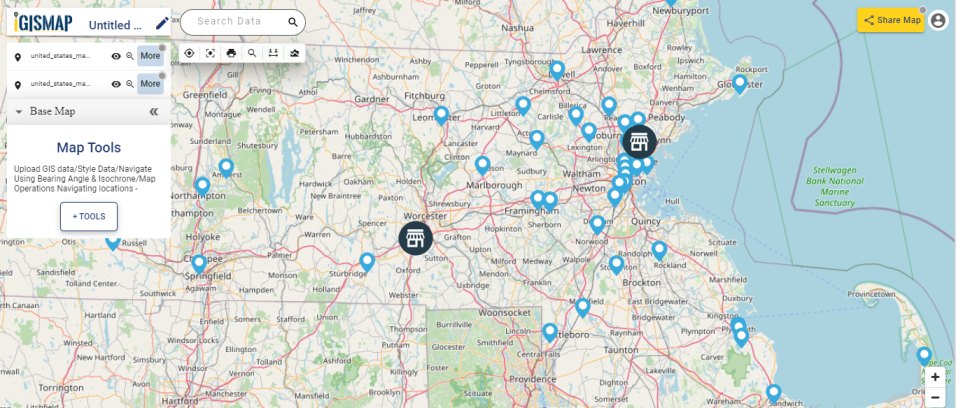
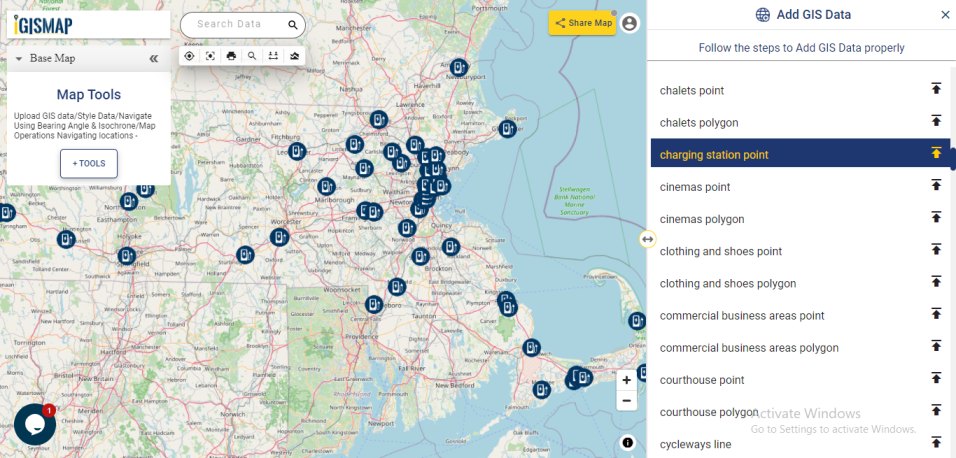
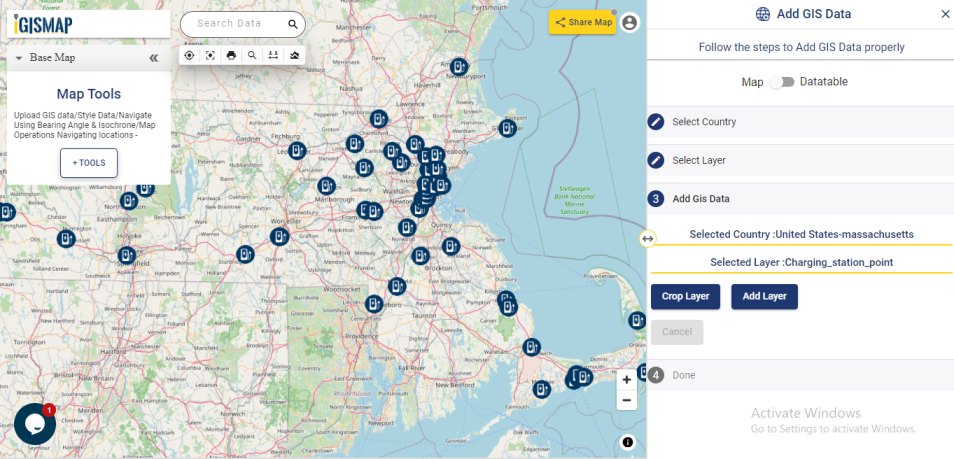
A GIS layer gets published after submitting, with point locations based on the address information from the input spreadsheet file. Result section also opens with datatable and Relevance_score column.
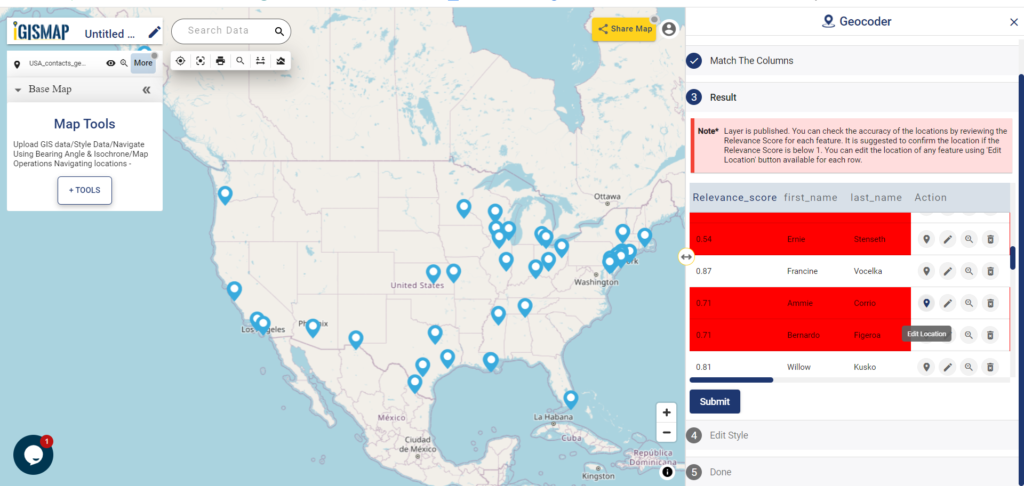
Relevance_score is a value ranging between 0 to 10 provided for every row depicting the accuracy of the plotted locations after the geocoding each address, where 10 being the highest accuracy. User can check the relevance score for each row and edit the point location if needed. Rows of the point features will be highlighted in red color if the relevance score is below 8. This is to notify the user to confirm the location plotted.
How to edit location by checking relevance score
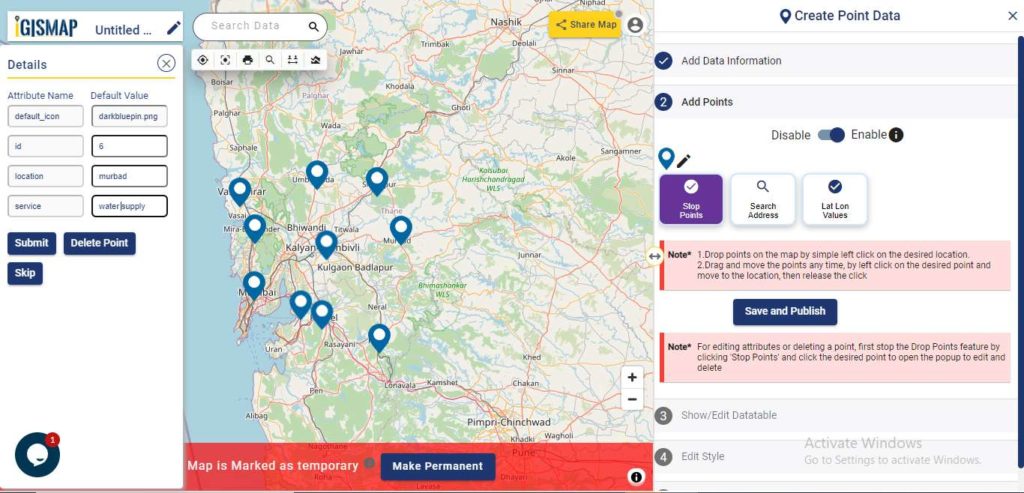
The user can delete any feature by using the Delete Feature button present on the Relevance_score table. Click Edit Attribute button of any required feature to start editing the attribute values of that feature and then click Save icon.
The user can edit the location of any point feature by using the Edit Location button. After clicking the Edit Location button in the row of any point feature, a pop-up menu with the options to edit the location.
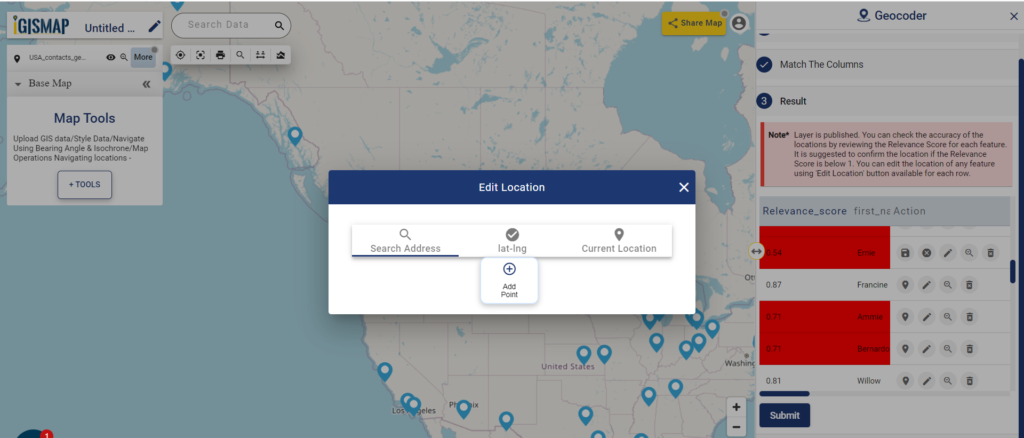
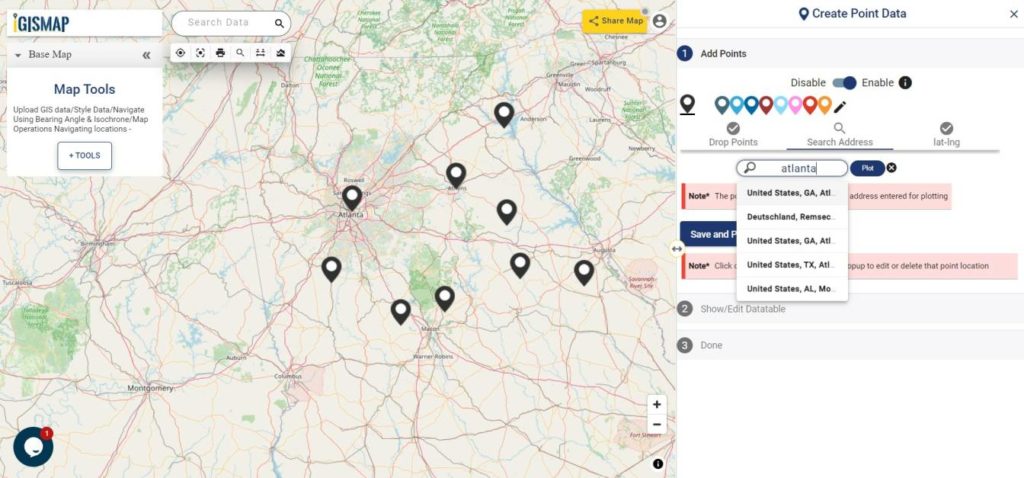
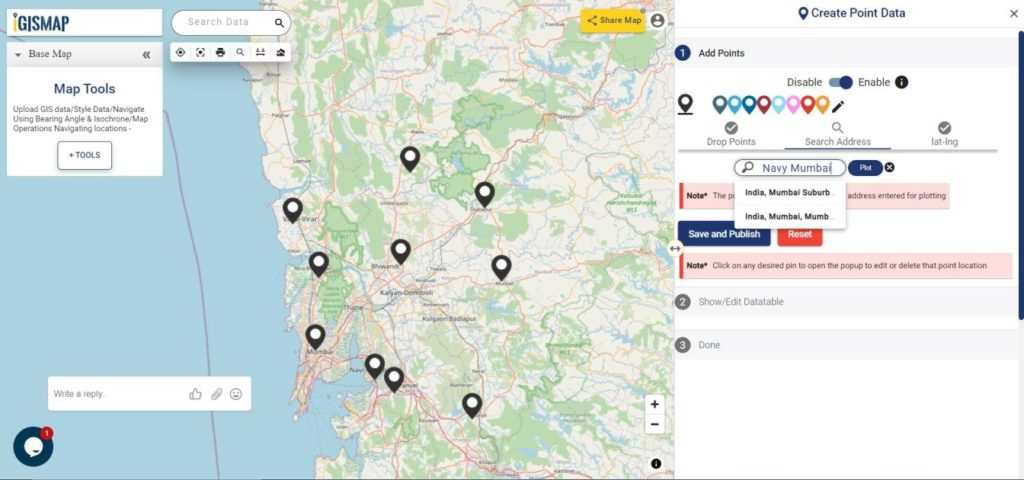
- Search Address – Enter an appropriate address to replace the pin to that location
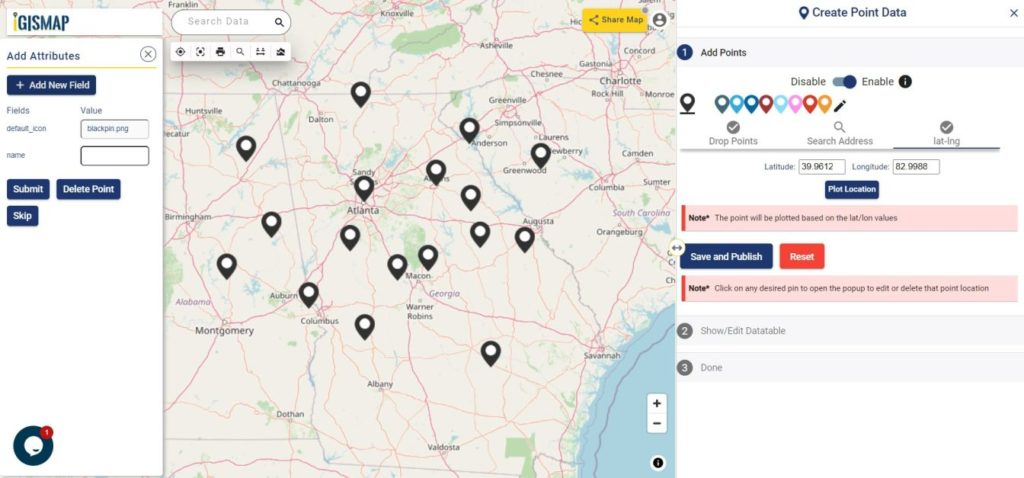
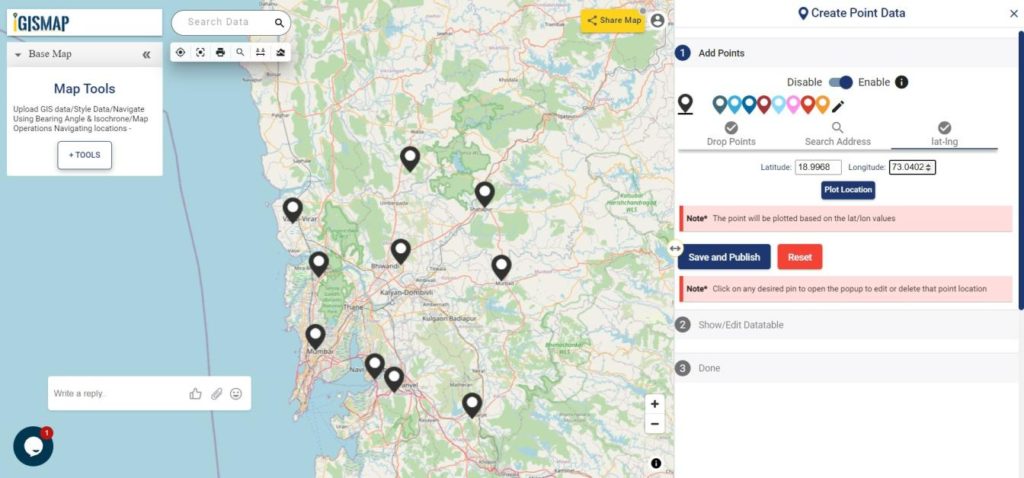
- lat-lng – Enter latitude/longitude values to replace the pin to that coordinate
- Current Location – To replace the pin to your current location
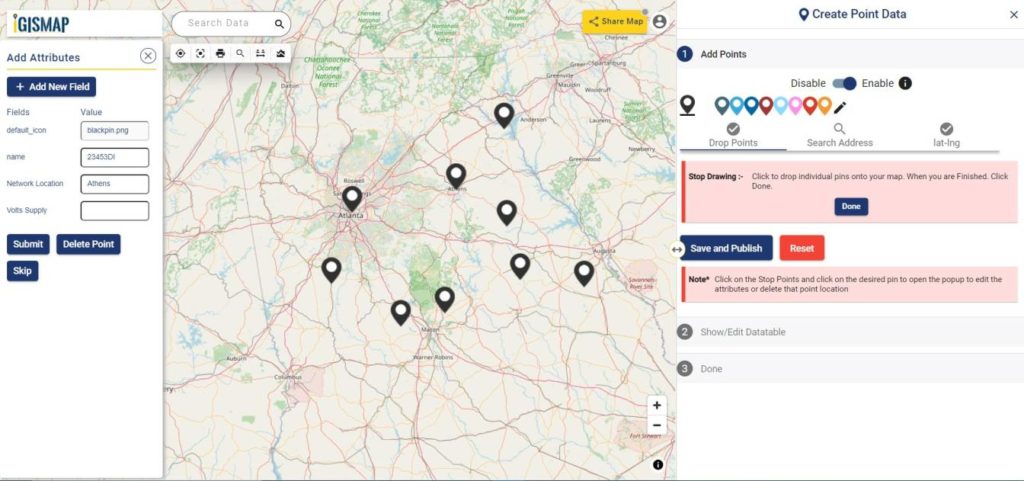
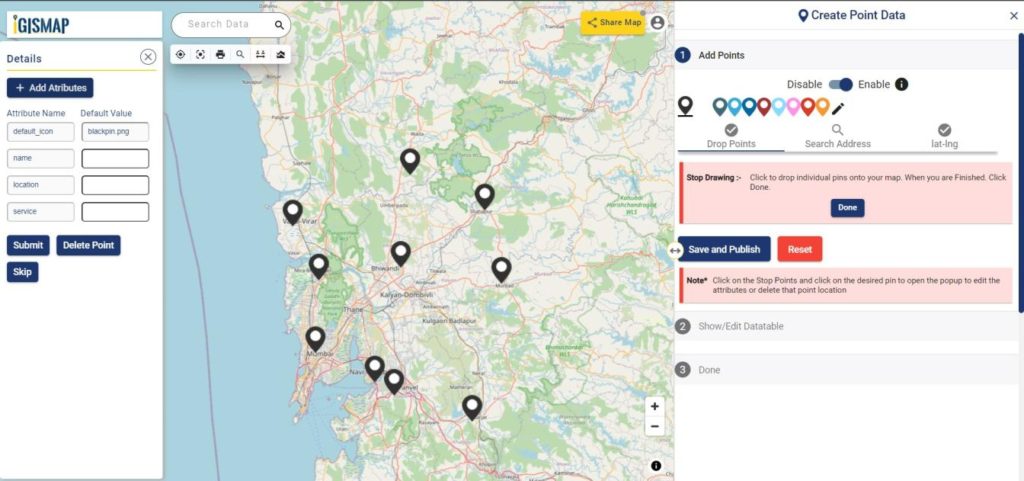
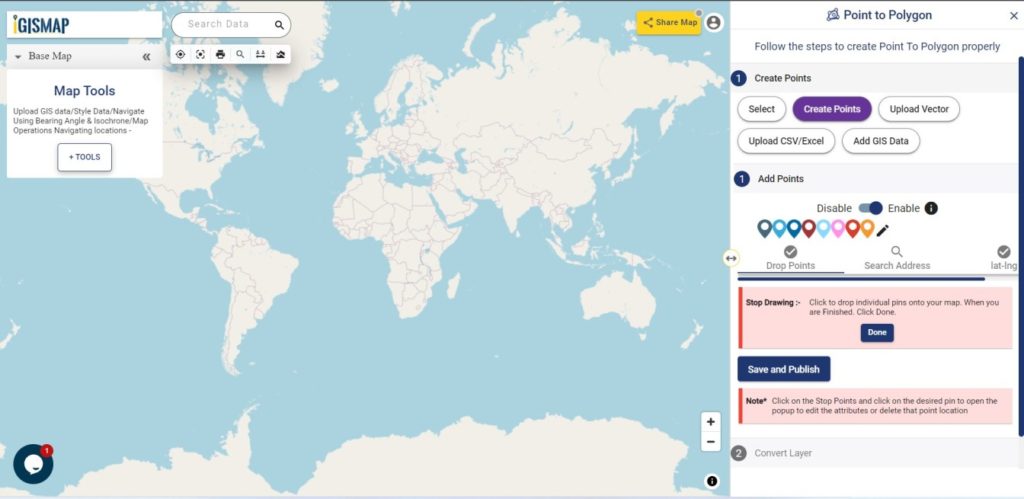
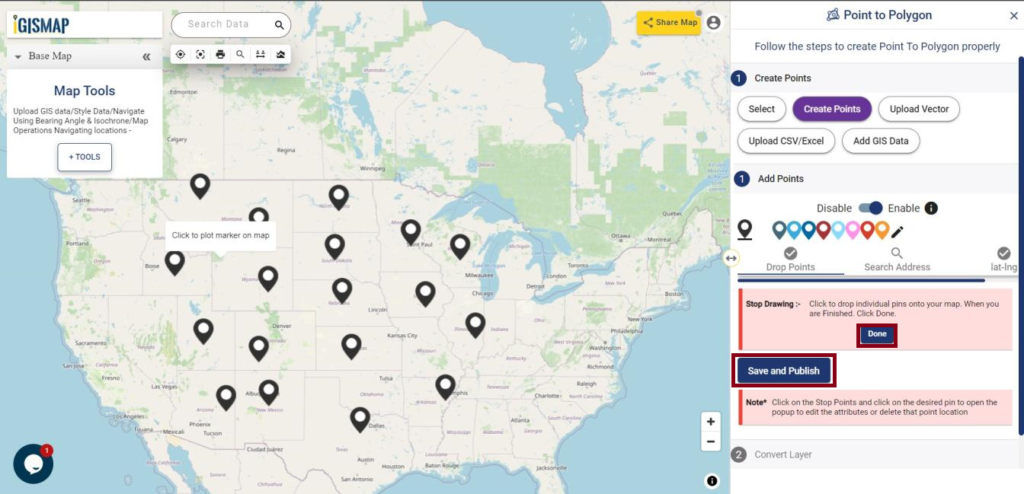
- Add Point – Manually plot a point on the base map
Now click Submit button to save the changes in the point GIS data
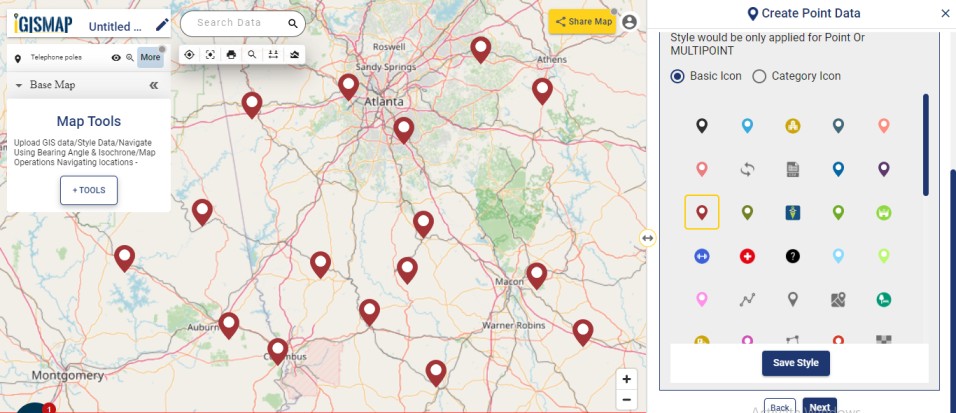
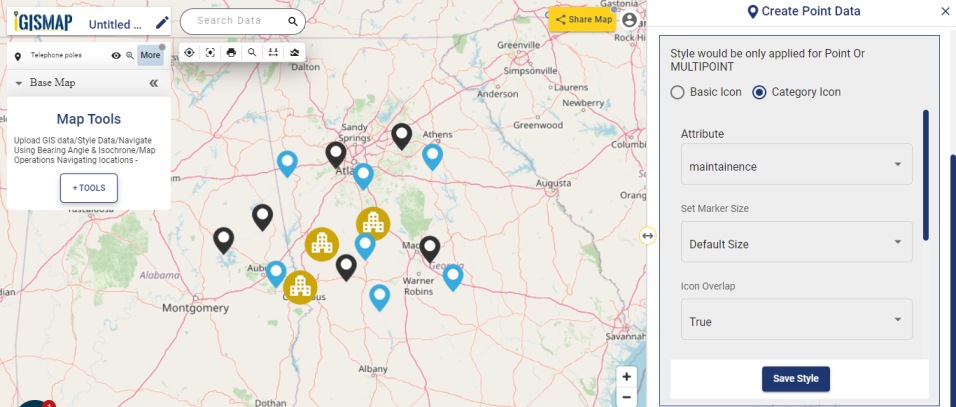
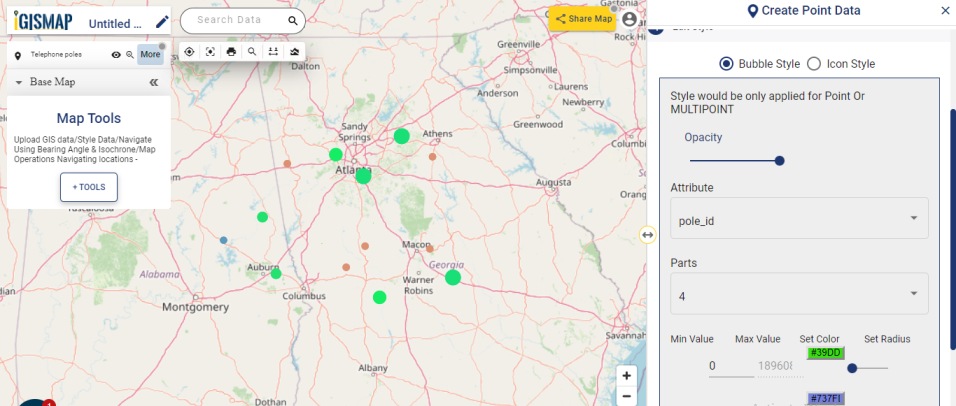
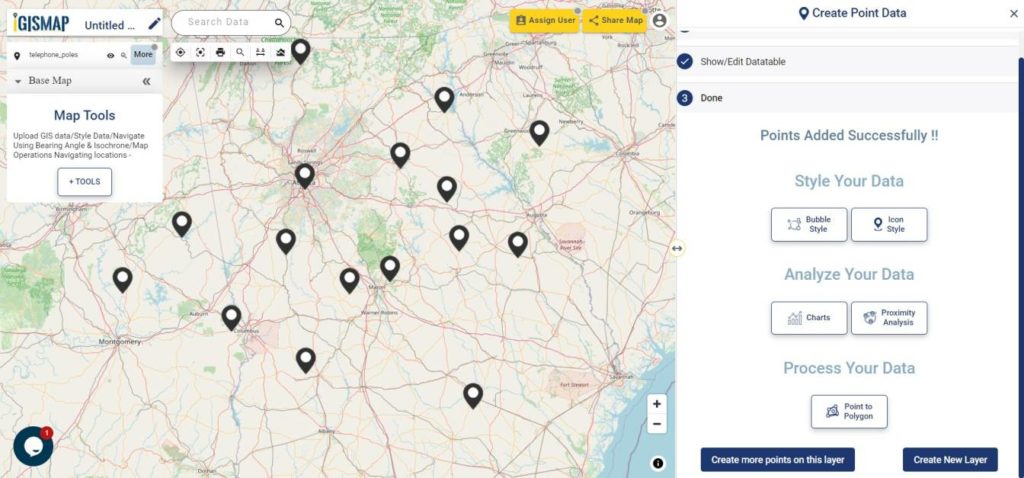
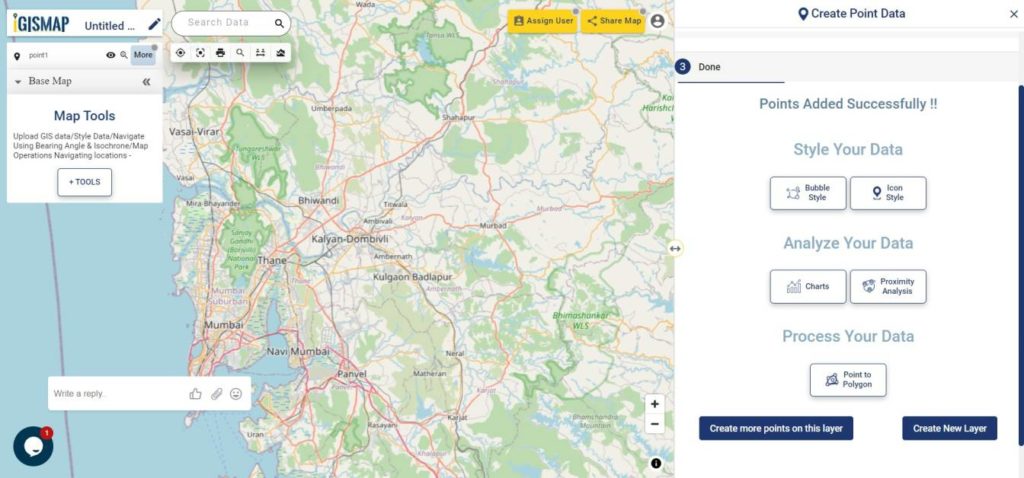
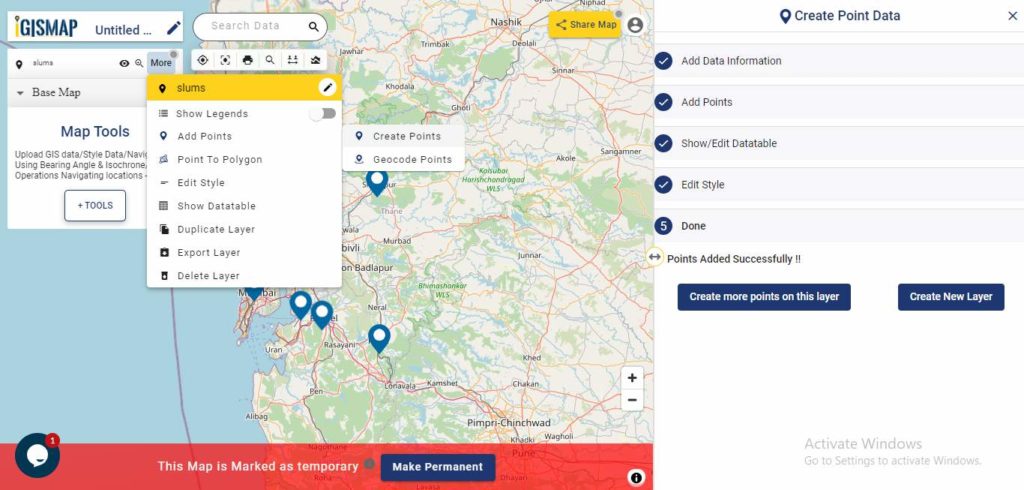
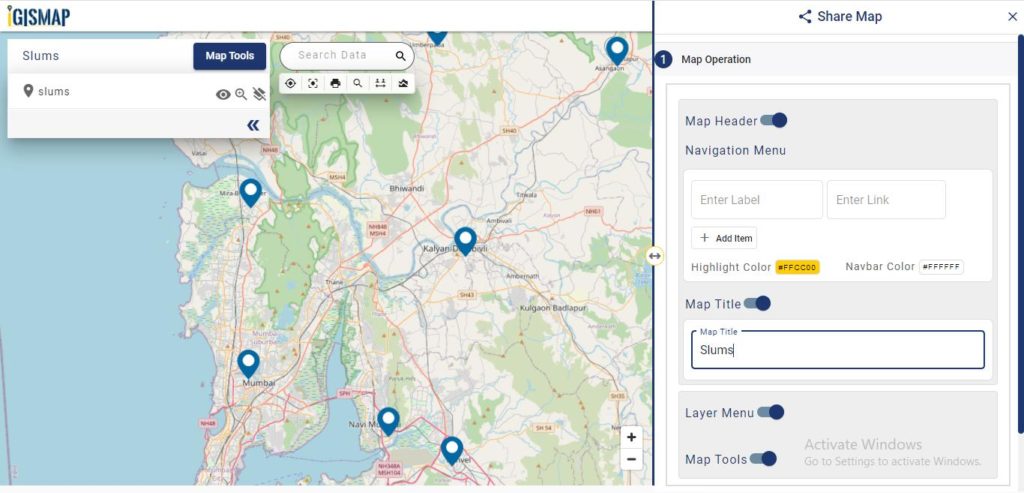
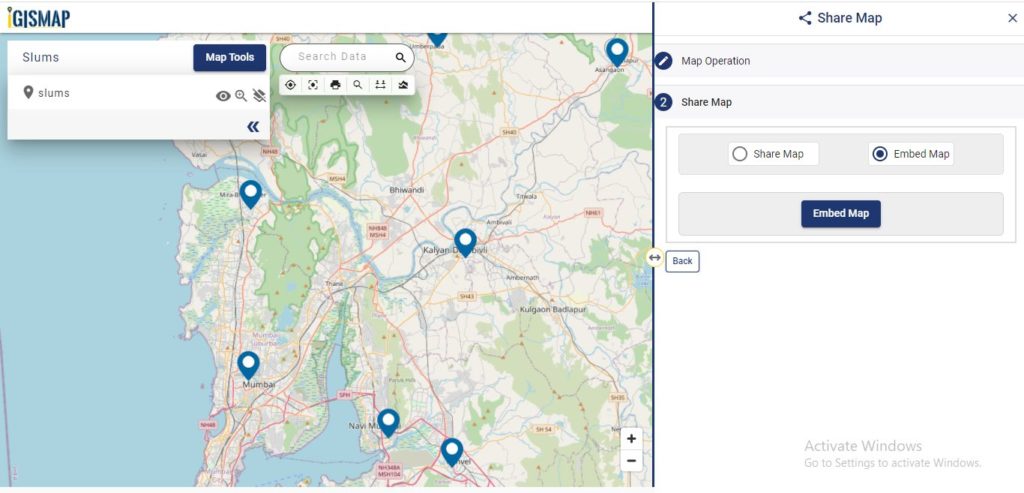
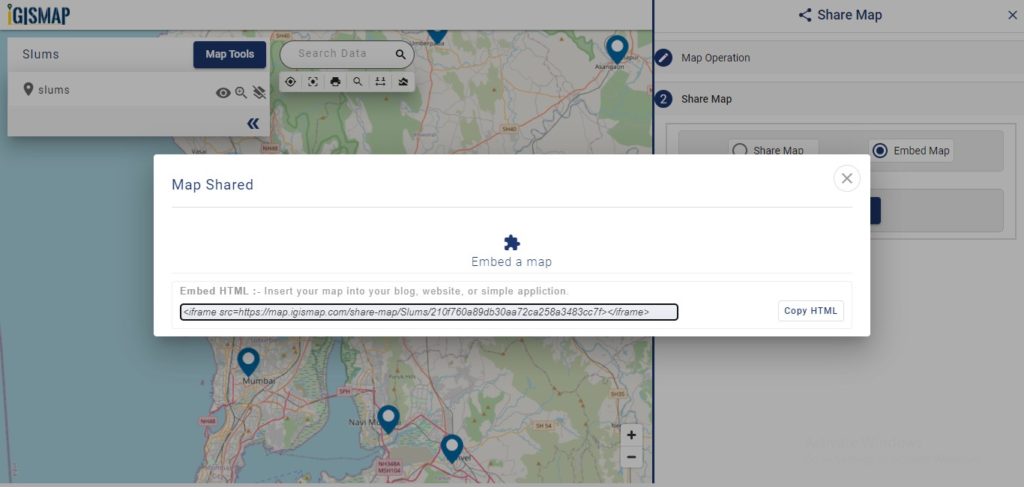
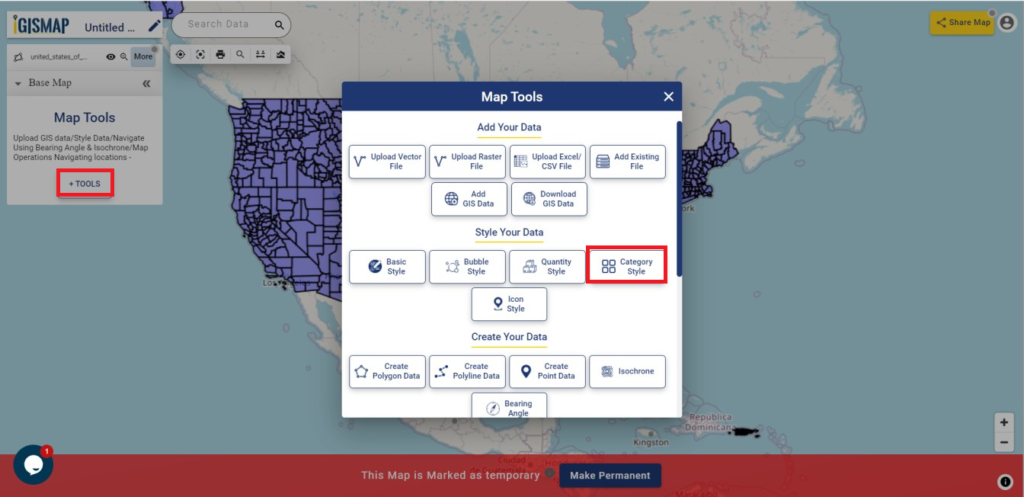
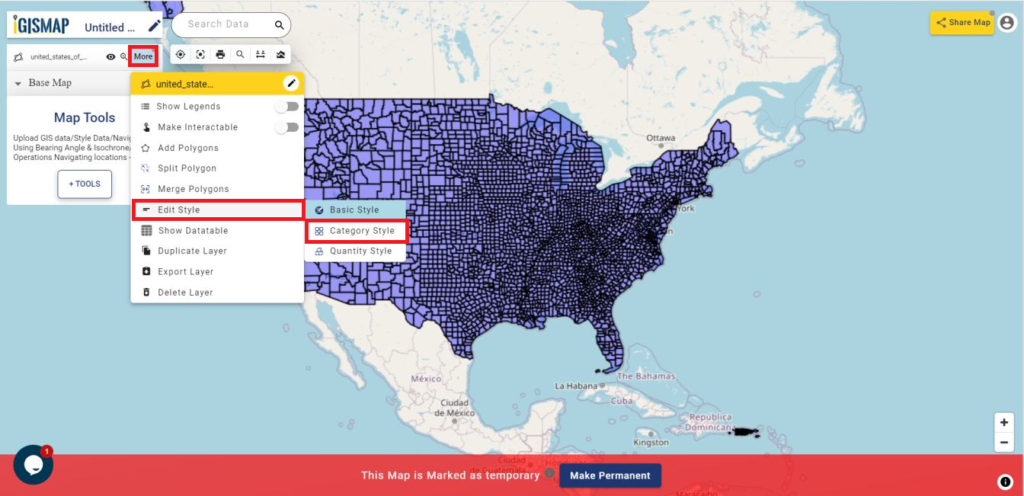
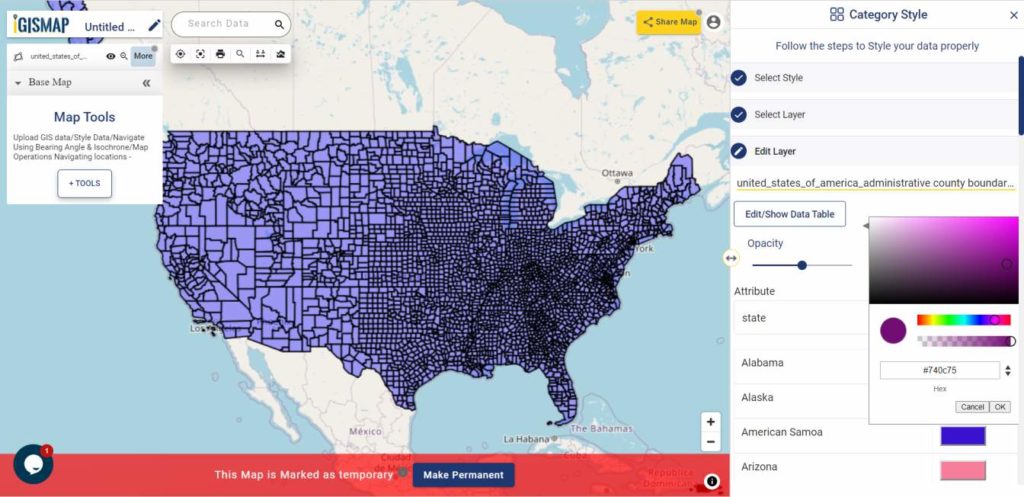
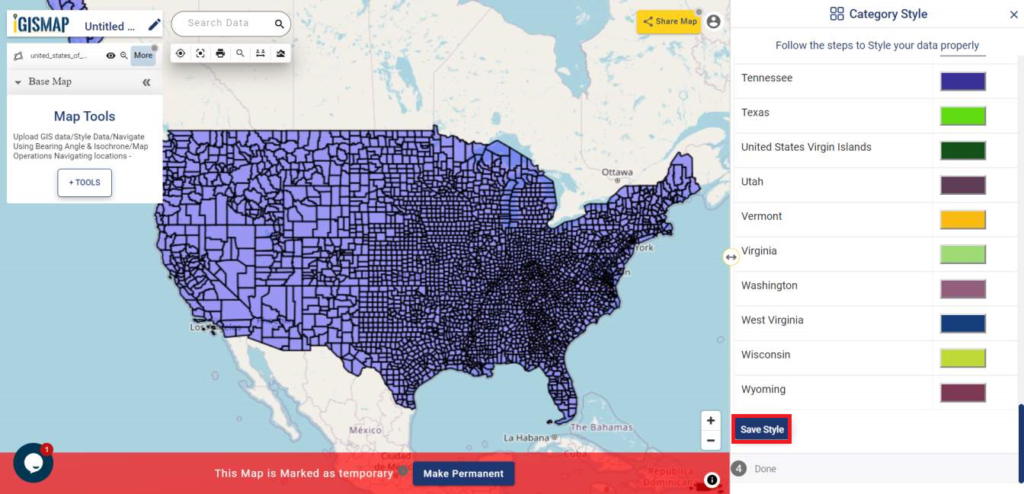
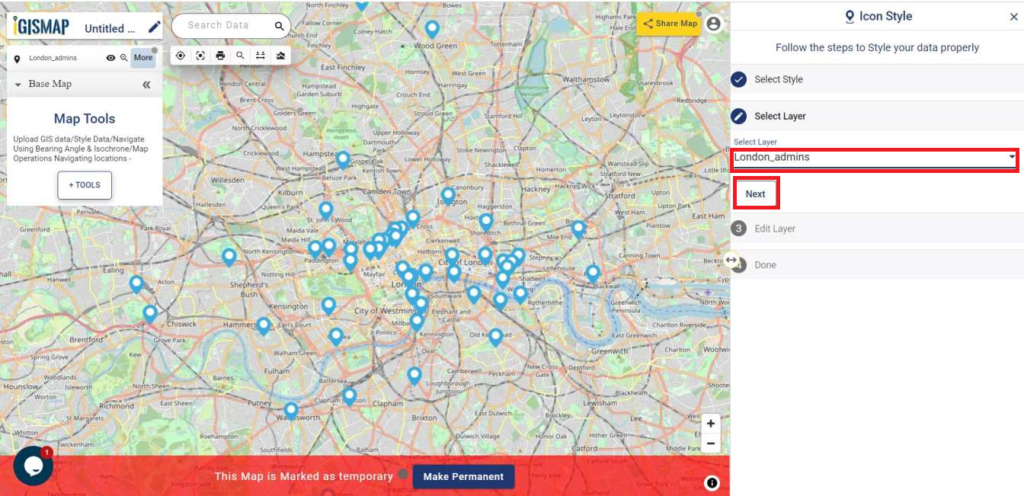
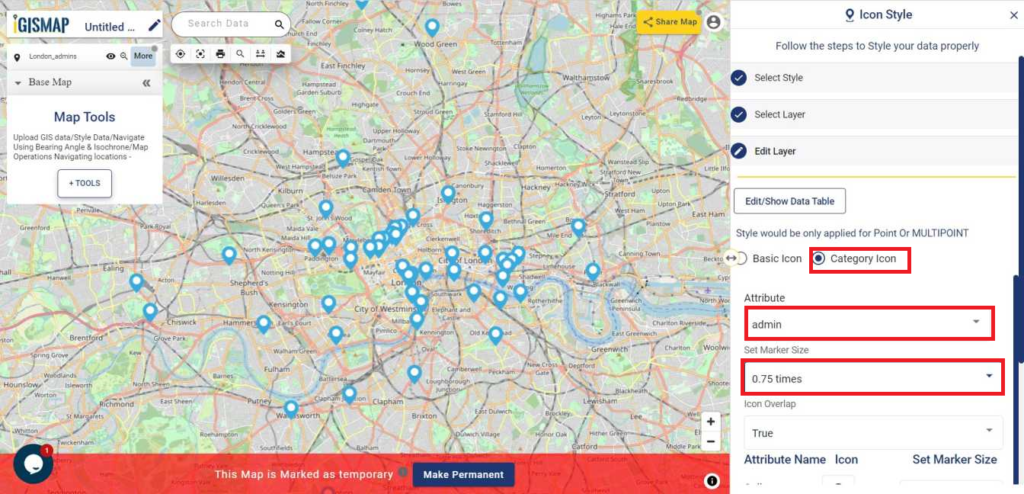
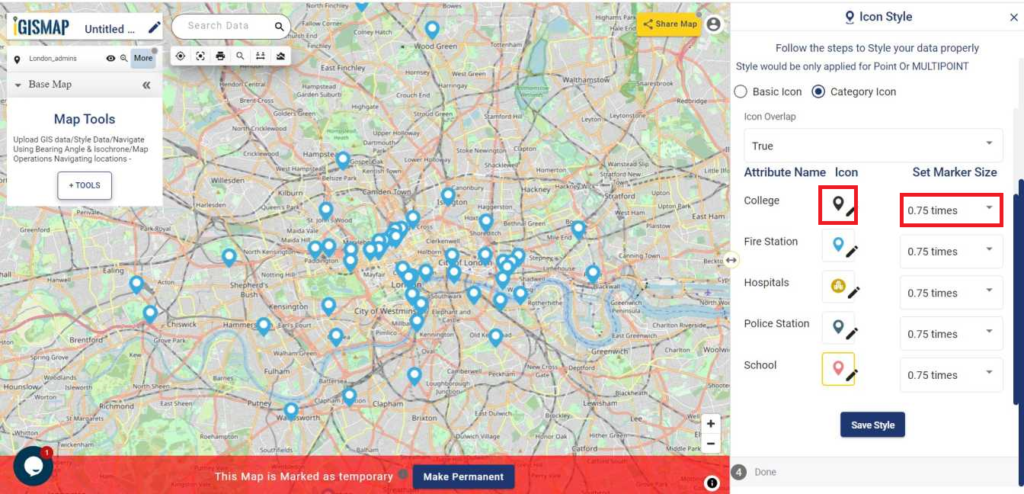
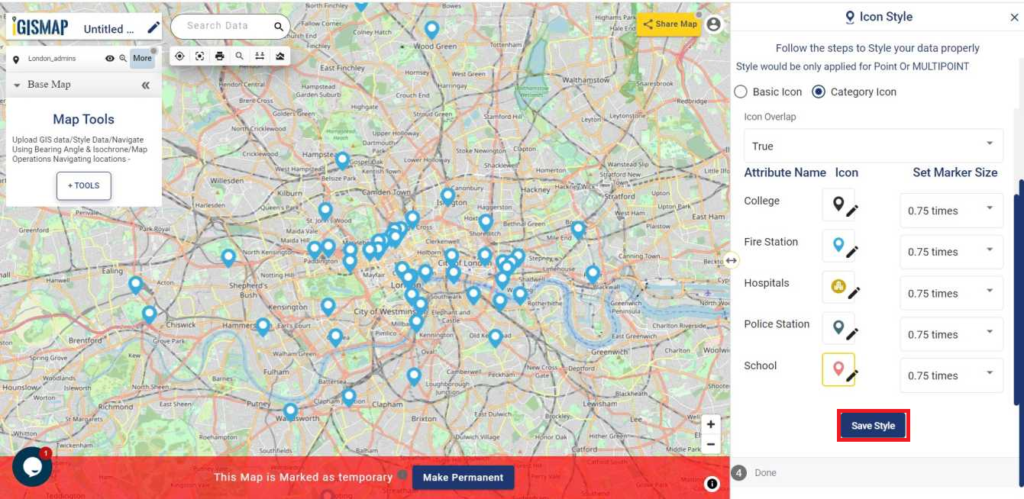
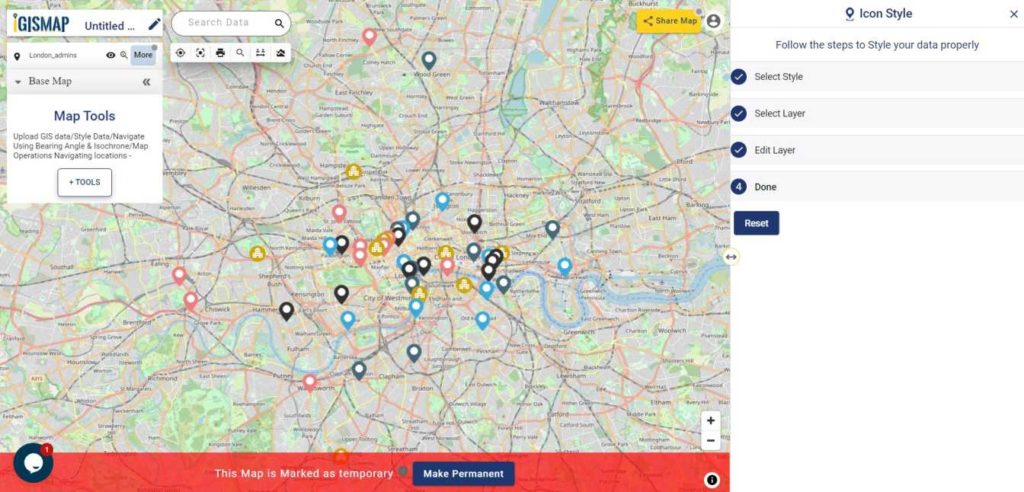
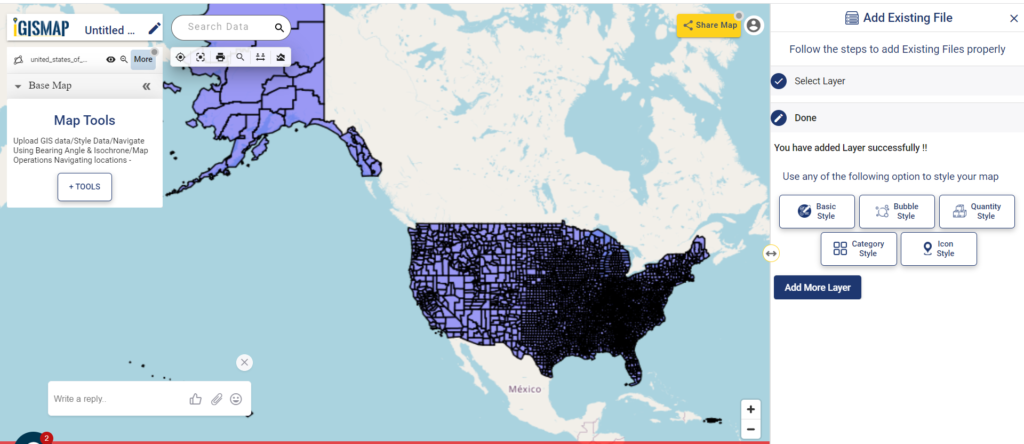
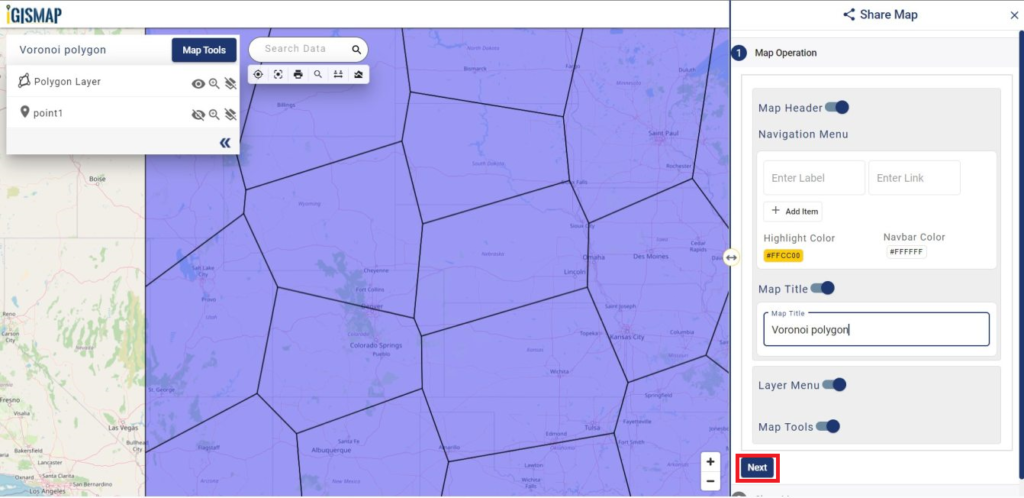
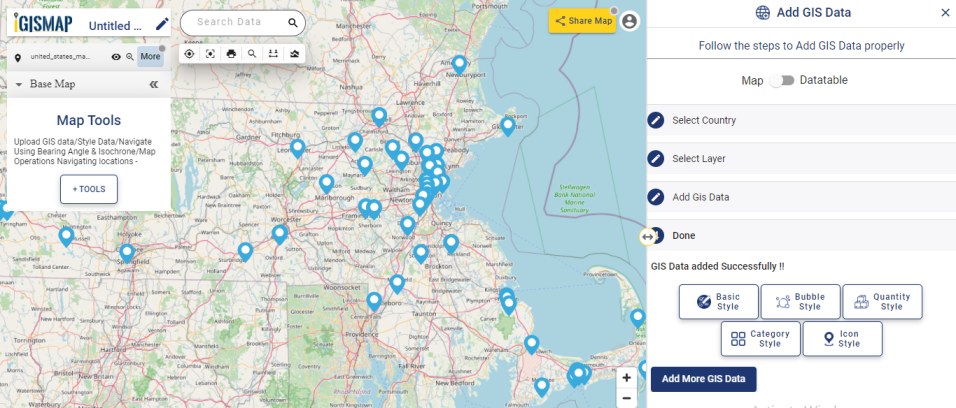
User can further edit the style of the points or share the map publicly or privately

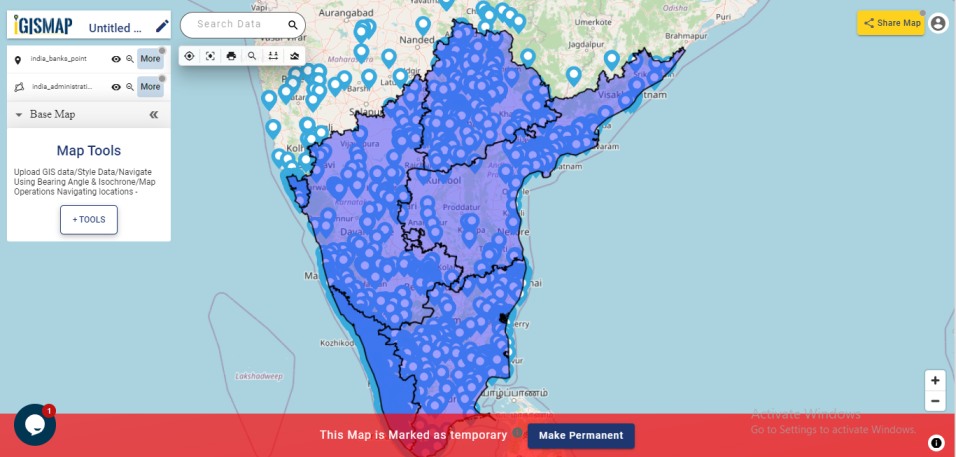
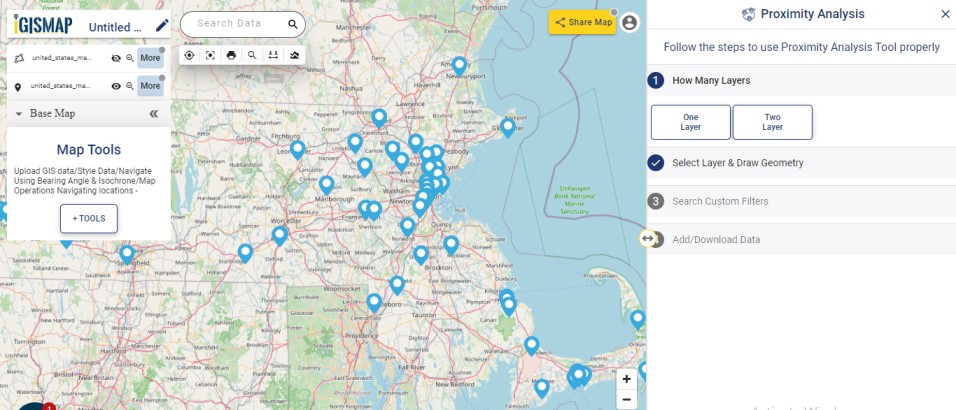
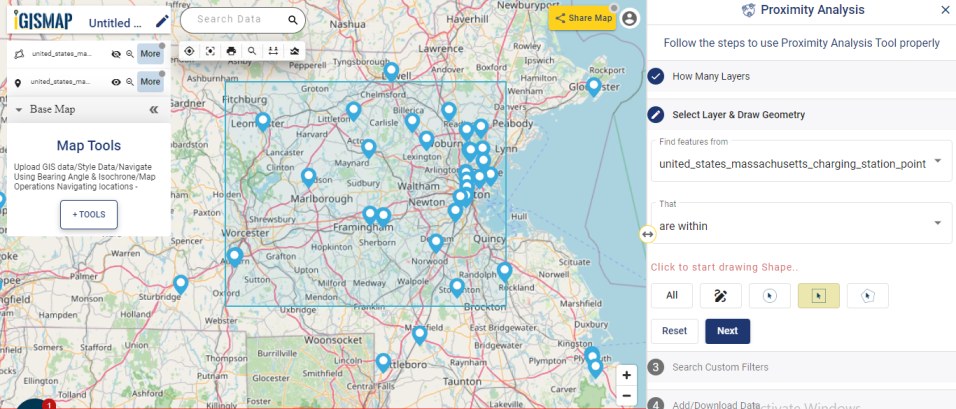
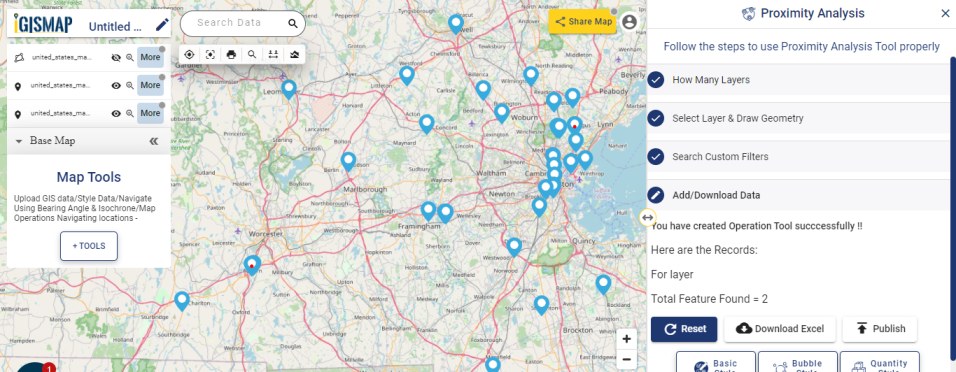
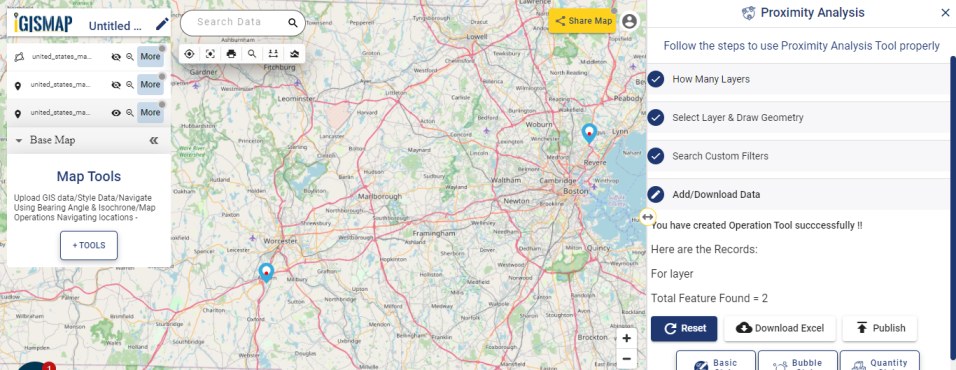
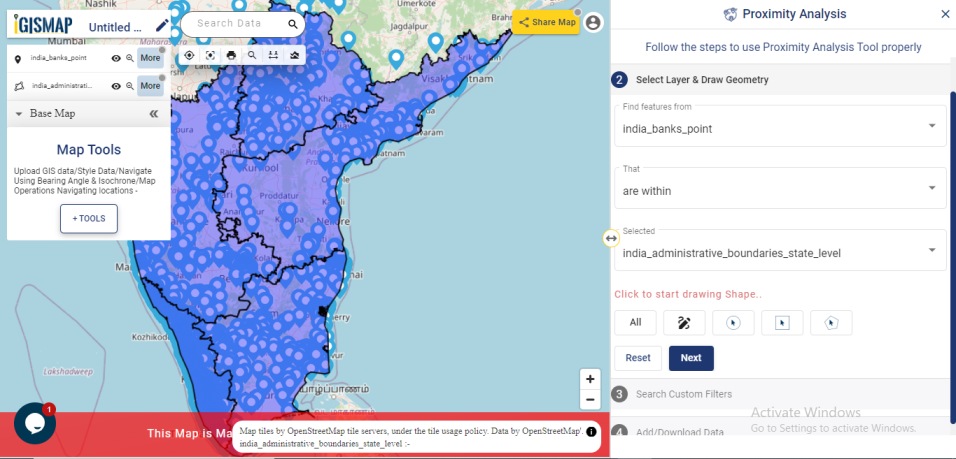
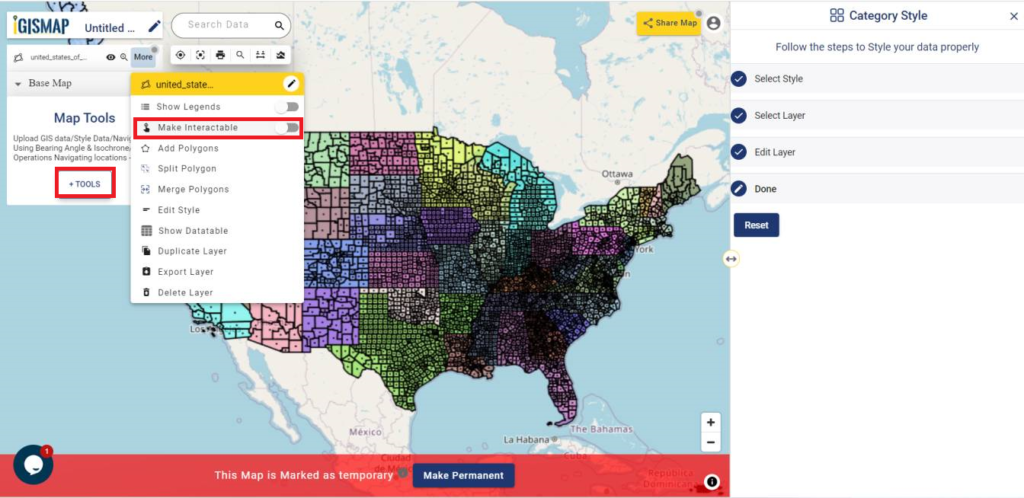
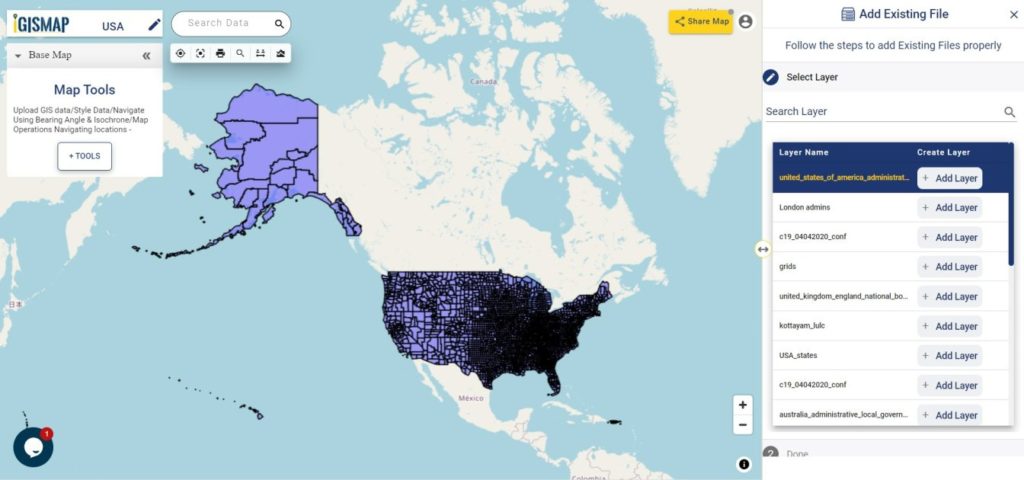
 from Map Tools to get the list of IGISMap tools from which you need to select Proximity Analysis tool.
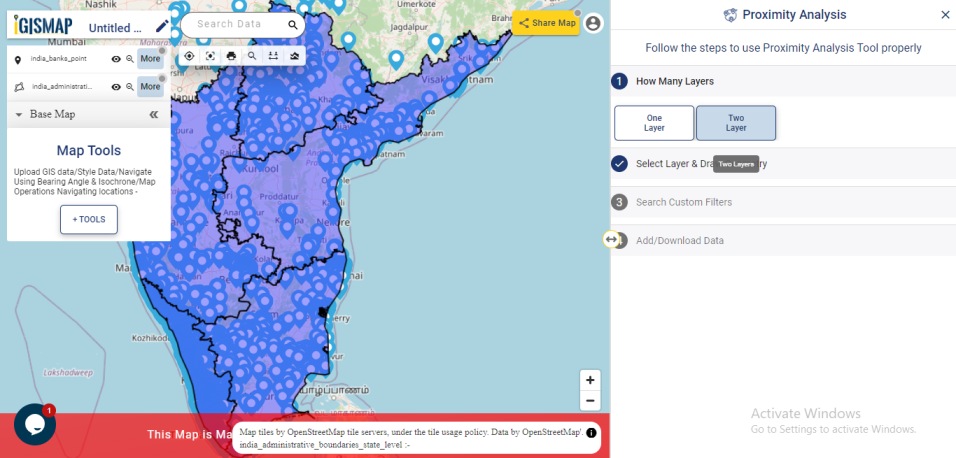
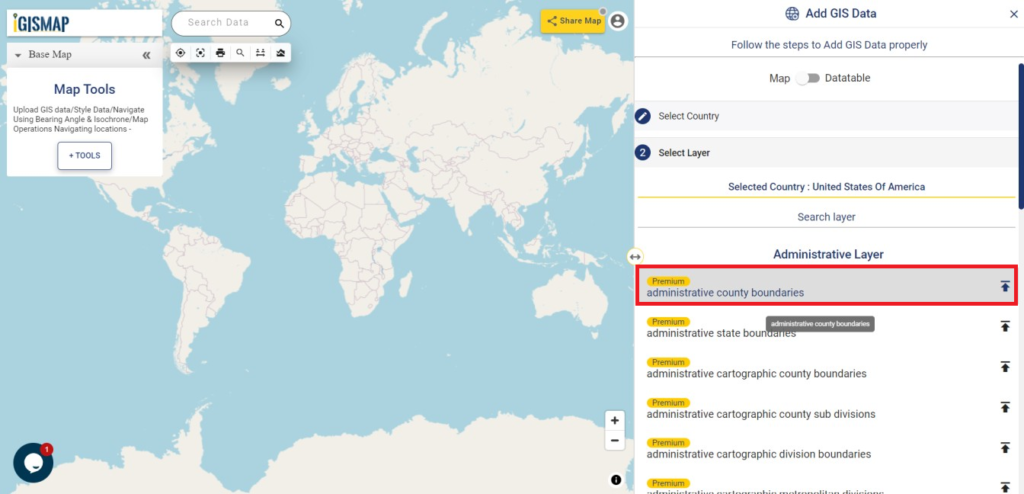
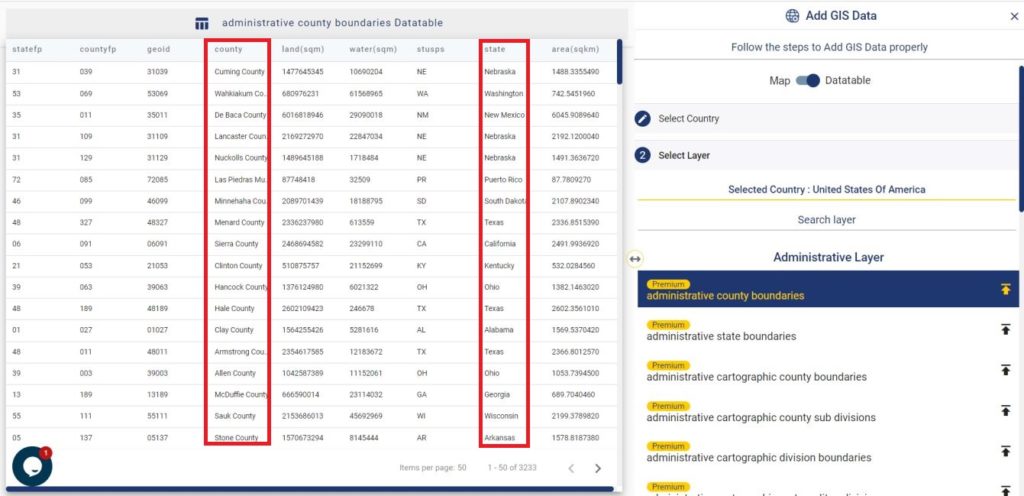
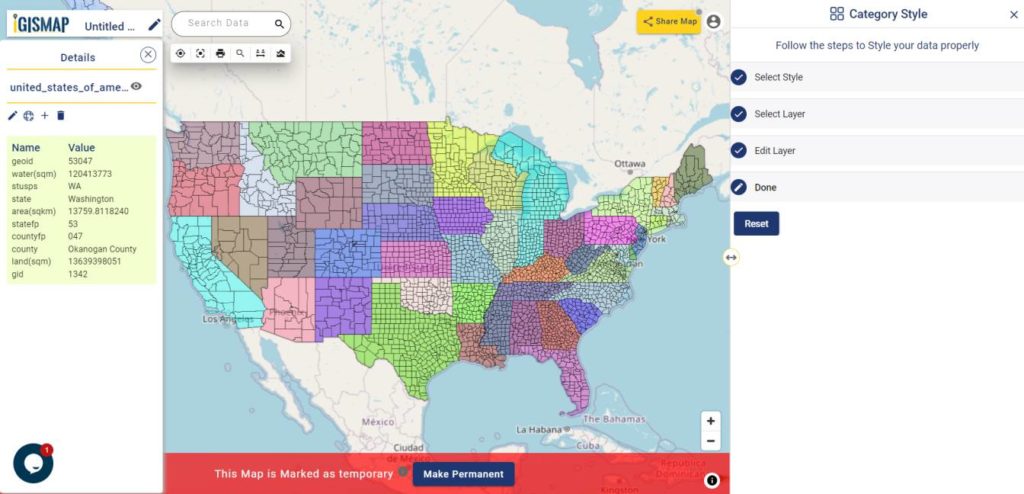
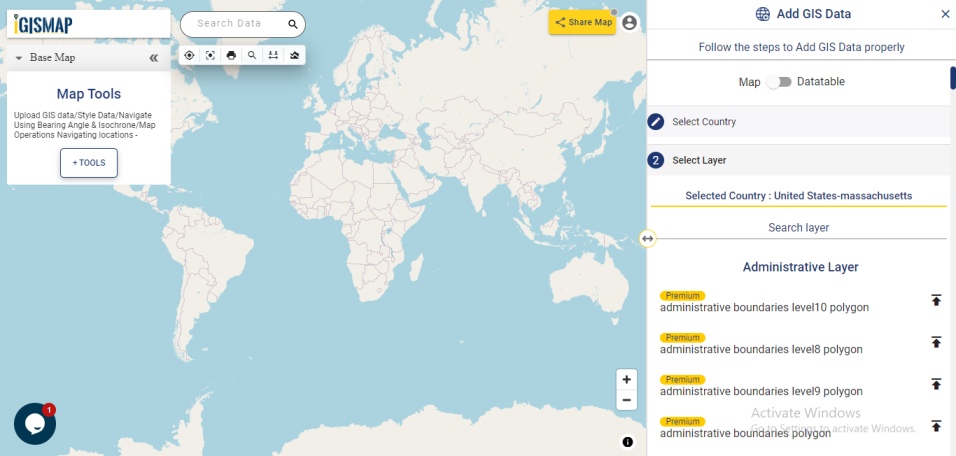
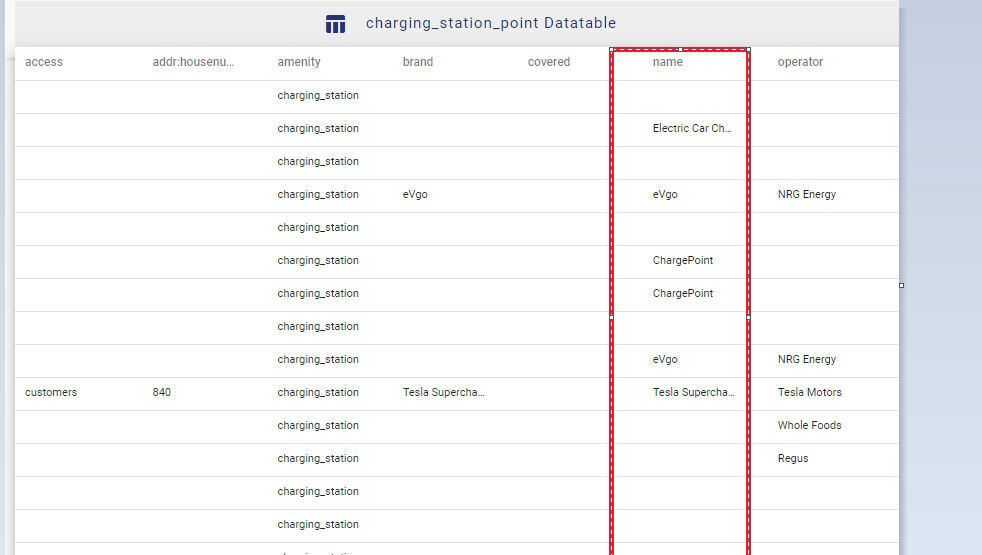
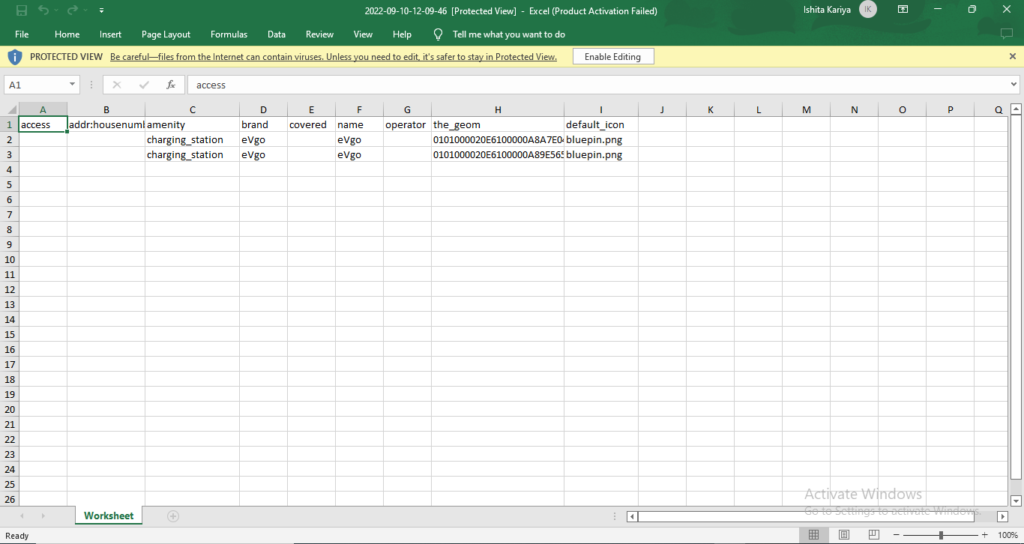
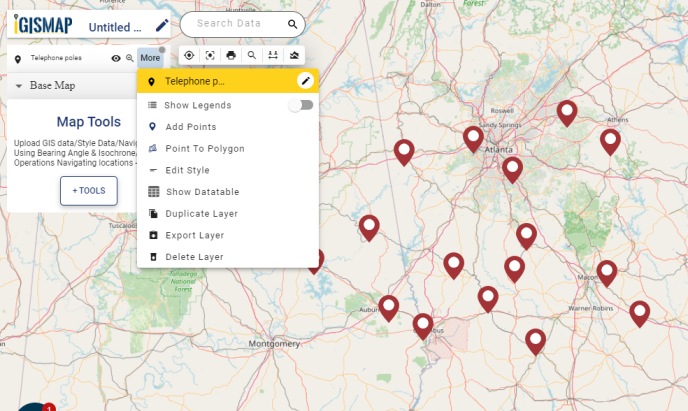
 can be used to switch the view from Map to Datatable. If the information about the datatable present in the add layer can be viewed by the user by switching the mode towards the datatable option.
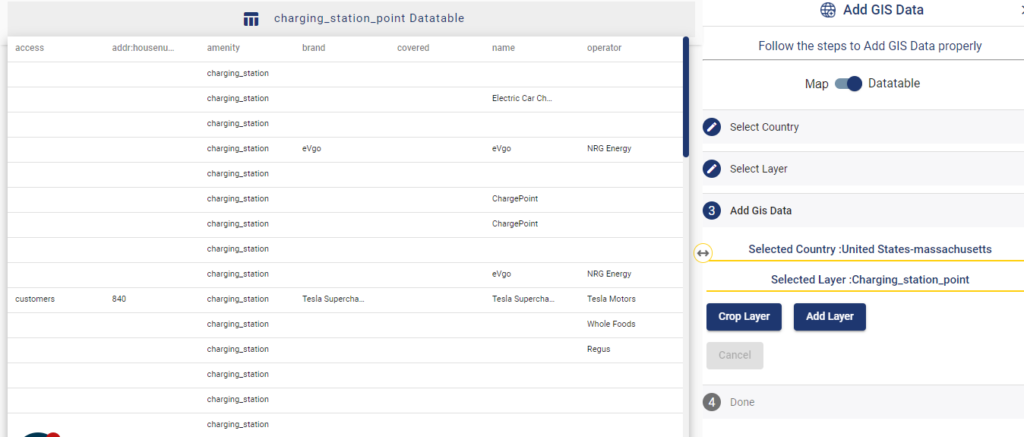
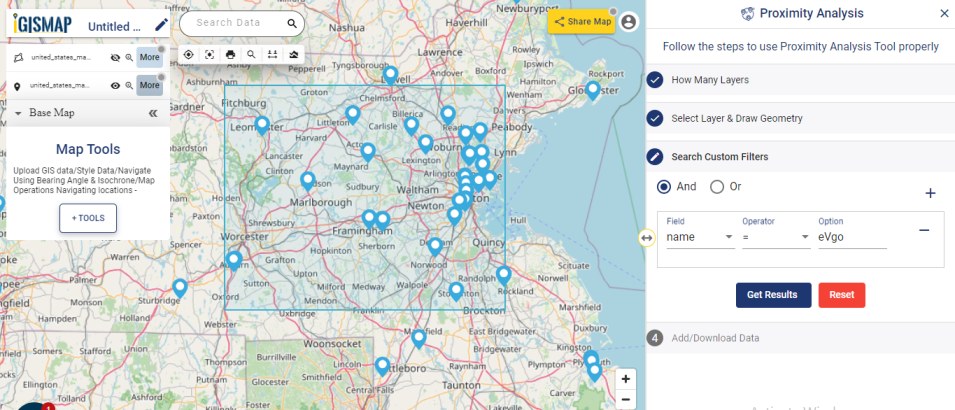
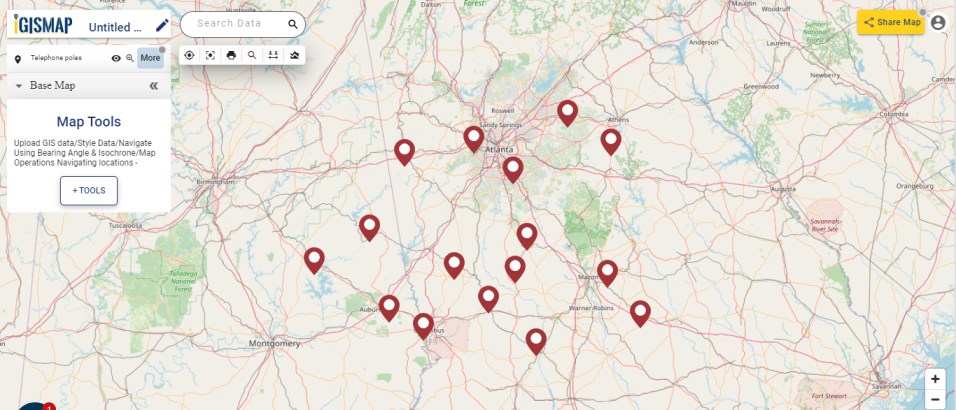
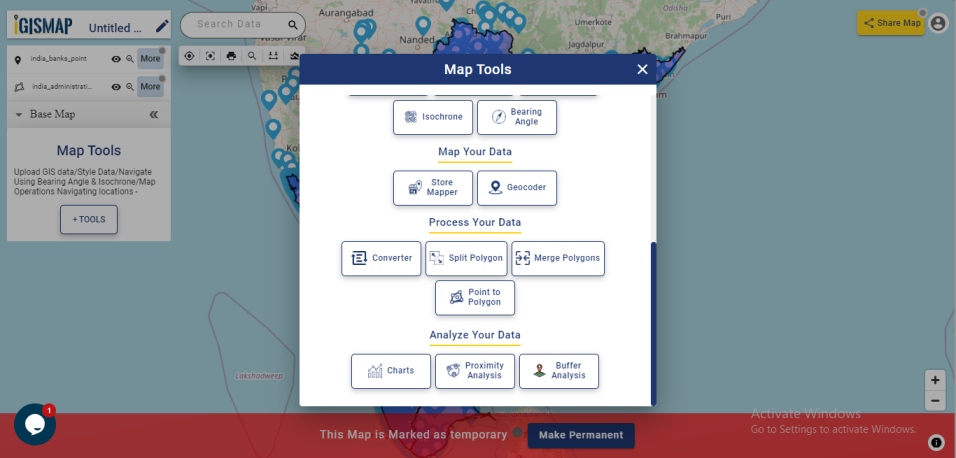
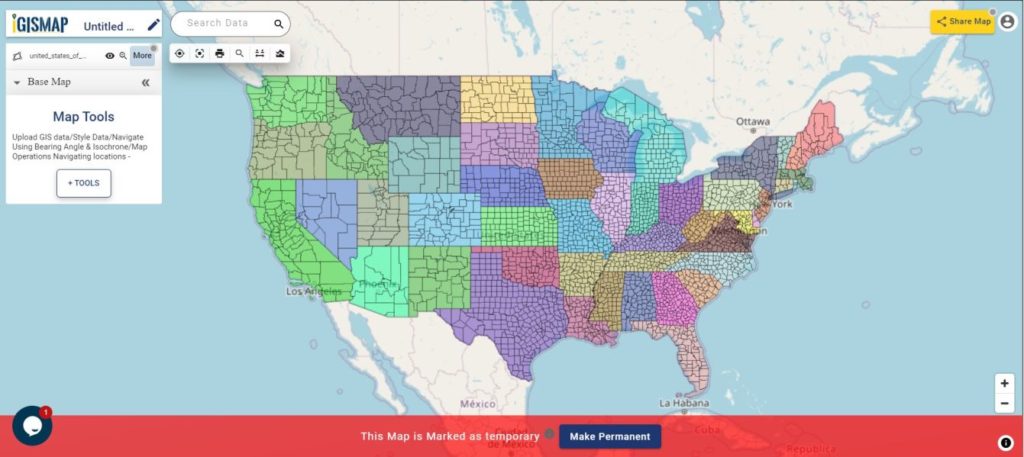
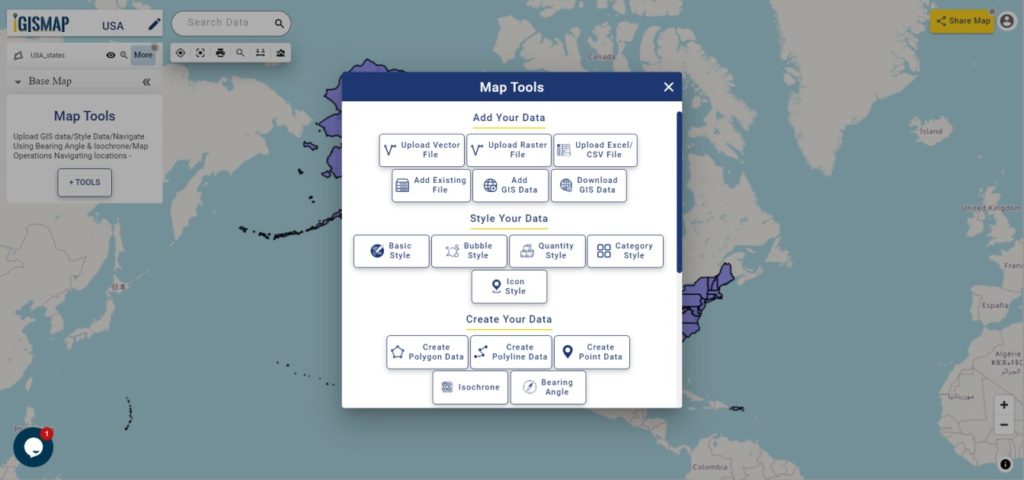
 from Map Tools, you can observe a lot of options to map, process, visualize and analyze your GIS data. Under Analyze Your Data title, select Proximity Analysis tool.