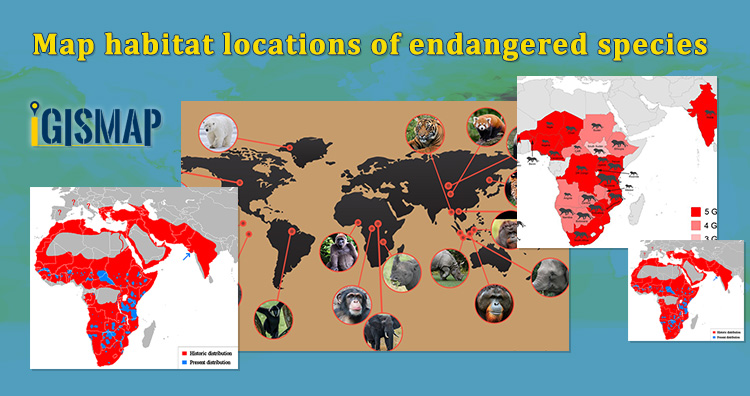
Map habitat locations of endangered animals & keep track of their living

Wilderness without wildlife is just scenery
-Lois Crisler

The International Union for Conservation of Nature (IUCN) states that endangered species are the species of plant or animal that are seriously at the risk of extinction. In this time of data revolution, data analytics plays a huge role in the field of environmental science and atmospheric studies. Keeping the record of the habitat locations of endangered species and observing the variations in their environmental factors will help the authorities to study the causes that threaten the life of these species. These observations can be further useful to prevent global extinction by rehabilitating their populations and restoring habitats. In the article we create point vector data in GIS tool.

GIS technology is an effective tool for managing, analyzing, and visualizing wildlife data to target areas where monitoring and managing is required. GIS technology helps in tracking the migration patterns, mapping biodiversity, and habitat suitability models which provide analysis for animals to locate their habitat locations in suitable environmental conditions. 

Consider that a wildlife conservationist wants to map the habitat locations of endangered animals in India and keep track of the factors such as total strength, temperature, precipitation, food, water, etc. There are a lot of GIS applications available, but only IGISMap meets the requirements creating a map and hosting the map. Create Point Data tool of IGISMap can be used to plot locations and point objects as a point vector data model.

Map habitat locations of endangered species

Users can rely on the Create Point Data tool of IGISMap application to plot the habitat locations of endangered animals as given below.
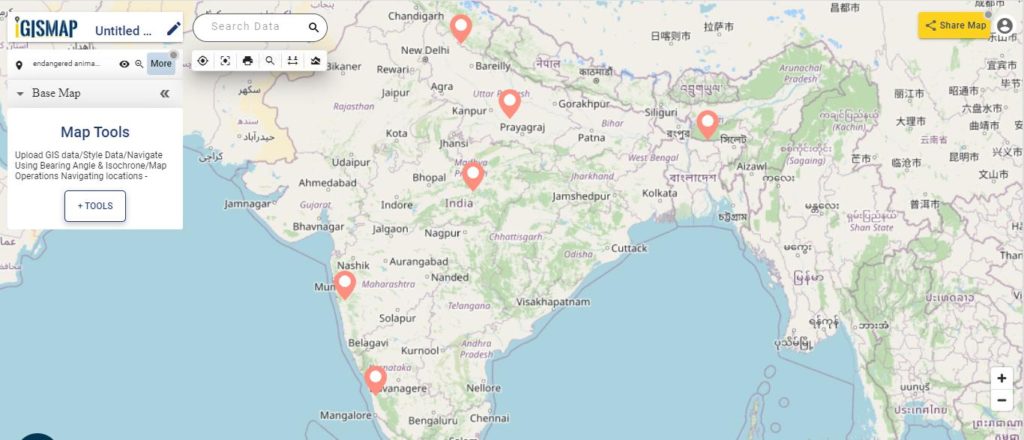
Final Map of Habitat Locations - Create Point Vector Data
Final Map of Habitat Locations

GIS data created in IGISMap can be shared via links or embed in websites. More information based on these locations can be added as attributes in the datatable. Attribute information in the datatable can be queried using the Proximity Analysis tool of IGISMap. Let’s look into the steps on how the habitat location map can be created and further used for the protection of endangered animals.

To navigate to the IGISMap Create Point Data tool, click the below link

https://map.igismap.com/add-points

Adding the points of habitat locations of endangered animals

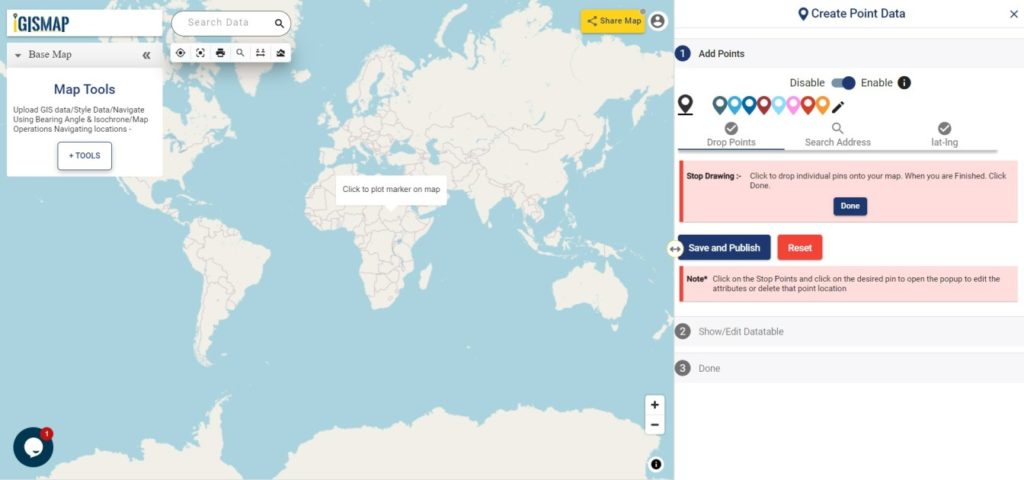
First step is to Add Points, where we can start plotting the habitat locations as points, in the form of pins. IGISMap provides you with three features for plotting points: Drop Points, Search Address, and Lat Lon Values.
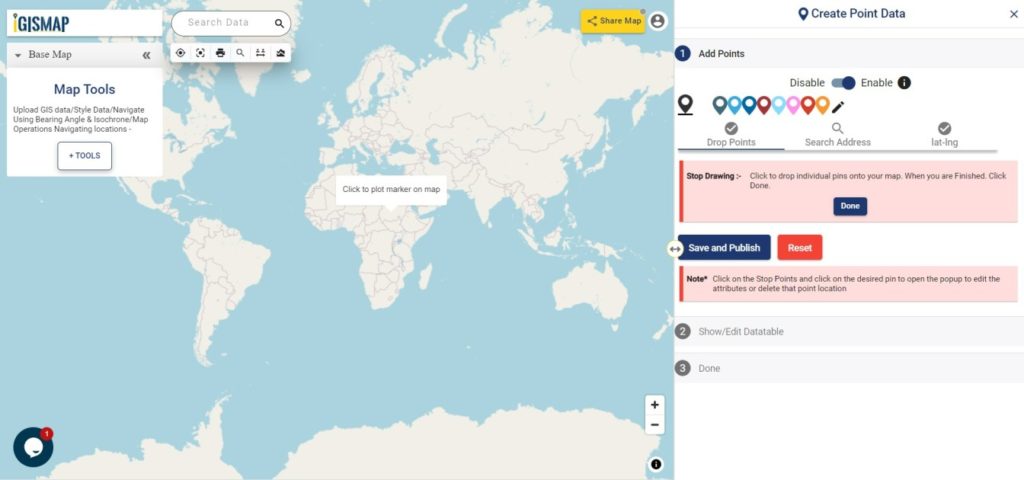
plot endangered animals locations on the map
Create Point Data tool
  • Let’s select the Drop Points option and zoom to the location with the desired location to plot a pin in that specific location on the map
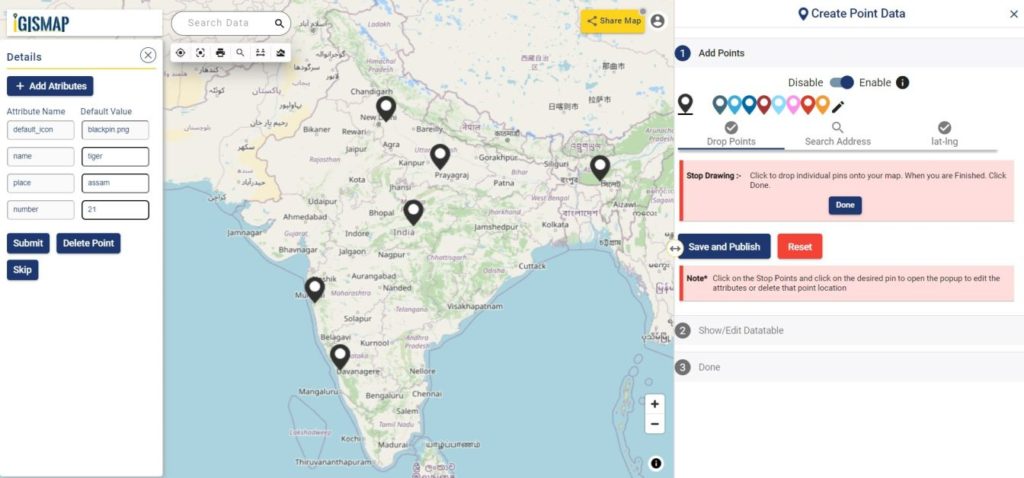
Drop Points
Drop Points

Everytime when a point gets plotted, a popup will open to enter the attribute values in each attribute field of the habitat locations. Click the Submit button to Submit and save the attribute entries. You can choose to delete the point you plotted by clicking the Delete Point button. Else you can click Skip to close the popup. You can disable the default opening of this popup using the toggle button.

  • Search Address option opens a search address box, where you can enter an address and choose the right option from the dropdown list, then click the Plot button to plot a point on that location.
  • Lat Lon Values will open two boxes to enter latitude and longitude values of the location you want to plot, Plot Location button in this option will plot a pin at the location you have entered.

A plotted point can be moved to a different location by click and drag to the desired location

Note: If the Drop Points option is active for dropping pins, it should be unselected for selecting the plotted pins to open the attribute popup.

After making all the changes, click on the Save and Publish button to publish the GIS data of habitat locations.

Review and Edit the Datatable of the Data

Save and Publish button will publish the point location of endangered animals as point GIS data layer. The default name of the published layer will be point1 that can be edited any time. Show/Edit Datatable section will also open, where attribute fields and attribute values of each location can be edited, updated or deleted.

Option to update the data table as bulk is available in this section. Here the whole datatable can be downloaded in Excel format using Download Datatable button. And to make the changes outside IGISMap, then upload the edited/updated spreadsheet file using Upload Datatable button. Further, integrate with the same point data of habitat locations.
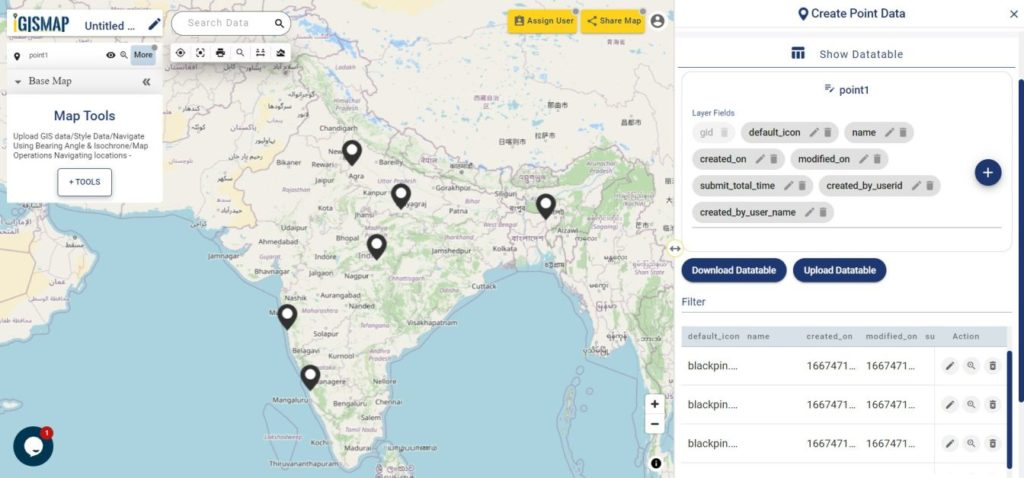
Show/Edit Datatable
Show/Edit Datatable

Here the Back button is present for going back to the Add Points section to add more points or click Next option to proceed further.

Styling The Habitat Location Points Of Endangered Species

A map will become more meaningful if appropriate icons and colors are used to visualize the features of the map. IGISMap provides – Bubble Style and Icon Style for point GIS data. Icon Styling has two more options – Basic Icon and Category Icon styling.

In basic styling, users can use different styling options for the pin. In Basic Icon styling, user can select any of the icons to represent the point locations.
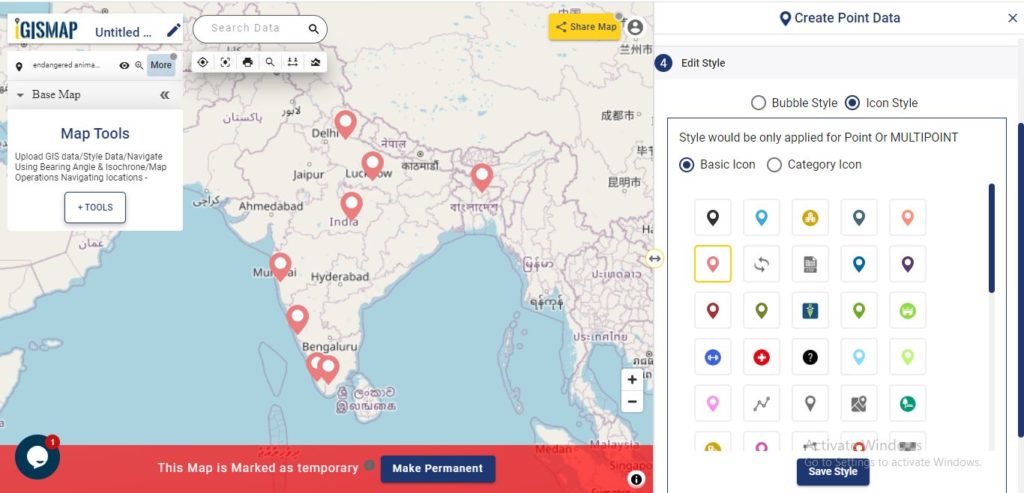
Basic Icon Styling
Basic Icon Styling

Check this article to understand How to style point GIS data categorically using Icon Style tool

Here we are going to style our data using Bubble Style. Bubble style is used to visualize the data quantitatively based on the numerical fields in the datatable. We can assign the size and color of the bubble for each class of values.
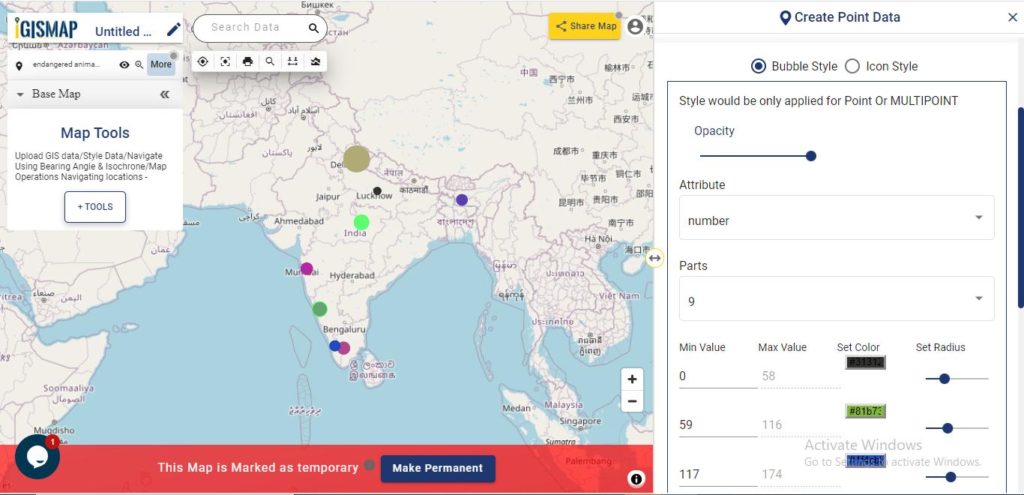
Bubble Styling
Bubble Styling

Check this article understand How to create Bubble Map for point GIS data

IGISMap provides direct access to Icon Style and Bubble Style tools from an existing map, where you can style point GIS data published in that map

It’s done! Now if the user wants to add more points, click on Create more points on the layer option. If the user wants to create a new layer, select Create New Layer option.

Add Points feature is available in the More section of the layer which will allow to add more points and attribute informations to the data you created.
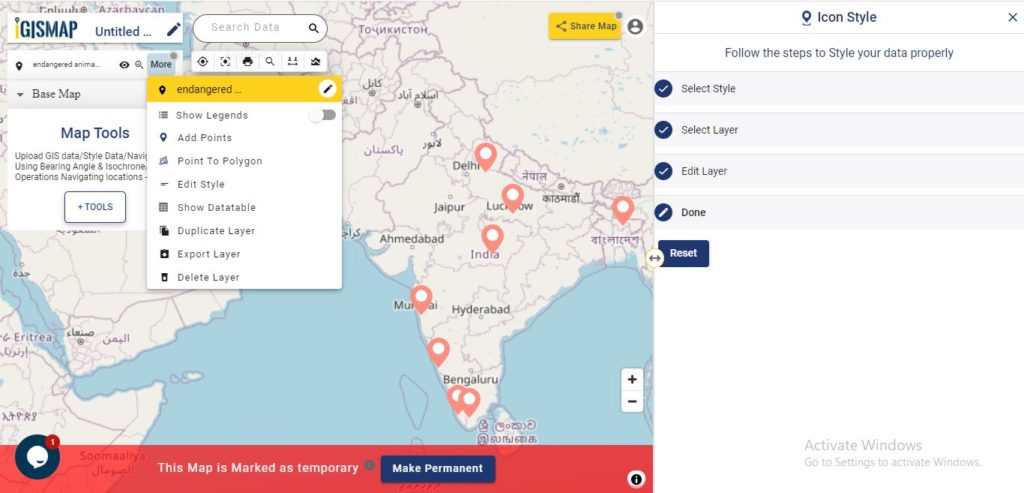
More options
More options

Embedding Map In Your Website

Now lets embed the map of habitat location in a website. For this, click the button at the top right, where you will reach the UI to control the sharing of this map.
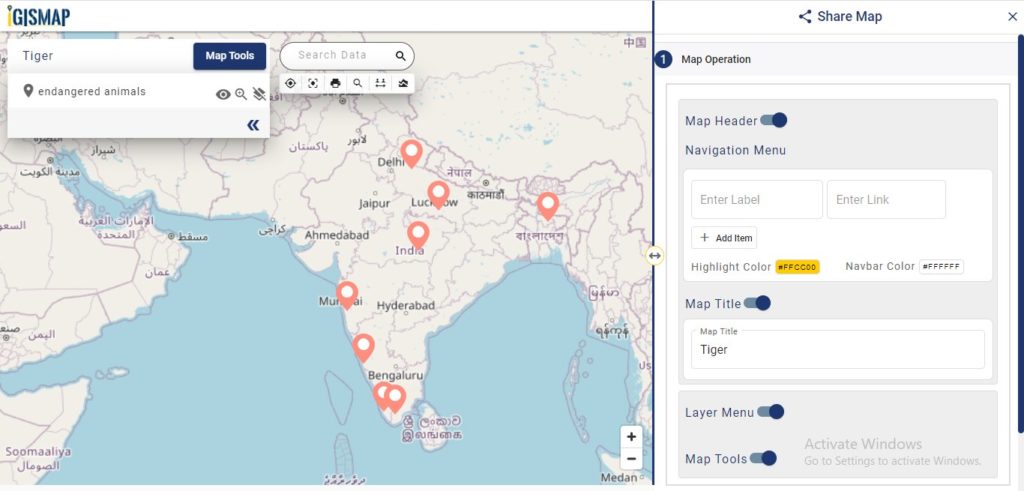
Share Map
Share Map

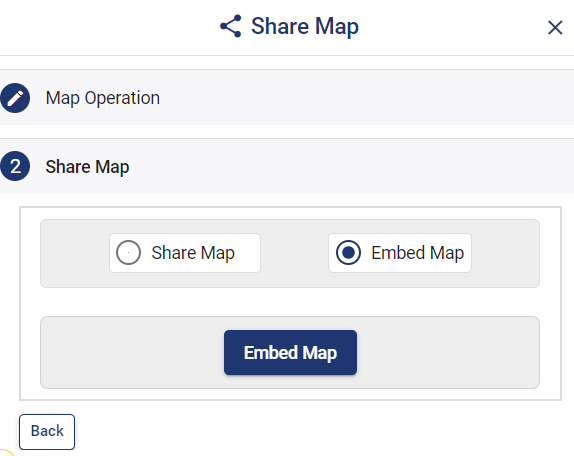
Enable and provide the necessary components of the Share Map and click Next button. Now select the Embed Map option and click Embed Map button.
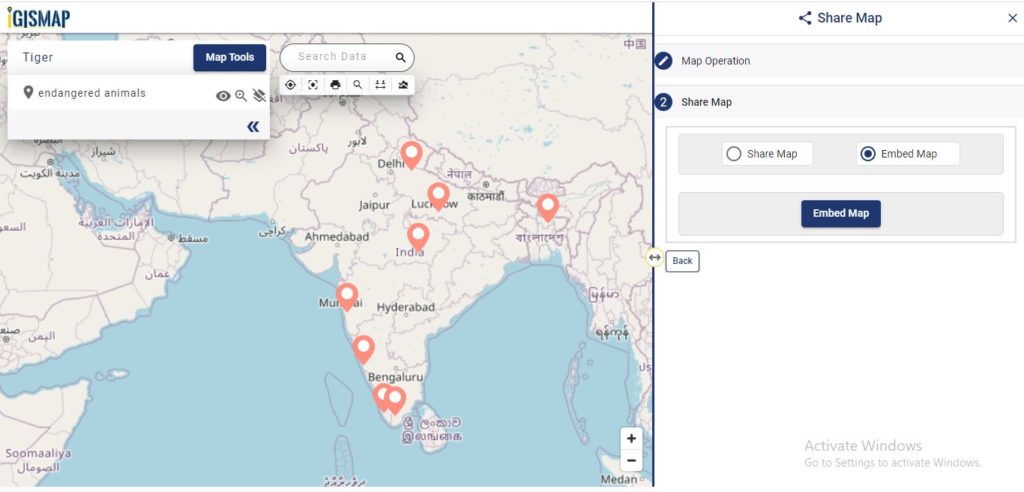
Embed Map
Embed Map

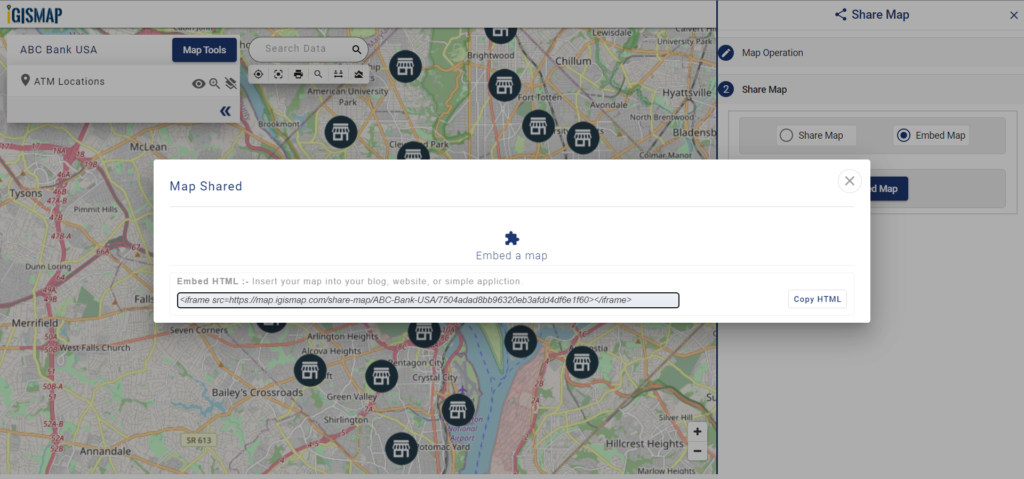
A popup appears with html iframe code
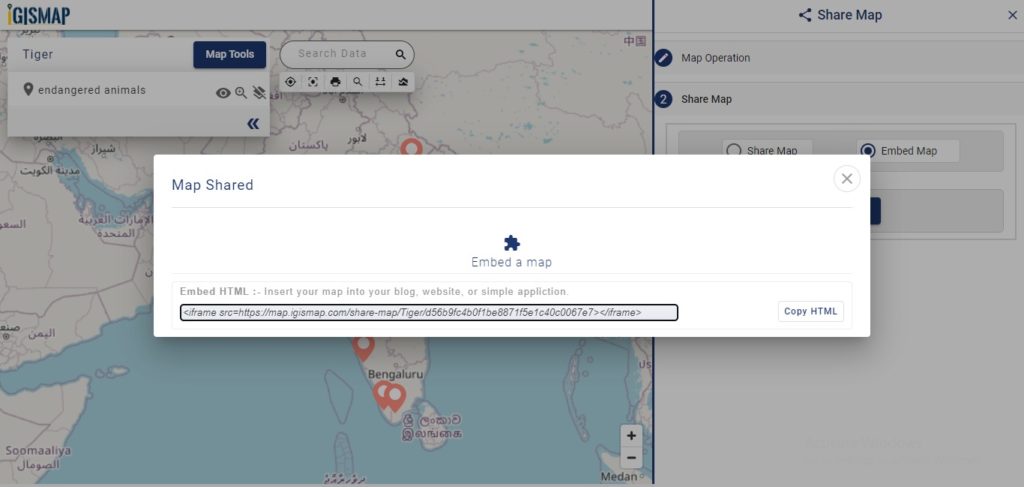
HTML Iframe Link
HTML Iframe Link

Copy this link from the popup and attach it to your website. Check the article Share your Map to understand more about Share Map feature of IGISMap.

Check similar articles:
Check the following IGISMap tools:

Plot ATM locations on a map and embed on your website

Consider that you are an engineer working for the technical support team in a bank. And you were asked to host a web map of the ATM locations under your branch. This same map should be later available to dynamically visualize the transactions associated with each ATM in a quantitative representation. In this article, you will learn how to plot atm/shop locations on map and embed it on your website.

There are limited GIS software and online tools where you can do this job. Most of them are limited to any single service, ie., either creating a map and hosting the map on a website, but IGISMap allows you to do both. IGISMap is a GIS based web platform providing multiple GIS applications that are most important in the field of geospatial analytics. The peculiarity of IGISMAP in the GIS Industry is its UI/UX which helps the user to perform effortless geospatial operations. GIS tools of IGISMAP allow you to Add Your Data, Create Your Data, Map Your Data, Style Your Data, Process Your Data, and Analyze Your Data, and additionally, it helps you to share your Data privately or publicly.

How to Plot ATM/shop locations on map

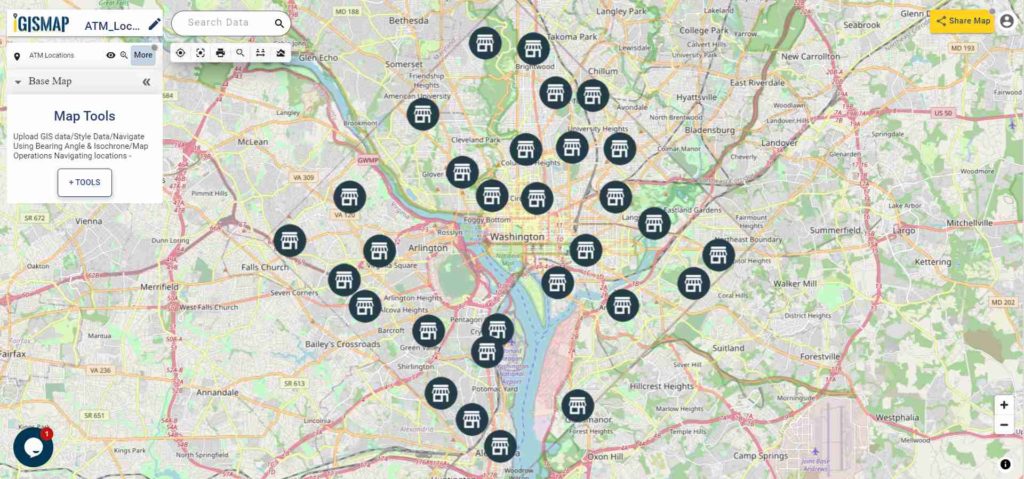
Create Point Data tool of IGISMap is a powerful GIS tool to plot point vector data to represent locations and point objects with single latitude and longitude values. Using Create Point Data tool, we can create an interactive map of ATM locations like the following.

Map of ATM Locations

Lets walk through each step of the Create Point Data tool to create a map like this and share with your team.

  • First, you need to log in to IGISMap from https://map.igismap.com/. If you haven’t signed up for IGISMap, click the Sign Up button to create an IGISMap account.
  • After Logging In, you will be directed to the dashboard of your IGISMap account.
  • From the dashboard, click on the Create Point Data tab to open the tool as shown below.
plot atm/shop locations on the map
Create Point Data tool

Start Plotting Points for the ATM Locations

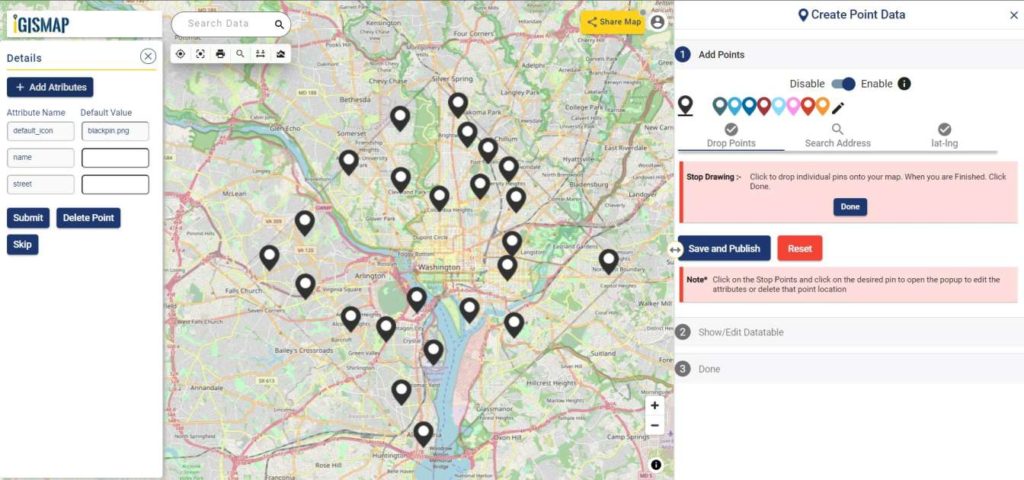
First step is Add Points, where we can start plotting the ATM locations as points, in the form of pins. IGISMap provides you with three features for plotting points: Drop Points, Search Address, and Lat Lon Values.

  • Let’s select the Drop Points option and zoom to the location with the desired ATM Machine to plot a pin in that specific location on the map
Create Point Data - Add Points - Drop Points - plot the atm/shop location on map
Add Points – Drop Points
  • Search Address option opens a search address box, where you can enter an address and choose the right option from the dropdown list, then click the Plot button to plot a point on that location.
  • Lat Lon Values will open two boxes to enter latitude and longitude values of the location you want to plot, Plot Location button in this option will plot a pin at the location you have entered.

Also, a popup will open for entering attribute values in each attribute field for that atm location when a point is plotting. Click the Submit button to Submit the save the attribute entries. You can choose to delete the point you plotted by clicking the Delete Point button. You can disable the default opening of this popup using the toggle button.

Create Point Data - Add Points - Enable/Disable Popup

But we can open this popup anytime while plotting, by simply clicking on an existing pin.

Note: If the Drop Points option is active for dropping pins, it should be unselected for selecting the plotted pins to open the attribute popup.

After plotting every desired ATM location for our data, click the Save and Publish button to publish your data in the map.

Review and Edit the Datatable

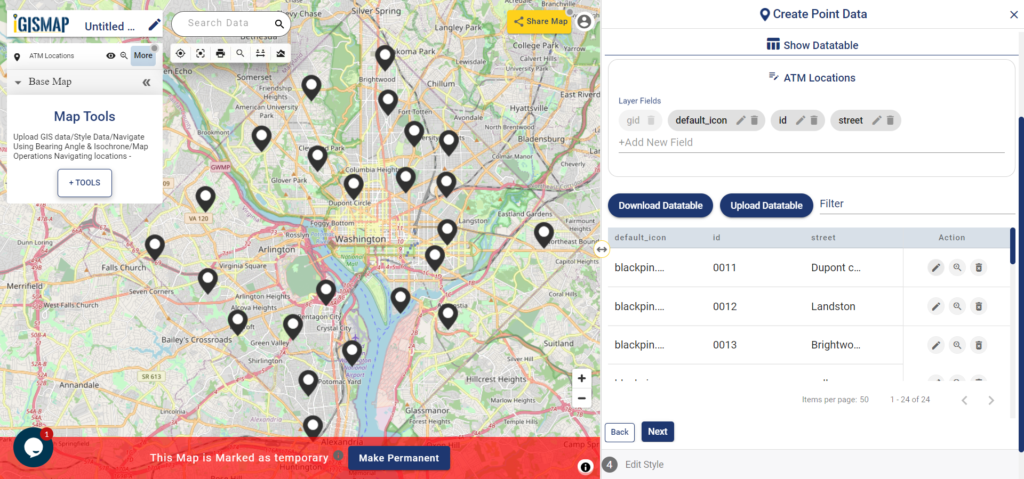
After the atm location is published, Show/Edit Datatable section will be open. Here you can edit the attribute values entered for each point location after clicking the button in the data table along each row in the data table. You can also choose to delete a point by clickingbutton.

Create Point Data - Show/Edit Datatable - plot the atm/shop location on map
Datatable

Options to edit or delete the attribute fields are also available in this step along with the option to add new attribute fields to this data. If you thought of adding more points to the data of ATM Locations, select the Back button to go to the Add Points section, where you can add more points and make changes to the already published data.

Option to update the data table as bulk is available in this section. Where the whole data table can be downloaded in Excel format using Download Datatable button. And to make the changes outside IGISMap, then upload the edited/updated spreadsheet file using Upload Datatable button and integrate with the same point data of ATM locations. 

After making all the changes in the datatable, let’s move to the styling section by clicking the Next button to finish plotting.

Style Your ATM Location Points

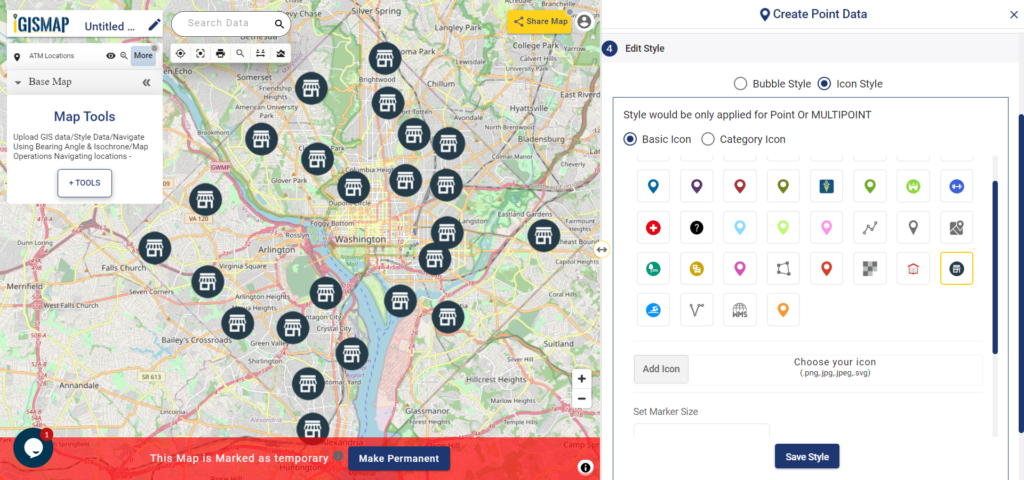
A map will become more meaningful if appropriate icons and colors are used to visualize the features of the map. In IGISMap styling options, Bubble Style and Icon Style are provided for point GIS data.

Check this article understand How to create Bubble Map for point GIS data.

Here we are going to style our data using Icon Style. In Icon Styling, IGISMap provides two more options – Basic and Category styling. For now, let’s make it simple by providing an appropriate pin icon for styling the ATM location points. And apply it on the ATM Locations data as follows.

Check this article to understand How to style point GIS data categorically using Icon Style tool.

Create Point Data - Edit Style - plot the atm/shop location on map
Edit Style

IGISMap provides direct access to Icon Style and Bubble Style tools from an existing map, where you can style point GIS data published in that map

Embed Your ATM Locations Map in a Website

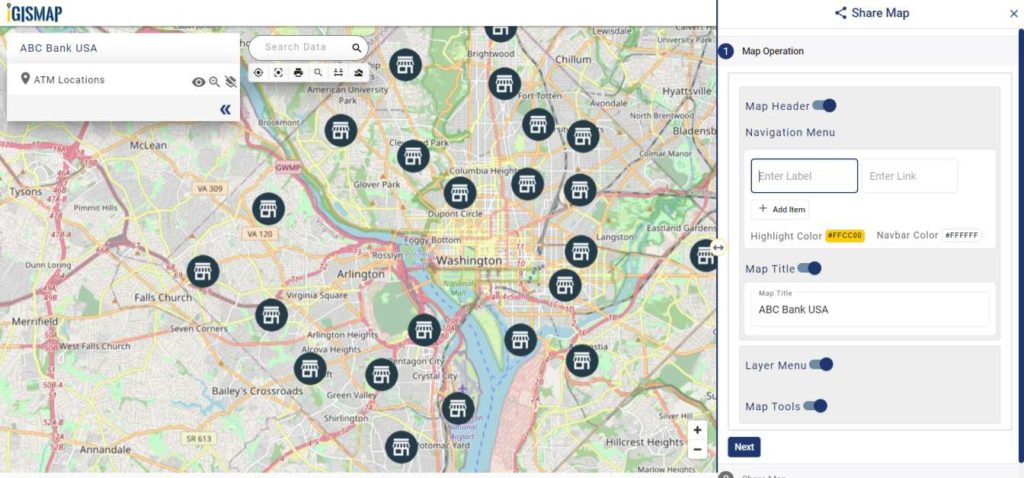
As the data is created completely and styled appropriately, let’s embed the map of ATM Locations in a website. For this, click the button at the top right, where you will reach the UI to control the sharing of this map.

Share Map - plot the atm/shop location on map
Share Map

Once the components are enabled and disabled as desired. After that click the Next button to proceed to the step of copying the iframe link to embed in a website.

Share Map - Embed Map
Share Map – Embed Map
Link to Embed Map - plot the atm/shop location on map
Link to Embed Map

Copy the HTML code link and embed it on your website. Thus the map will be available as interactive as below.

Afterward merge the data table of the ATM Locations with the transaction data of each ATMs. Furthermore, for quantitative visualization, we can use Bubble Style. The style will apply automatically to your website. So with the following steps, you can plot atm/shop locations on a map and embed them on your website.

Article Share your Map will help you understand more about Share Map feature of IGISMap.

Other articles:
Check the following IGISMap tools:

Download Indiana Counties GIS data – United States – Railways, Highway line, maps

GIS Data and Maps of Indiana State is used by planners and surveyors for visualizing and identifying the patterns that are difficult to examine when data is in table form. Here you can download the GIS data of the state boundary, county division, rail and highway maps in just a few clicks. You can use these data for analysis in IGISMAP itself or download them in any suitable GIS format. You can download these data in KML, GeoJSON, CSV or Shapefile formats.

With MAPOG’s versatile toolkit, you can effortlessly upload vector and raster filesadd WMS (Web Map Service) layers, upload Excel or CSV data, incorporate existing files, perform polygon splitting and merging, generate new polygon and polyline data, use the converter for various formats, conduct buffer analysiscreate gridstransform points into polygons, calculate isochrones, and utilize the geocoder for precise location information.

We offer an extensive array of data formats, including KML, SHP, CSV, GeoJSON, Tab, SQL, Tiff, GML, KMZ, GPKZ, SQLITE, Dxf, MIF, TOPOJSON, XLSX, GPX, ODS, MID, and GPS, ensuring compatibility and accessibility for various applications and analyses.

Note:

  • All data available are in GCS datum EPSG:4326 WGS84 CRS (Coordinate Reference System).
  • You need to login for downloading the shapefile.

Download Shapefile of Indiana State

Indiana state is the 38th largest state of the United States by area. Indianapolis is the capital city of the state. Here in this blog, you can easily download the GIS data of Indiana State. You need to register first before downloading the maps.

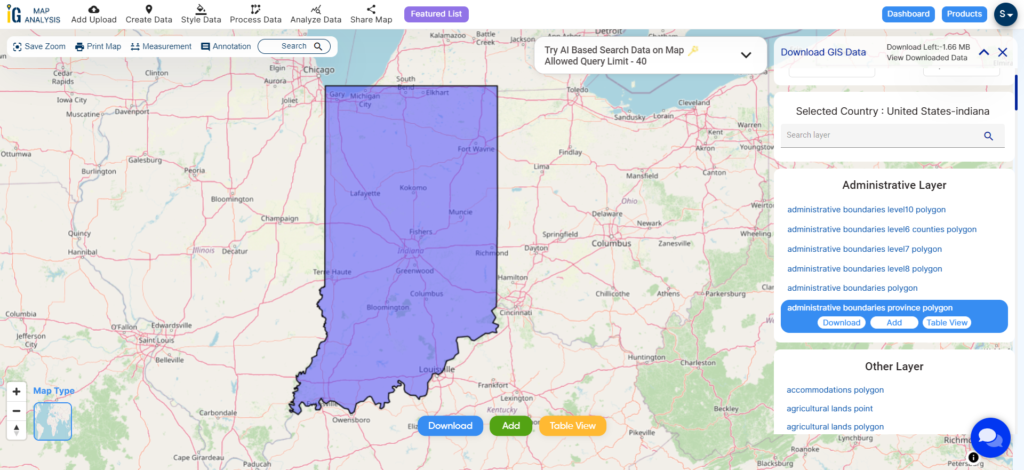
Indiana State Boundary

Download Indiana State Boundary Shapefile

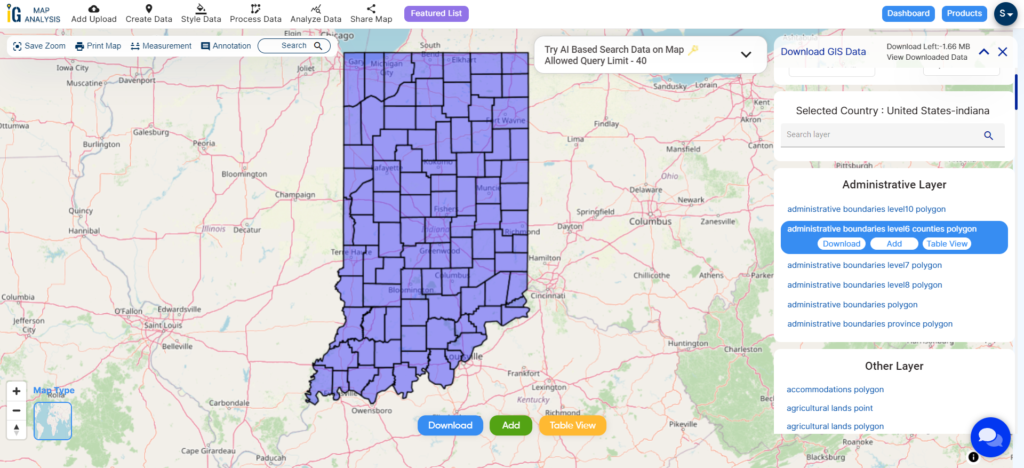
In the above screen, you can see the map of Indiana. Check the data table before downloading the maps. For data toggle switch from Map to Data. The layer list is on the Right side of the screen. Select the one which you want to download click on the button beside the layer name. A modal will appear to choose the appropriate GIS format as per requirement. For any specific GIS formats (vector or raster ) use GIS Converter.

Download GIS data Counties of Indiana

Indiana State is divided into 92 counties.

Indiana County Boundary

Download Indiana County Boundary Shapefile

In the above screen polygon map of Indiana state is shown. You can make it more interactive using the Analysis tool. In addition to, formatting you change the style, label, legends.

Above gis data covers following counties –

  • Adams
  • Allen
  • Bartholomew
  • Benton
  • Blackford
  • Boone
  • Brown
  • Carroll
  • Cass
  • Clark
  • Clay
  • Clinton
  • Crawford
  • Daviess
  • Dearborn
  • Decatur
  • De Kalb
  • Delaware
  • Dubois
  • Elkhart
  • Fayette
  • Floyd
  • Fountain
  • Franklin
  • Fulton
  • Gibson
  • Grant
  • Greene
  • Hamilton
  • Hancock
  • Harrison
  • Hendricks
  • Henry
  • Howard
  • Huntington
  • Jackson
  • Jasper
  • Jay
  • Jefferson
  • Jennings
  • Johnson
  • Knox
  • Kosciusko
  • La Porte
  • Lagrange
  • Lake
  • Lawrence
  • Madison
  • Marion
  • Marshall
  • Martin
  • Miami
  • Monroe
  • Montgomery
  • Morgan
  • Newton
  • Noble
  • Ohio
  • Orange
  • Owen
  • Parke
  • Perry
  • Pike
  • Porter
  • Posey
  • Pulaski
  • Putnam
  • Randolph
  • Ripley
  • Rush
  • St. Joseph
  • Scott
  • Shelby
  • Spencer
  • Starke
  • Steuben
  • Sullivan
  • Switzerland
  • Tippecanoe
  • Tipton
  • Union
  • Vanderburgh
  • Vermillion
  • Vigo
  • Wabash
  • Warren
  • Warrick
  • Washington
  • Wayne
  • Wells
  • White
  • Whitley

Highway line Shapefile of Indiana State

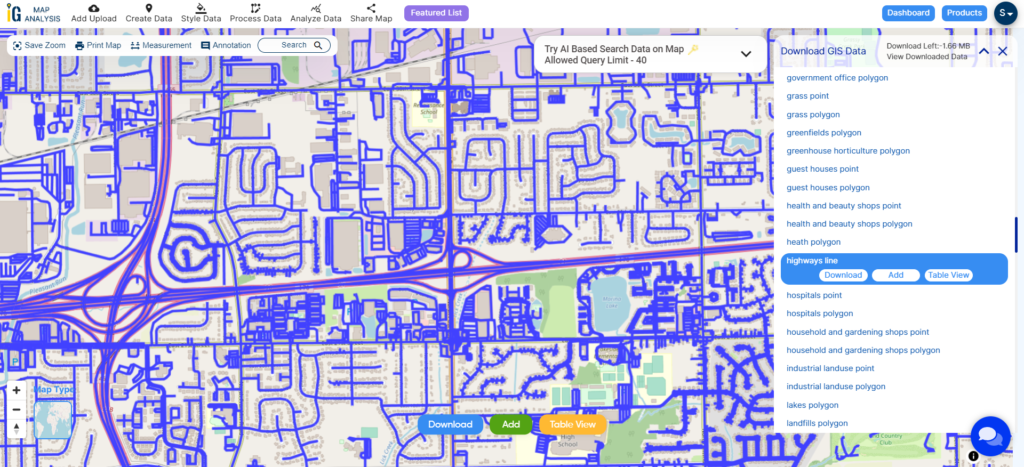
Indiana Highway LIne

Download Indiana Highway Line Shapefile

Zoom in view of highway line map is shown shown above. Similarly, you can easily download point based GIS data of airport point, ATM point, parking area, hospital location, etc.

Railway Line Shapefile of Indiana State

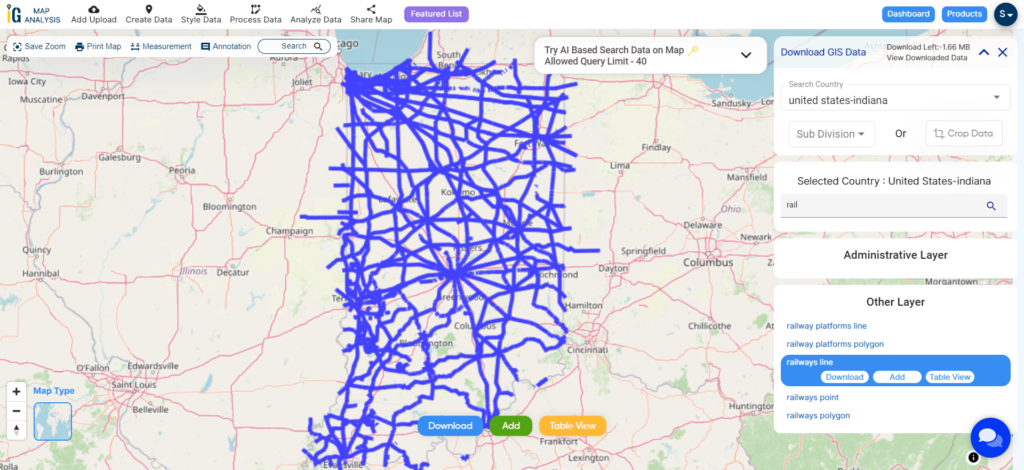
Indiana Railway Line

Download Indiana Railway Line Shapefile

Along with railways line map, you can also check rivers line, water canal data.

Download GIS Data of other states of USA:

  1. Alabama
  2. Alaska
  3. Arizona
  4. Arkansas
  5. California
  6. Colorado
  7. Connecticut
  8. Florida
  9. Georgia
  10. Hawaii
  11. Idaho
  12. Illinois
  13. Indiana
  14. Iowa
  15. Kansas
  16. Massachusetts
  17. Maryland
  18. Michigan
  19. Minnesota
  20. Mississipi
  21. Missouri
  22. Montana
  23. Nevada
  24. Nebraska
  25. Ohio
  26. Oklahoma
  27. Pennsylvania
  28. Utah
  29. Vermont
  30. Washington
  31. Wisconsin
  32. Wyoming
  33. Tennessee
  34. Texas
  35. Kentucky
  36. Louisiana
  37. Maine
  38. North Carolina
  39. Oregon
  40. Virginia
  41. West Virginia

Download Shapefile for the following:

  1. World Countries Shapefile
  2. Australia
  3. Argentina
  4. Austria
  5. Belgium
  6. Brazil
  7. Canada
  8. Denmark
  9. Fiji
  10. Finland
  11. Germany
  12. Greece
  13. India
  14. Indonesia
  15. Ireland
  16. Italy
  17. Japan
  18. Kenya
  19. Lebanon
  20. Madagascar
  21. Malaysia
  22. Mexico
  23. Mongolia
  24. Netherlands
  25. New Zealand
  26. Nigeria
  27. Papua New Guinea
  28. Philippines
  29. Poland
  30. Russia
  31. Singapore
  32. South Africa
  33. South Korea
  34. Spain
  35. Switzerland
  36. Tunisia
  37. United Kingdom Shapefile
  38. United States of America
  39. Vietnam
  40. Croatia
  41. Chile
  42. Norway
  43. Maldives
  44. Bhutan
  45. Colombia
  46. Libya
  47. Comoros
  48. Hungary
  49. Laos
  50. Estonia
  51. Iraq
  52. Portugal
  53. Azerbaijan
  54. Macedonia
  55. Romania
  56. Peru
  57. Marshall Islands
  58. Slovenia
  59. Nauru
  60. Guatemala
  61. El Salvador
  62. Afghanistan
  63. Cyprus
  64. Syria
  65. Slovakia
  66. Luxembourg
  67. Jordan
  68. Armenia
  69. Haiti And Dominican Republic

Disclaimer : If you find any shapefile data of country provided is incorrect do contact us or comment below, so that we will correct the same in our system as well we will try to correct the same in openstreetmap.

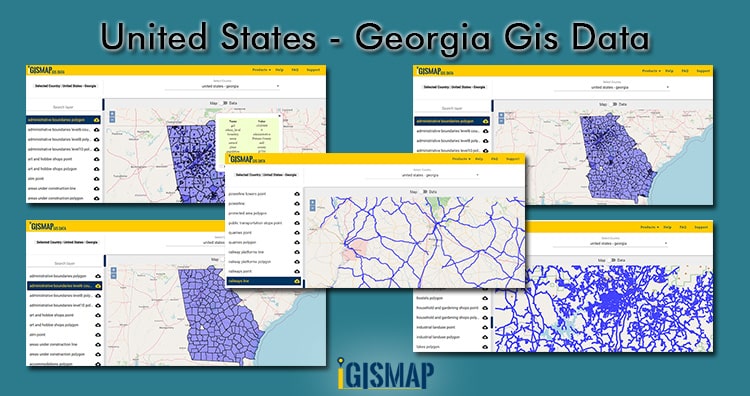
United States – Georgia GIS Data- shapefile, boundary, Counties, highway, railway line

GIS Data and Maps of Georgia State is used by planners and surveyors for visualizing and identifying the patterns that are difficult to examine when data is in table form. Here you can download the GIS data of the state boundary, county division, rail and highway maps in just a few clicks. You can use these data for analysis in IGISMAP itself or download them in any suitable GIS format. You can download these data in KML, GeoJSON, CSV or Shapefile formats.

With MAPOG’s versatile toolkit, you can effortlessly upload vector and raster filesadd WMS (Web Map Service) layers, upload Excel or CSV data, incorporate existing files, perform polygon splitting and merging, generate new polygon and polyline data, use the converter for various formats, conduct buffer analysiscreate gridstransform points into polygons, calculate isochrones, and utilize the geocoder for precise location information.

We offer an extensive array of data formats, including KML, SHP, CSV, GeoJSON, Tab, SQL, Tiff, GML, KMZ, GPKZ, SQLITE, Dxf, MIF, TOPOJSON, XLSX, GPX, ODS, MID, and GPS, ensuring compatibility and accessibility for various applications and analyses.

Note:

  • All data available are in GCS datum EPSG:4326 WGS84 CRS (Coordinate Reference System).
  • You need to login for downloading the shapefile.

Download shapefile of Georgia Counties

Georgia is the southeastern U.S. states with Atlanta as a capital city of the state. According to the area, it is the 24th state of the United States

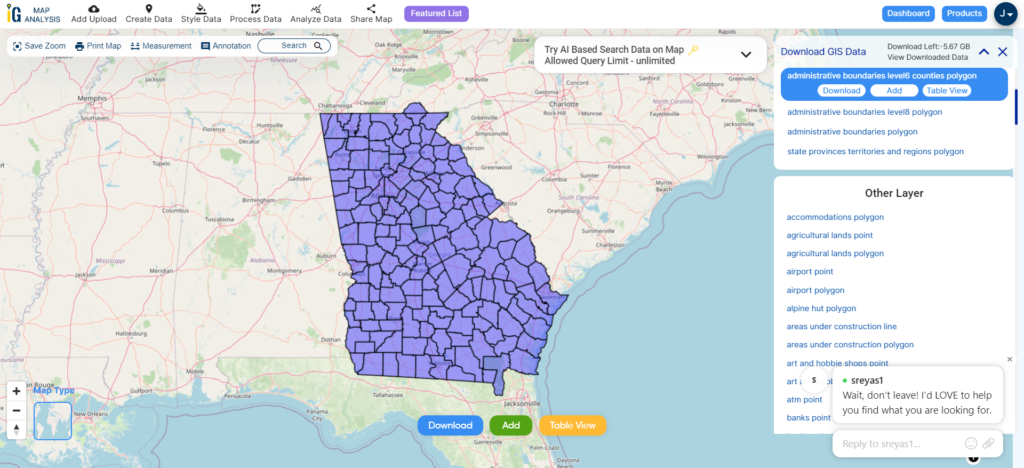
Georgia map is shown in above screen. Check data before downloading map. Toggle to Data from Map button. Layer name is displayed on the right side of the screen. Click on download button placed near to layer name.

There are 159 counties in Georgia State.

Georgia County Boundary

Download Georgia County Boundary Shapefile

Counties name are given below.

  • Appling
  • Atkinson
  • Bacon
  • Baker
  • Baldwin
  • Banks
  • Barrow
  • Bartow
  • Ben Hill
  • Berrien
  • Bibb
  • Bleckley
  • Brantley
  • Brooks
  • Bryan
  • Bulloch
  • Burke
  • Butts
  • Calhoun
  • Camden
  • Candler
  • Carroll
  • Catoosa
  • Charlton
  • Chatham
  • Chattahoochee
  • Chattooga
  • Cherokee
  • Clarke
  • Clay
  • Clayton
  • Clinch
  • Cobb
  • Coffee
  • Colquitt
  • Columbia
  • Cook
  • Coweta
  • Crawford
  • Crisp
  • Dade
  • Dawson
  • De Kalb
  • Decatur
  • Dodge
  • Dooly
  • Dougherty
  • Douglas
  • Early
  • Echols
  • Effingham
  • Elbert
  • Emanuel
  • Evans
  • Fannin
  • Fayette
  • Floyd
  • Forsyth
  • Franklin
  • Fulton
  • Gilmer
  • Glascock
  • Glynn
  • Gordon
  • Grady
  • Greene
  • Gwinnett
  • Habersham
  • Hall
  • Hancock
  • Haralson
  • Harris
  • Hart
  • Heard
  • Henry
  • Houston
  • Irwin
  • Jackson
  • Jasper
  • Jeff Davis
  • Jefferson
  • Jenkins
  • Johnson
  • Jones
  • Lamar
  • Lanier
  • Laurens
  • Lee
  • Liberty
  • Lincoln
  • Long
  • Lowndes
  • Lumpkin
  • Macon
  • Madison
  • Marion
  • McDuffie
  • McIntosh
  • Meriwether
  • Miller
  • Mitchell
  • Monroe
  • Montgomery
  • Morgan
  • Murray
  • Muscogee
  • Newton
  • Oconee
  • Oglethorpe
  • Paulding
  • Peach
  • Pickens
  • Pierce
  • Pike
  • Polk
  • Pulaski
  • Putnam
  • Quitman
  • Rabun
  • Randolph
  • Richmond
  • Rockdale
  • Schley
  • Screven
  • Seminole
  • Spalding
  • Stephens
  • Stewart
  • Sumter
  • Talbot
  • Taliaferro
  • Tattnall
  • Taylor
  • Telfair
  • Terrell
  • Thomas
  • Tift
  • Toombs
  • Towns
  • Treutlen
  • Troup
  • Turner
  • Twiggs
  • Union
  • Upson
  • Walker
  • Walton
  • Ware
  • Warren
  • Washington
  • Wayne
  • Webster
  • Wheeler
  • White
  • Whitfield
  • Wilcox
  • Wilkes
  • Wilkinson
  • Worth

Highway Line GIS data of Georgia U.S. State

Georgia Highway Line

Download Georgia Highway Line Shapefile

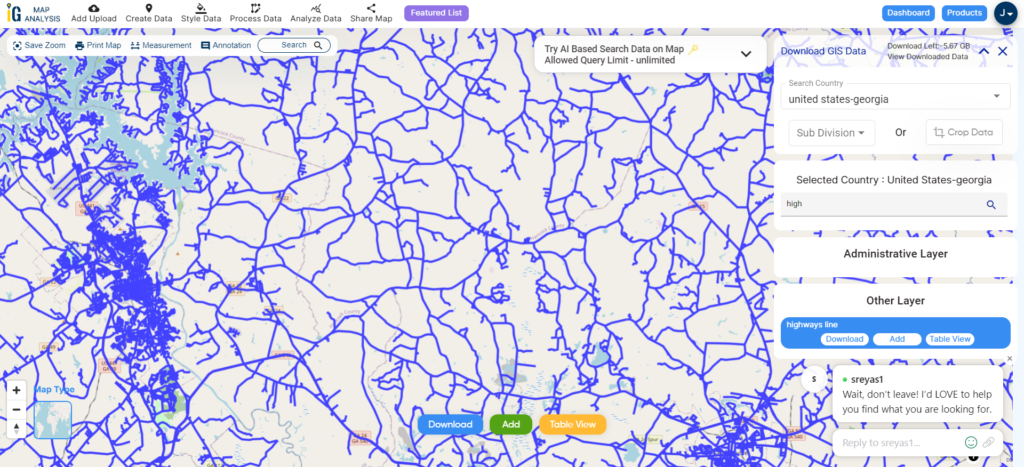
Zoom in view of highway line map is shown shown above. Similarly, you can easily download point based GIS data of airport point, ATM point, parking area, hospital location, etc.

Georgia State Railway Line Shapefile

Georgia Railway Line

Download Georgia Railway Line Shapefile

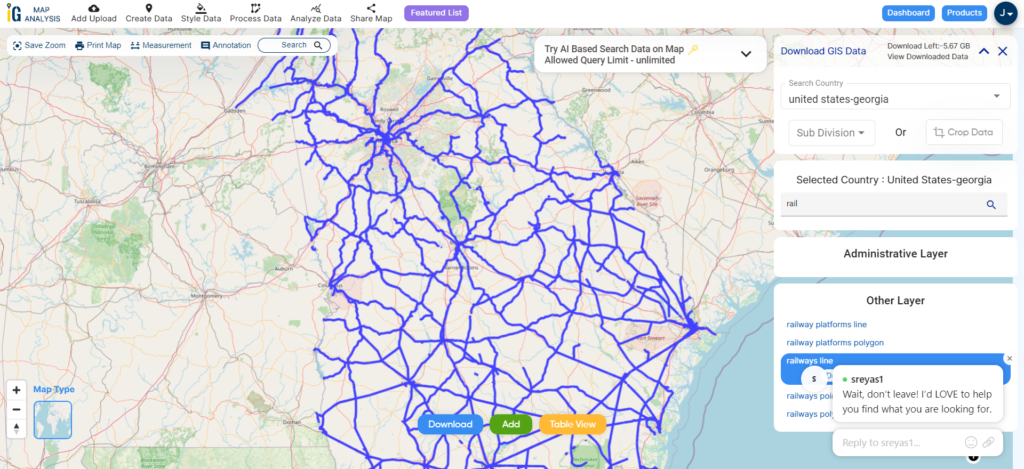
Like railway line GIS data you are also able to download powerline towers point, powerline, public transportation stops point, quarries point, etc.

Other GIS Data:

Above all links are provided for GIS data of Georgia if you are looking for any specific data please write us on support@igismap.com

Download GIS Data of other states of USA:

  1. Alabama
  2. Alaska
  3. Arizona
  4. Arkansas
  5. California
  6. Colorado
  7. Connecticut
  8. Florida
  9. Georgia
  10. Hawaii
  11. Idaho
  12. Illinois
  13. Indiana
  14. Iowa
  15. Kansas
  16. Massachusetts
  17. Maryland
  18. Michigan
  19. Minnesota
  20. Mississipi
  21. Missouri
  22. Montana
  23. Nevada
  24. Nebraska
  25. Ohio
  26. Oklahoma
  27. Pennsylvania
  28. Utah
  29. Vermont
  30. Washington
  31. Wisconsin
  32. Wyoming
  33. Tennessee
  34. Texas
  35. Kentucky
  36. Louisiana
  37. Maine
  38. North Carolina
  39. Oregon
  40. Virginia
  41. West Virginia

Download Shapefile for the following:

  1. World Countries Shapefile
  2. Australia
  3. Argentina
  4. Austria
  5. Belgium
  6. Brazil
  7. Canada
  8. Denmark
  9. Fiji
  10. Finland
  11. Germany
  12. Greece
  13. India
  14. Indonesia
  15. Ireland
  16. Italy
  17. Japan
  18. Kenya
  19. Lebanon
  20. Madagascar
  21. Malaysia
  22. Mexico
  23. Mongolia
  24. Netherlands
  25. New Zealand
  26. Nigeria
  27. Papua New Guinea
  28. Philippines
  29. Poland
  30. Russia
  31. Singapore
  32. South Africa
  33. South Korea
  34. Spain
  35. Switzerland
  36. Tunisia
  37. United Kingdom Shapefile
  38. United States of America
  39. Vietnam
  40. Croatia
  41. Chile
  42. Norway
  43. Maldives
  44. Bhutan
  45. Colombia
  46. Libya
  47. Comoros
  48. Hungary
  49. Laos
  50. Estonia
  51. Iraq
  52. Portugal
  53. Azerbaijan
  54. Macedonia
  55. Romania
  56. Peru
  57. Marshall Islands
  58. Slovenia
  59. Nauru
  60. Guatemala
  61. El Salvador
  62. Afghanistan
  63. Cyprus
  64. Syria
  65. Slovakia
  66. Luxembourg
  67. Jordan
  68. Armenia
  69. Haiti And Dominican Republic

Disclaimer : If you find any shapefile data of country provided is incorrect do contact us or comment below, so that we will correct the same in our system as well we will try to correct the same in openstreetmap.

What is bearing angle and calculate between two Points

In geometry angles are measured regardless of direction or orientation as in trigonometry we measure angle by rotating anti clockwise. Here x-axis is (0) zero degree and y-axis is at 90 degree. So in this article we get familiar with What is bearing and calculate angle between two points. In GIS bearing angle is used for navigation or direction.

Try Route Compass Mobile App for calculating bearing angle and distance.

https://play.google.com/store/apps/details?id=com.bearingangle&pli=1

Calculate Bearing angle in Mobile App

Online Tool To Calculate Bearing Angle and Distance To Make Route

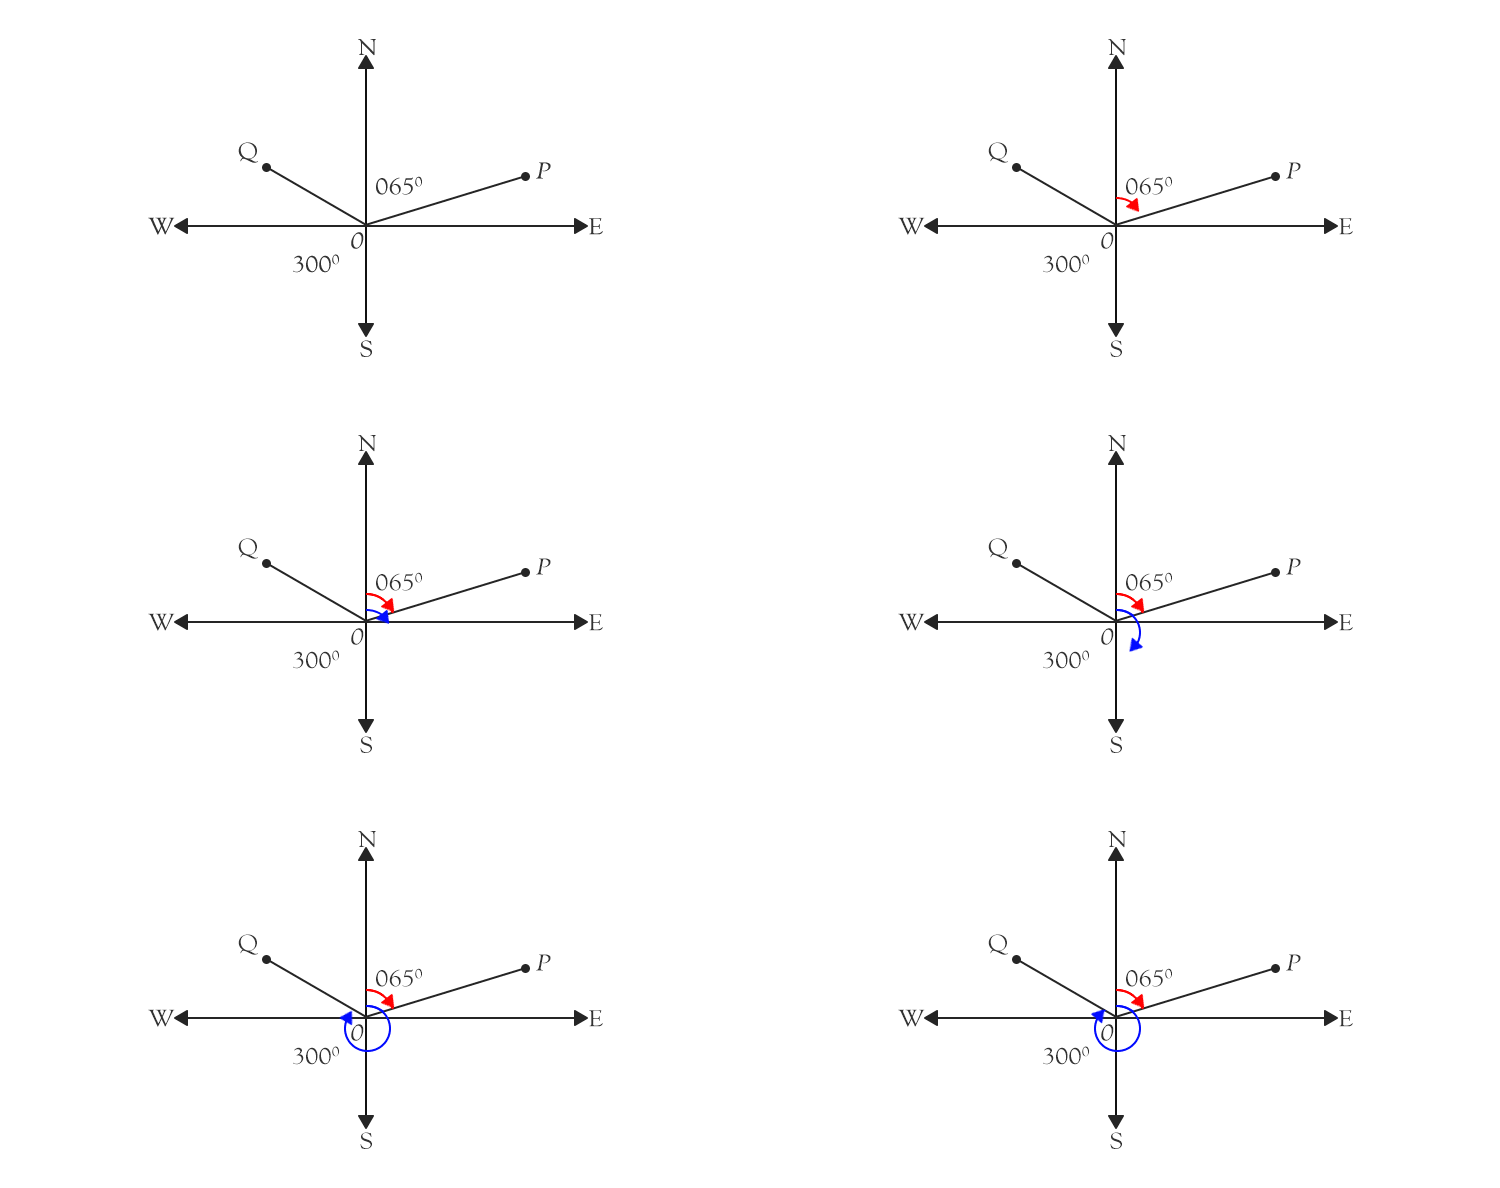
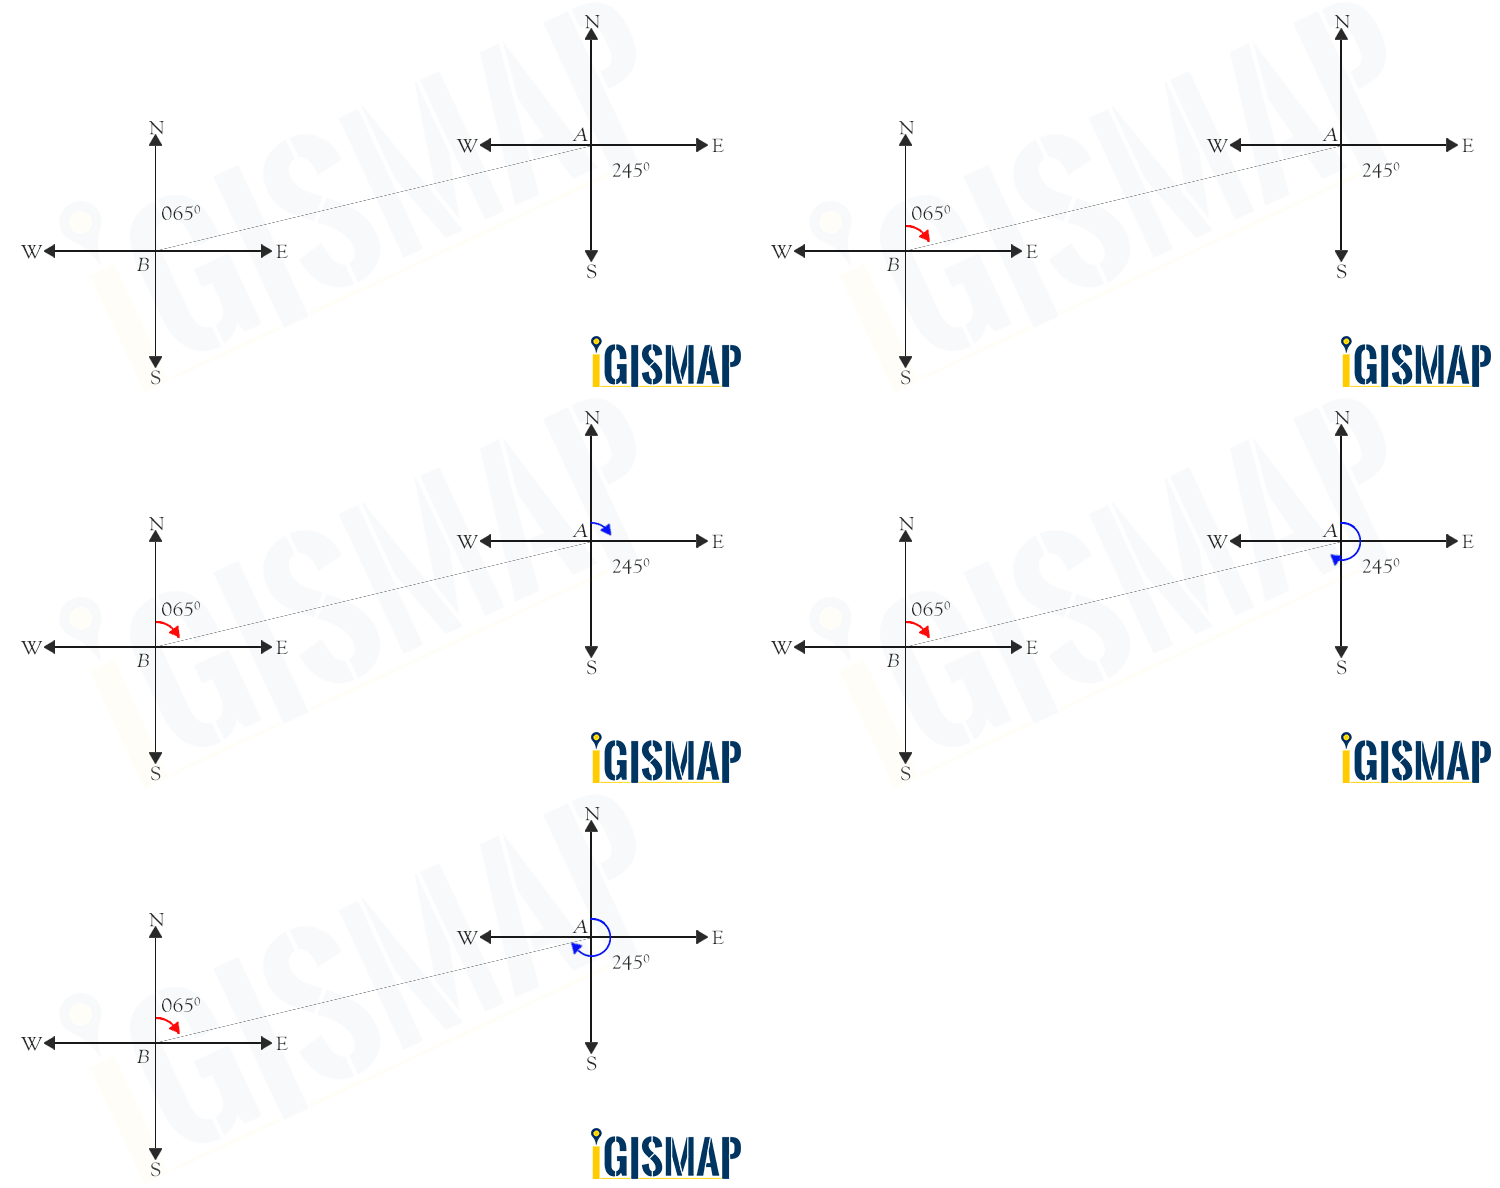
Bearing is a direction measured from north and it tracks angle in clockwise direction with north line which means north represents zero degree, east is 90 degrees, south is 180 degrees and west is 270 degrees.

Bearing angle at a point with respect to north at P if we measured clockwise then we see in gif is 065 degrees and at Q it is 300 degrees.

What is bearing and calculate angle between two points

A bearing is used to determine direction of one point relative to another point. You can see in  gif given below.

What is bearing and calculate angle between two points

Bearing of two points

Formula to Find Bearing or Heading angle between two points: Latitude Longitude is

β = atan2(X,Y),

For  variable Ysin(toRadians(lo2-lo1)) *  cos(toRadians(la2))

and variable Xcos(toRadians(la1))*sin(toRadians(la2)) – sin(toRadians(la1))*cos(toRadians(la2))*cos(toRadians(lo2-lo1))

Check video on Bearing Angle and like, share and subscribe our IGIS MAP Channel on youtube.

You can also check Bearing Angle Tool

Learn QGIS

Download free Shapefile GIS Data

Pan-sharpening images using ArcGIS

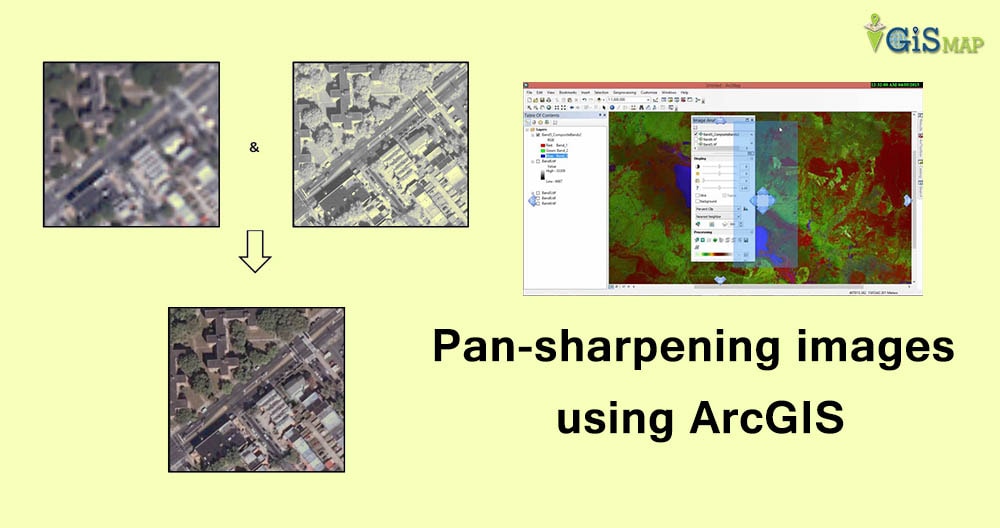
Pan-sharpening images using ArcGIS. Pansharpening is the process which makes use of panchromatic image and some bands of multispectral image to result in a high resolution image. Pansharpening stands for panchromatic sharpening. Here sharpening basic refers to increase the spatial resolution of multisprectral image or color image. This technique of increasing resolution has been used by various organisations that provide satellite imagery of high resolution like Google images etc.

A multi spectral image is captured with high spectral resolution as it is displayed in different colors while the panachromatic image is captured with high spatial resolution and provides a cluster of red, green and blue pixels resulting in a gray scale image.Now the question is how we get a pan-sharpened image? The possible answer by an ArcGIS user can be it’s just a tool to run. But is it that easy? No. Both the images has to be pre-processed before applying this tool which comes out to be a tough process if you have  a number of tiles for your area of interest.

Pan-sharpening images using ArcGIS

  • First of all start with the multispectral image let’s say a cartosat image with a resolution of 1 arc sec. Start with stacking of different bands(either all even or all odd number) in Erdas imagine. Perform Geo-referencing of each tile making one tile static.
  • Then mosaicing of tiles in ArcGIS using Mosaic tool of data management tool set. The panchromatic image will be a single band image say panchromatic band of lansat image with 15 m resolution so it does not need to be stacked. So just mosaic all the tiles of panchromatic image. Geo-reference both multispectral and panchromatic image accordingly so that they both are same spatial location without any spatial difference.
  • Now apply tool create pan-sharpened raster data-set of data management tool-set.

Thus a multispectral image with high spatial resolution is obtained. As panchromatic image possess high spatial information and multispectral image possess good color information. Fusion of the two brings out a colored image of high resolution which can be used as a product for any client who want an detailed view of his area of interest.