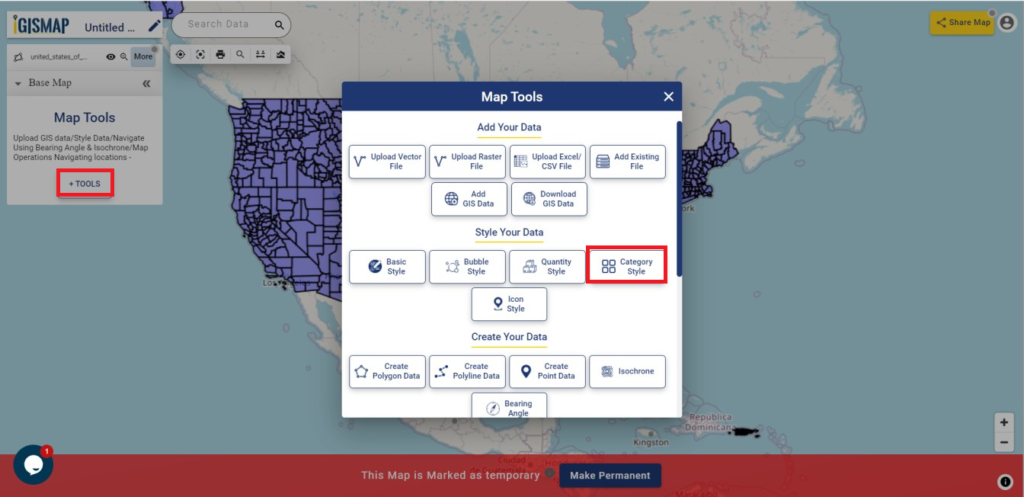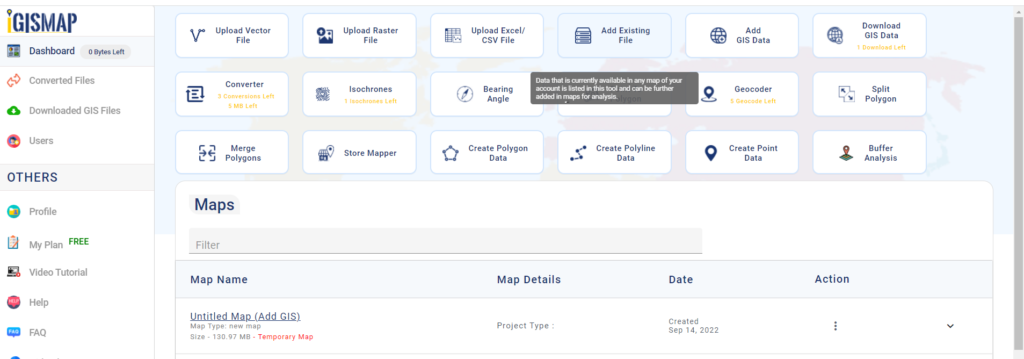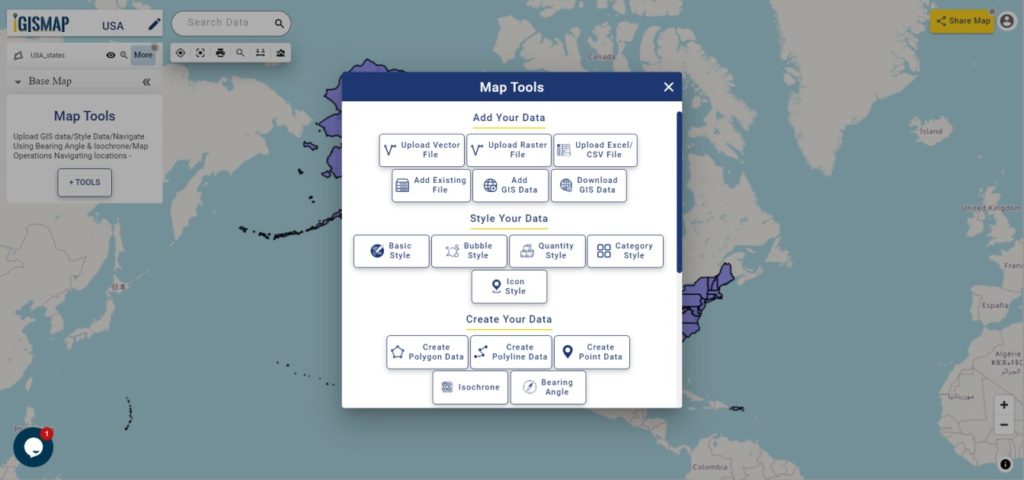
With a vast collection of GIS data covering 150+ countries, each nation offering over 150 datasets, IGISMAP is becoming an irreplaceable asset in geospatial industry. Our GIS data collection stands out for its precise representation of administrative divisions and various geographic features like rivers, roads, and airports. Users can access these data from two tools of IGISMAP: Download GIS Data and Add GIS Data. Choose from multiple data formats, including Shapefile, KML, GeoJSON, or CSV to download data from Download GIS Data tool. To learn more about the Add GIS Data tool, explore our article “Add GIS data from IGISMap GIS data collection.” In this comprehensive guide, we’ll show you how to download administrative-level GIS data for Laos using the Download GIS Data tool. Take the hassle out of GIS data searching and embark on a smooth geospatial journey with IGISMAP as your reliable companion!
Note:
- All data available are in GCS datum EPSG:4326 WGS84 CRS (Coordinate Reference System).
- You need to login for downloading the shapefile.
Here is the video tutorial to download data:
Download Shapefile Data of Laos
Laos is a landlocked country located in Southeast Asia, officially known as the Lao People’s Democratic Republic. Situated at the center of the Indochinese Peninsula, Laos shares its borders with Myanmar and China to the northwest, Vietnam to the east, Cambodia to the southeast, and Thailand to the west and southwest. The capital city of Laos is Vientiane, which is also its largest city.
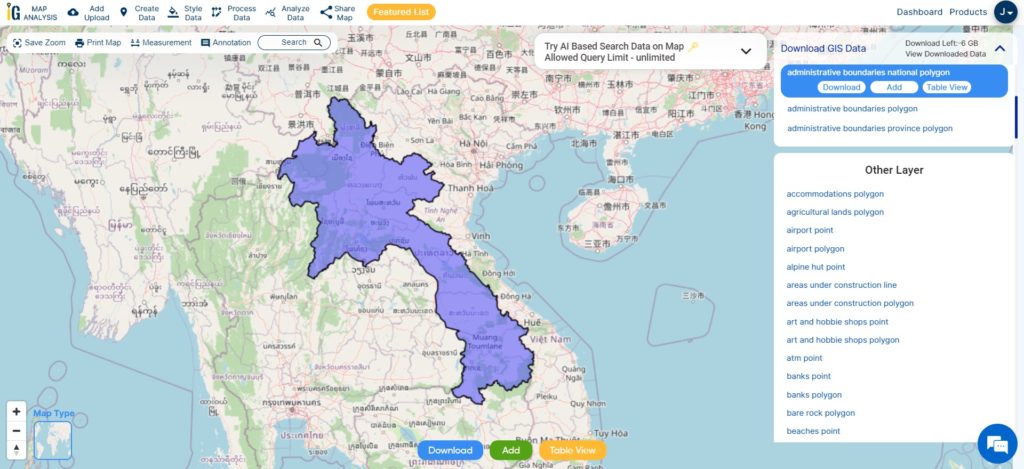
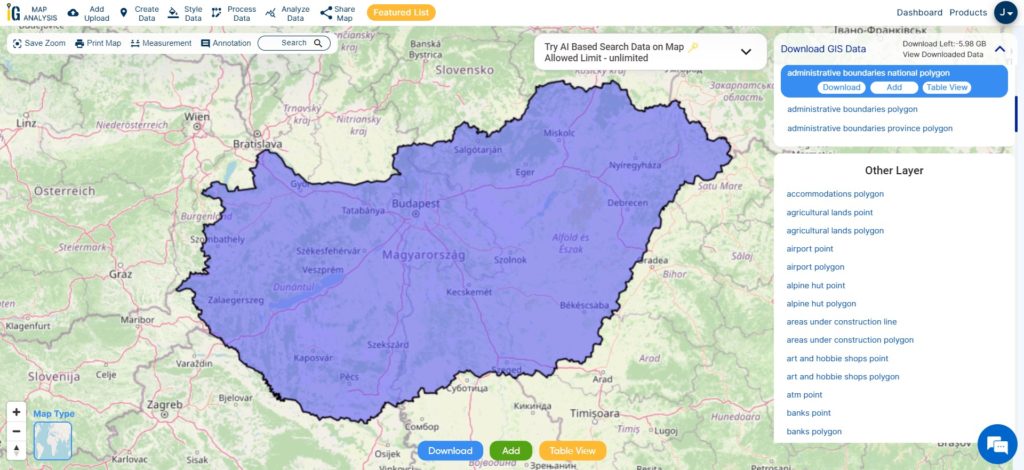
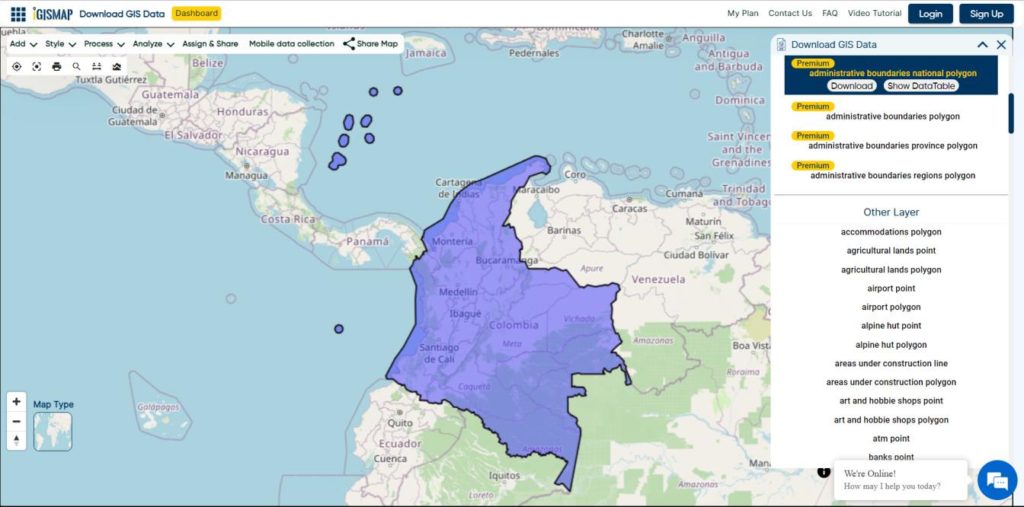
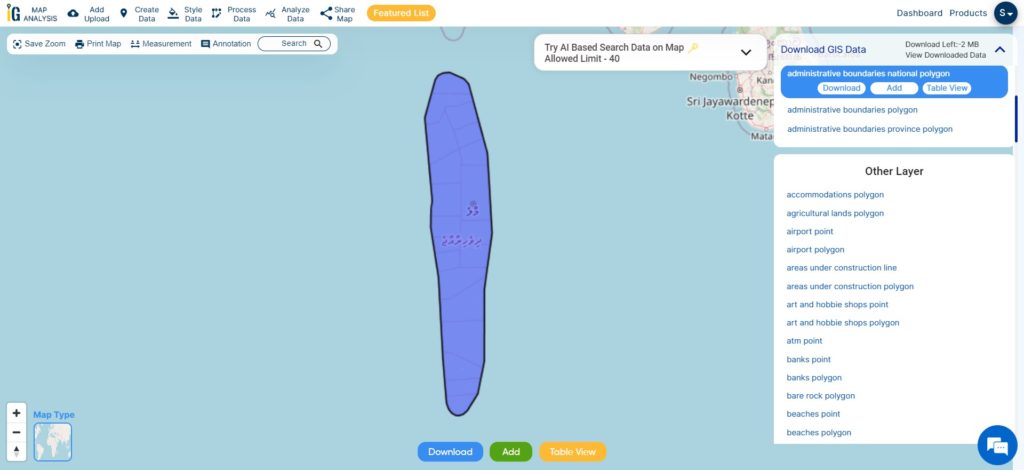
Download Laos National Boundary Shapefile
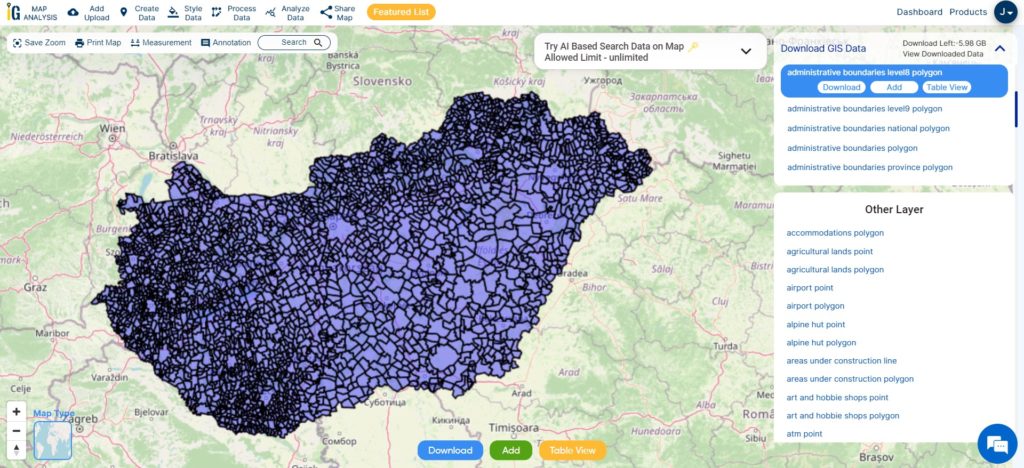
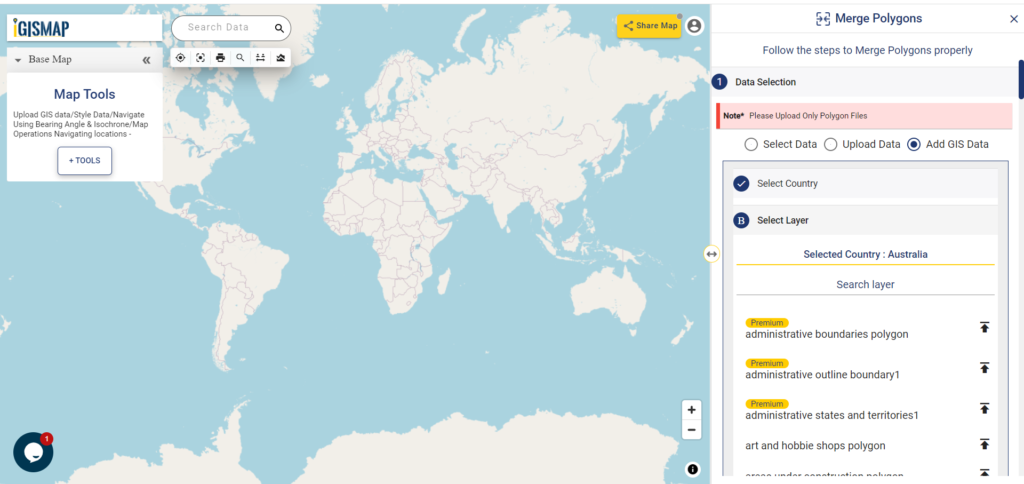
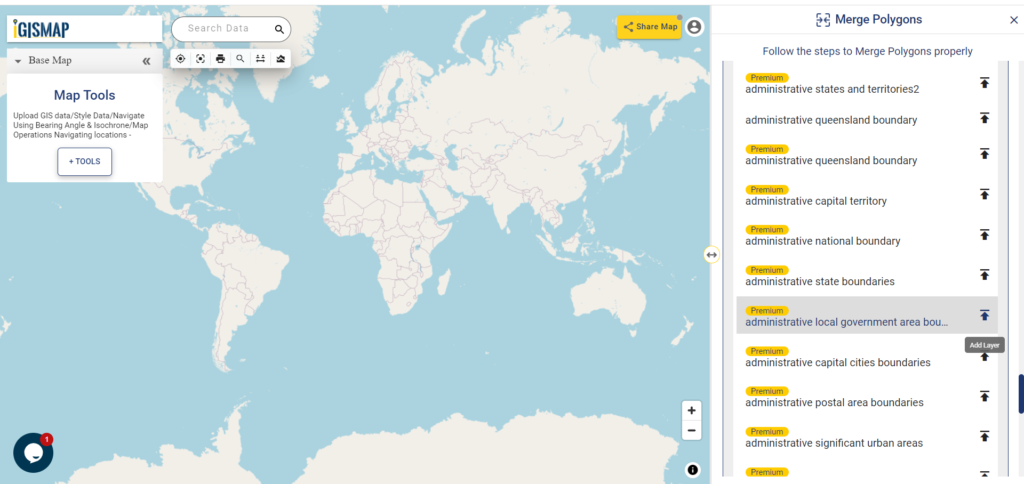
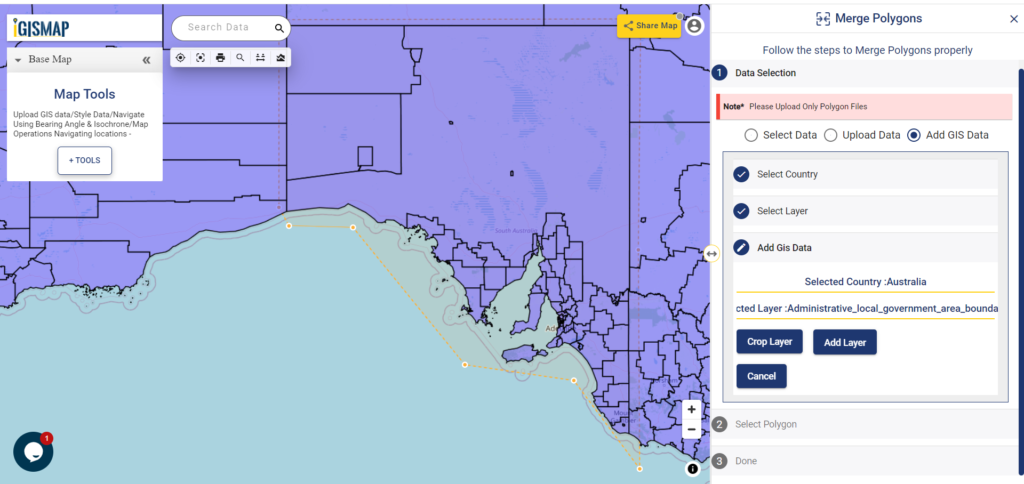
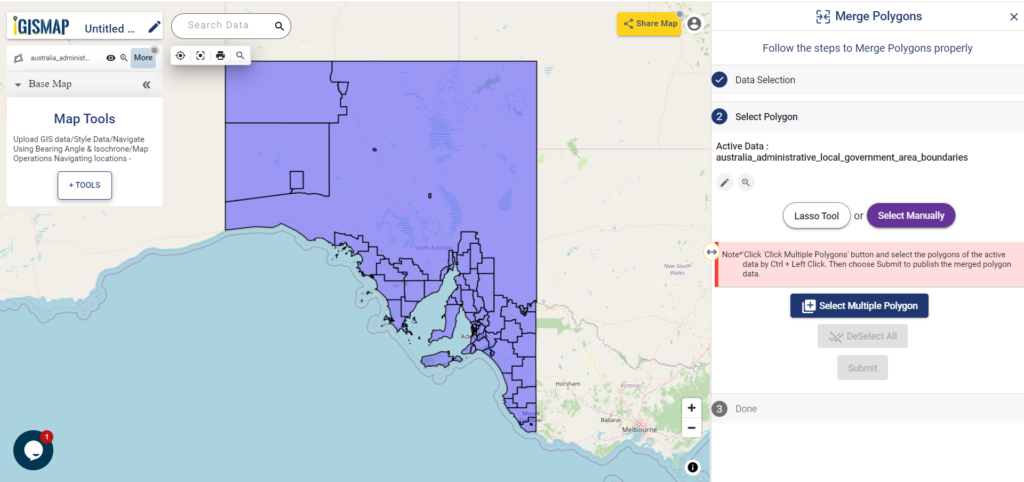
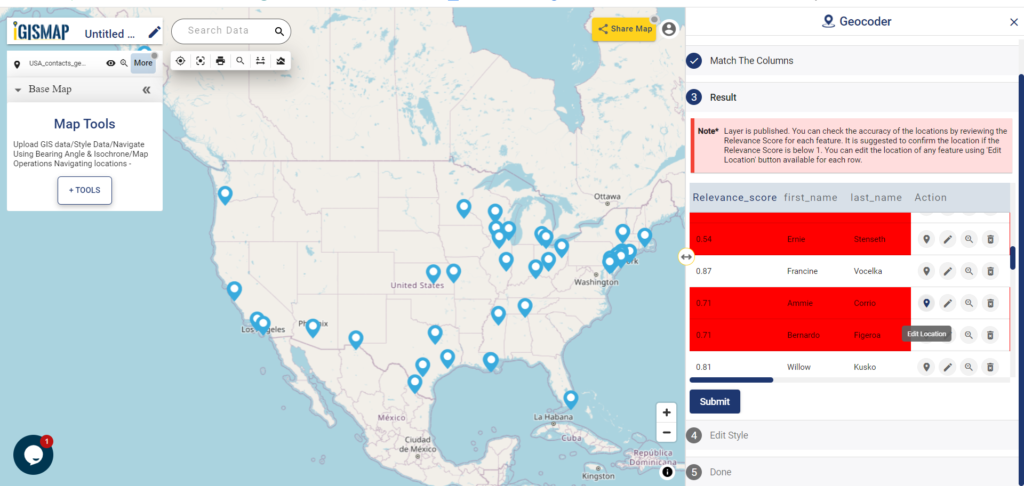
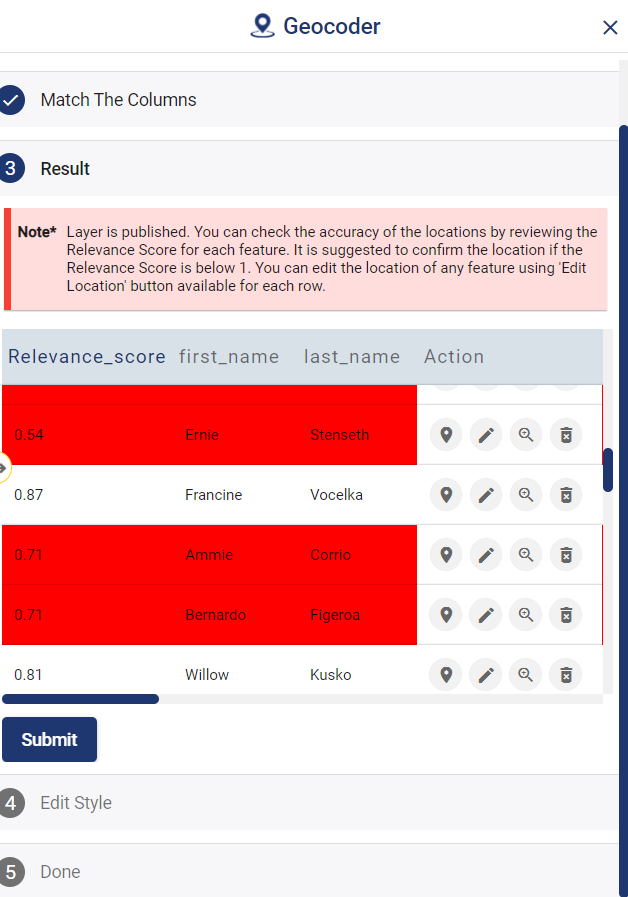
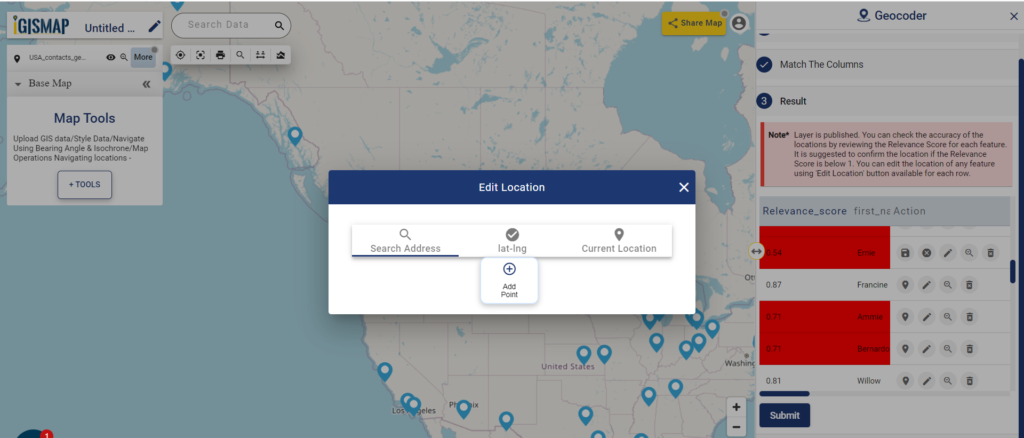
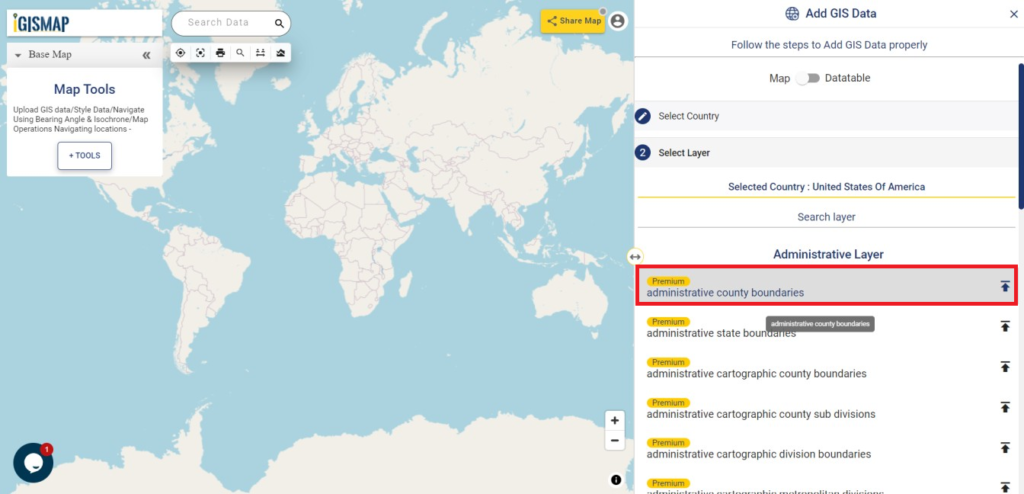
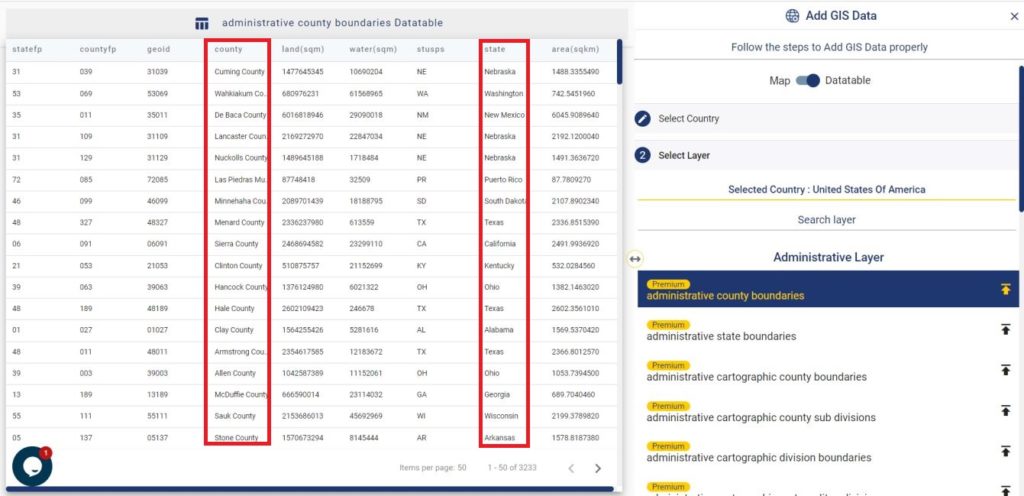
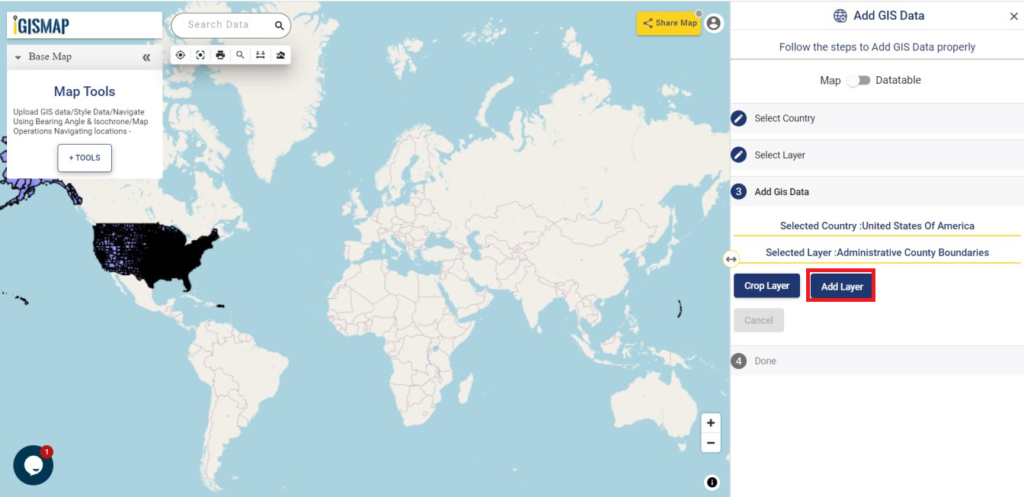
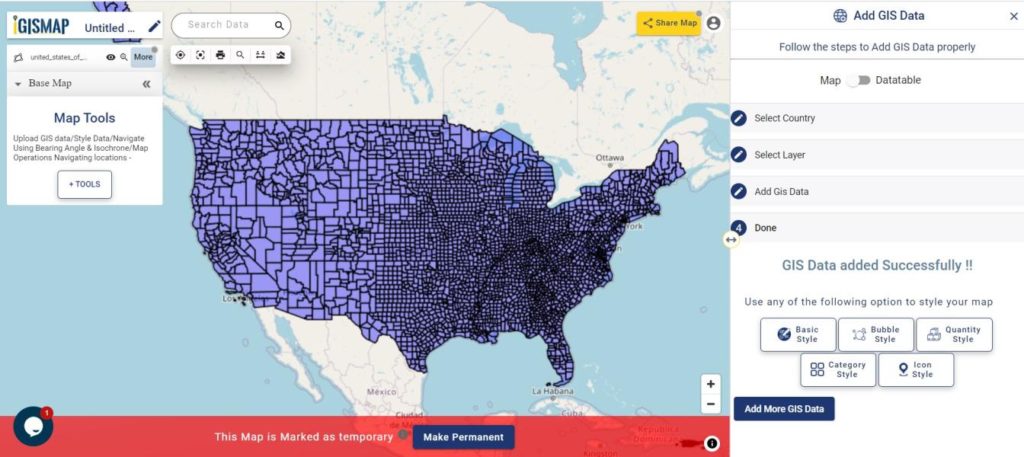
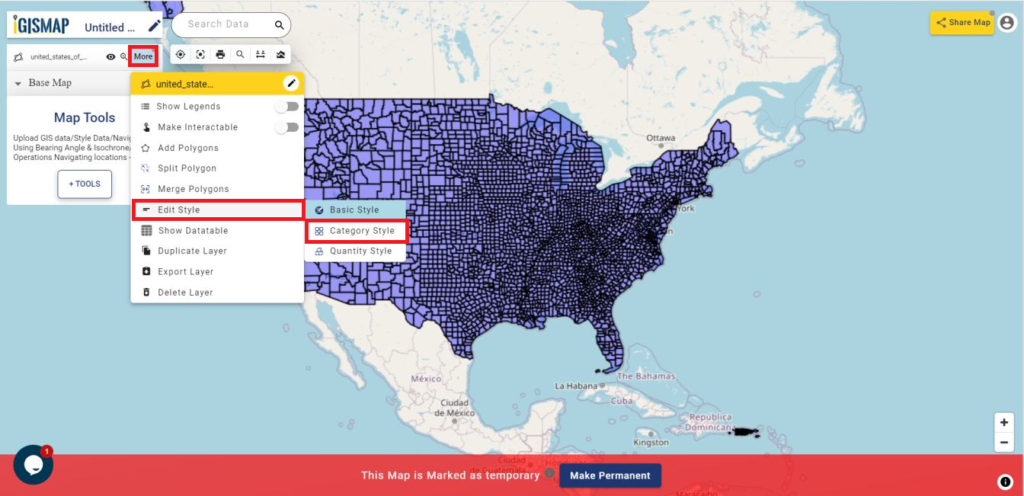
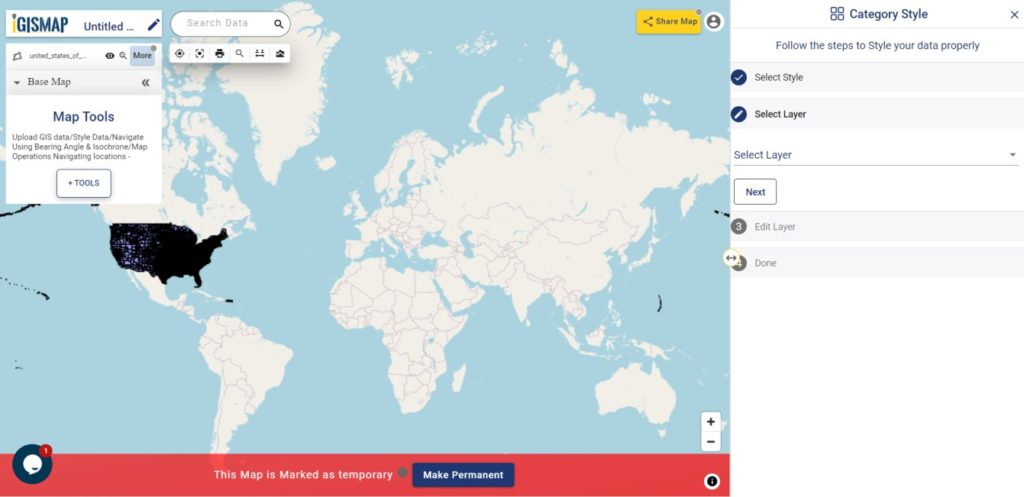
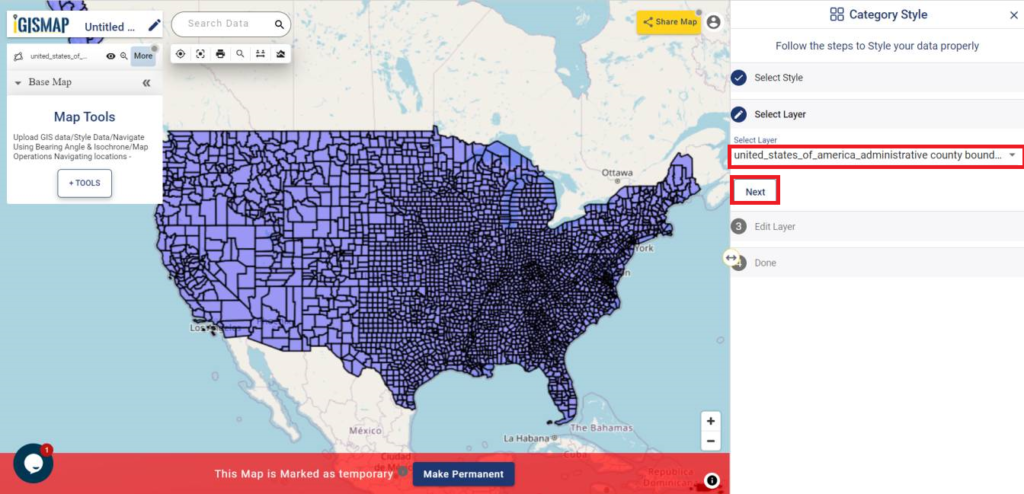
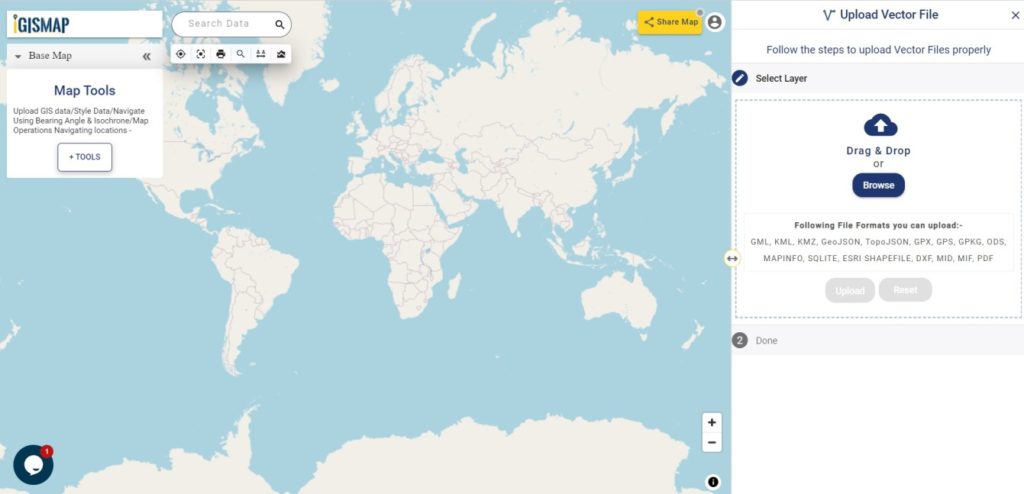
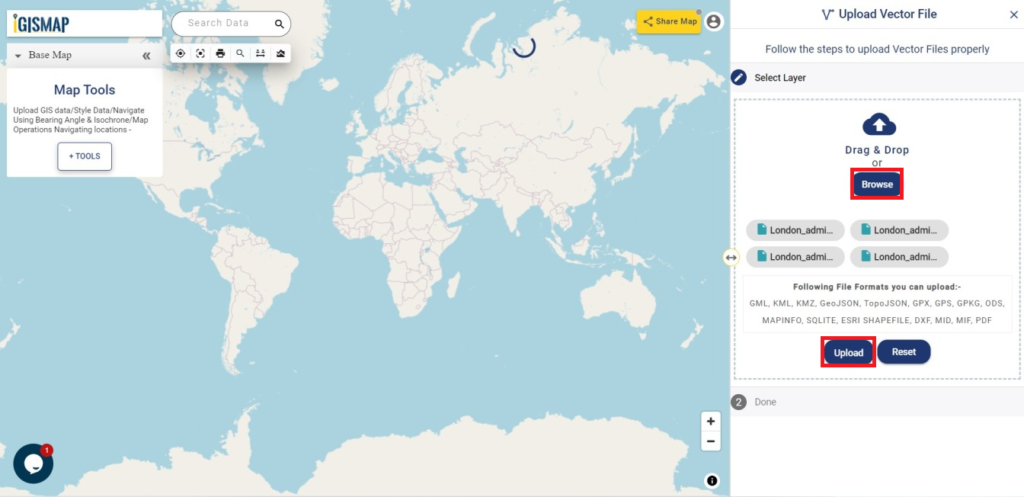
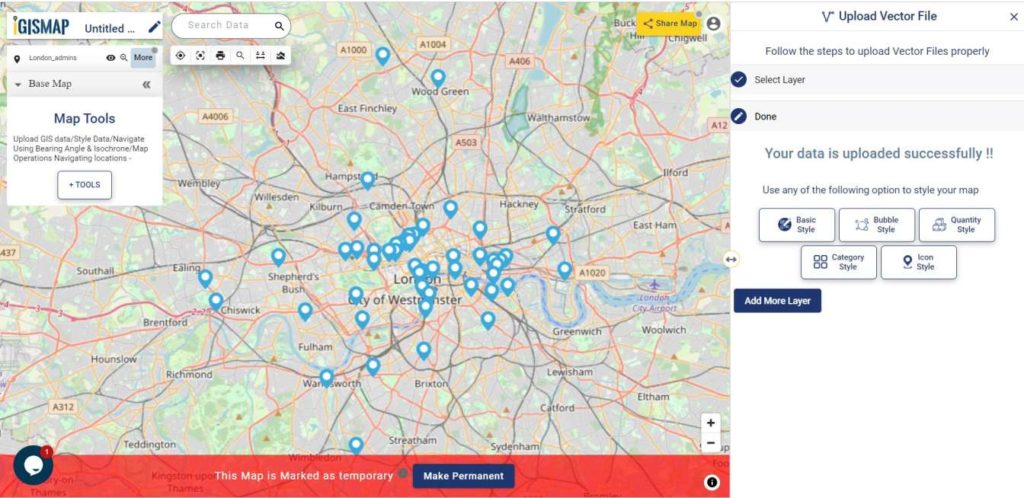
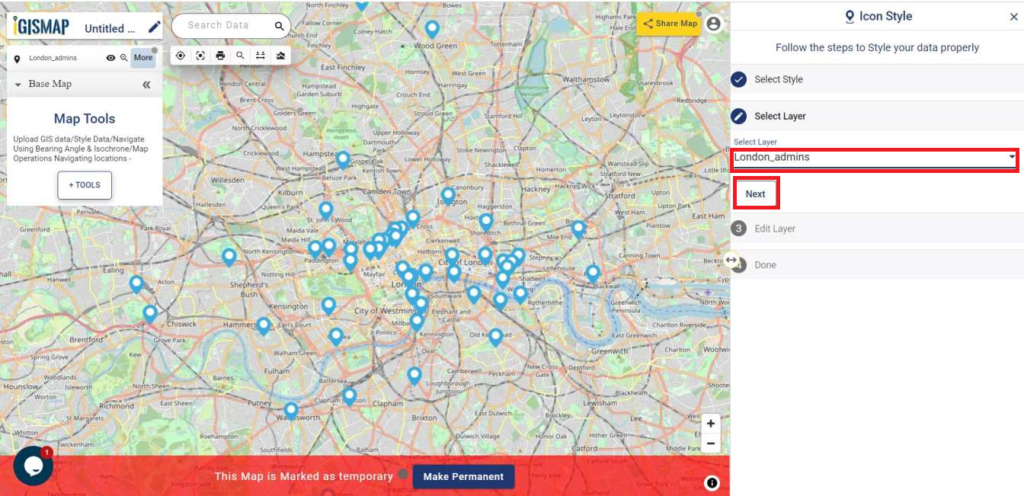
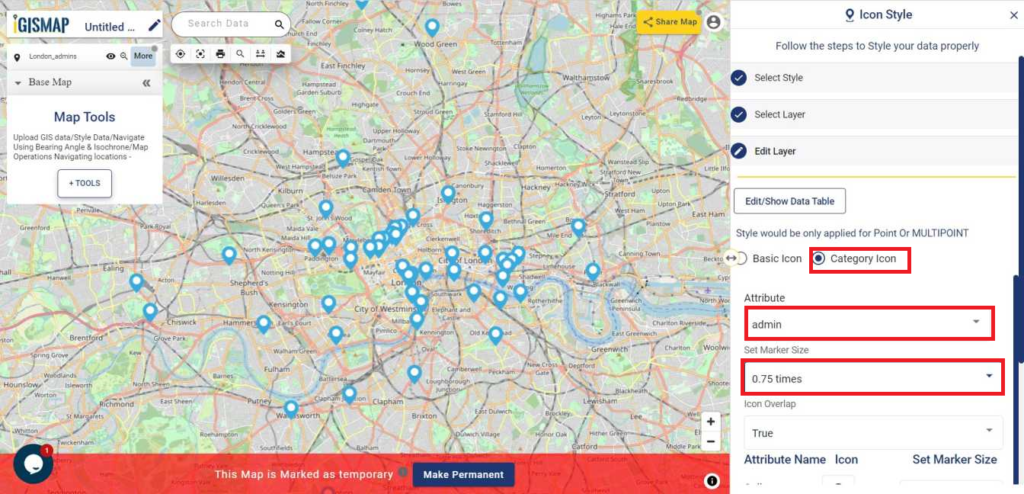
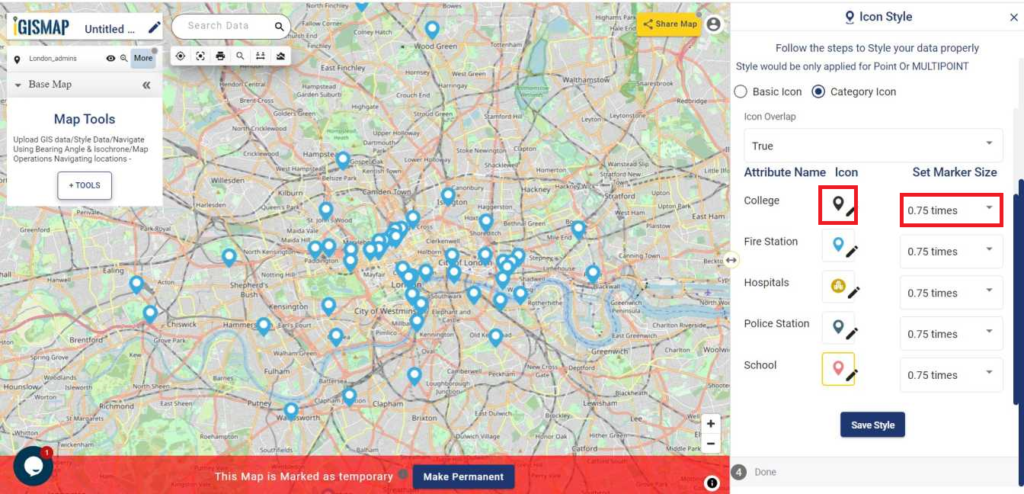
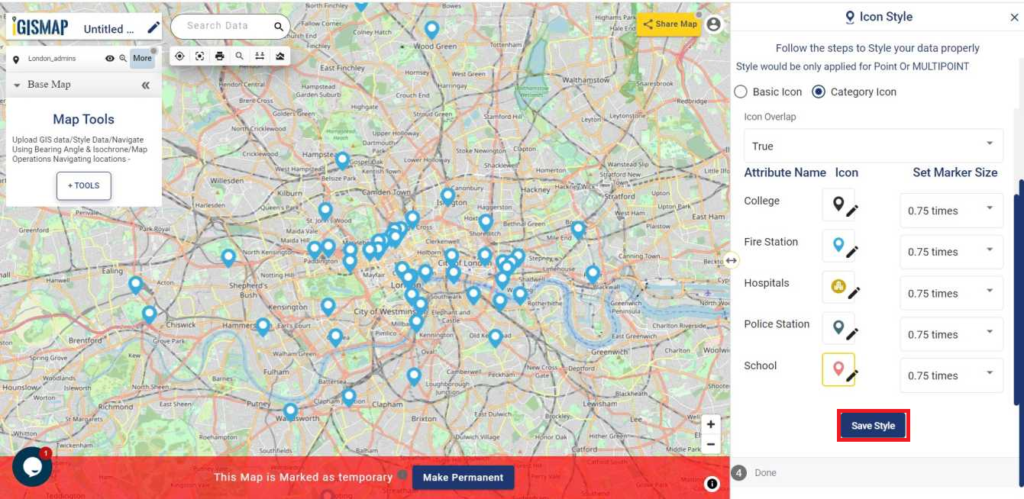
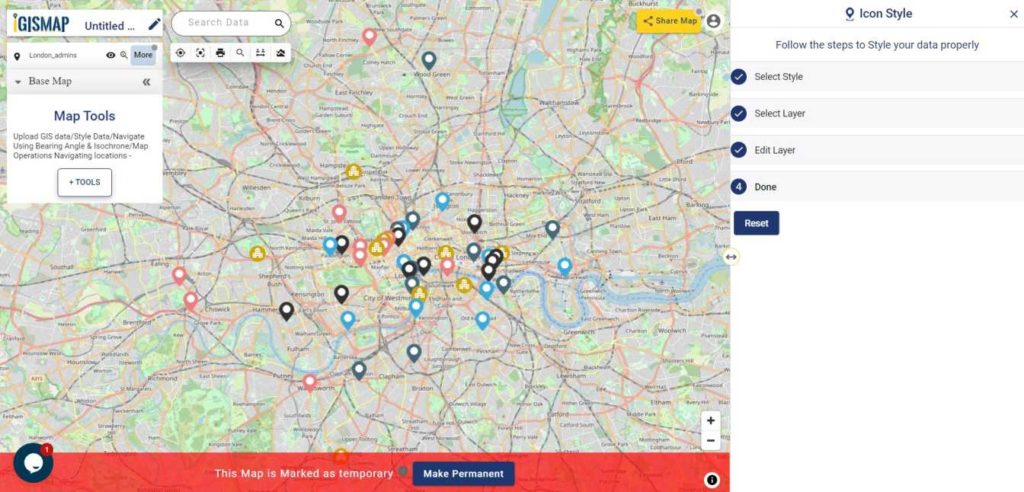
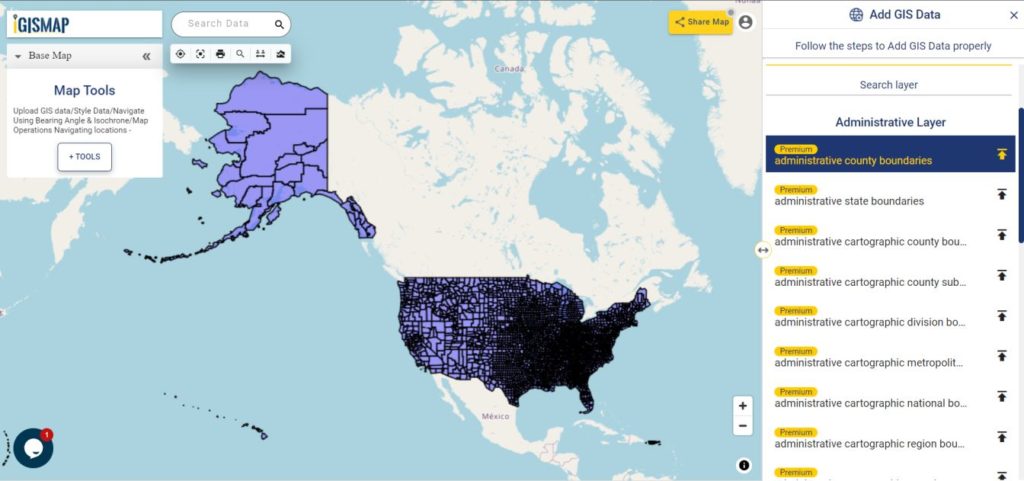
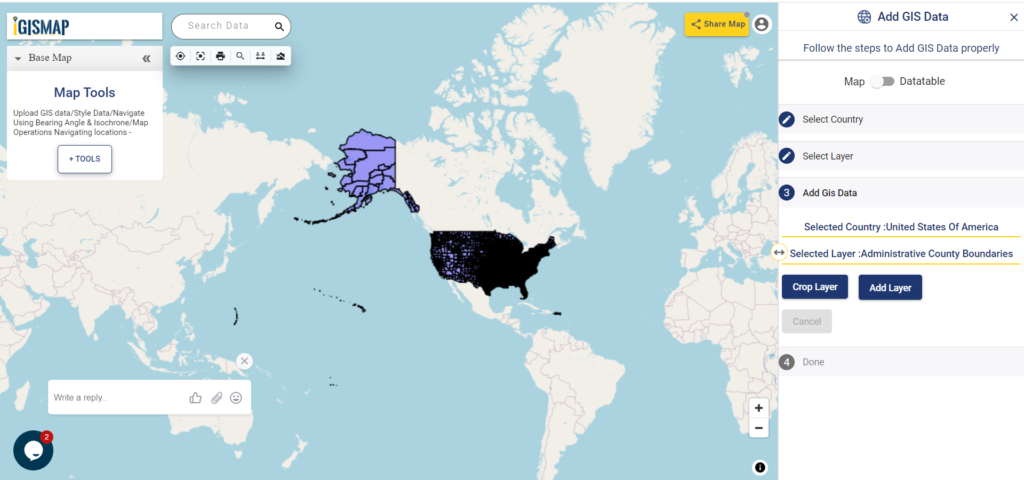
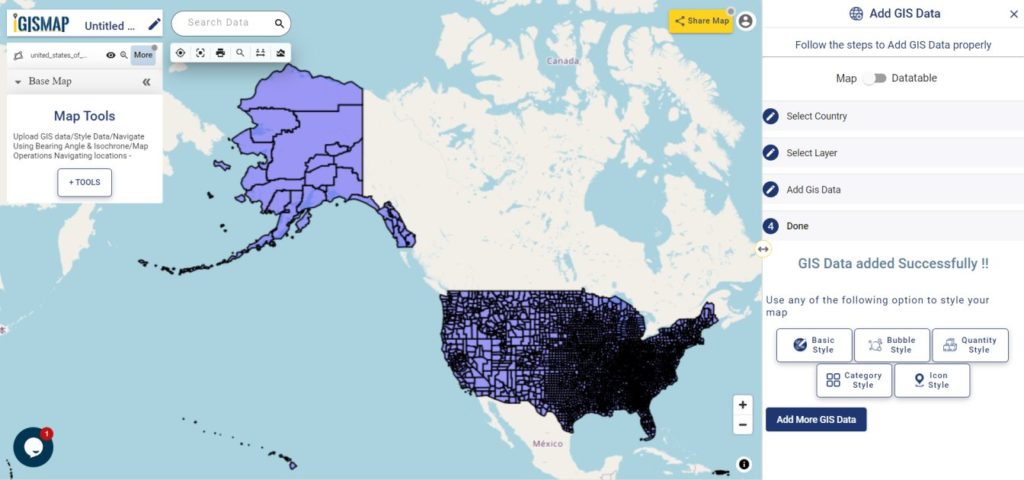
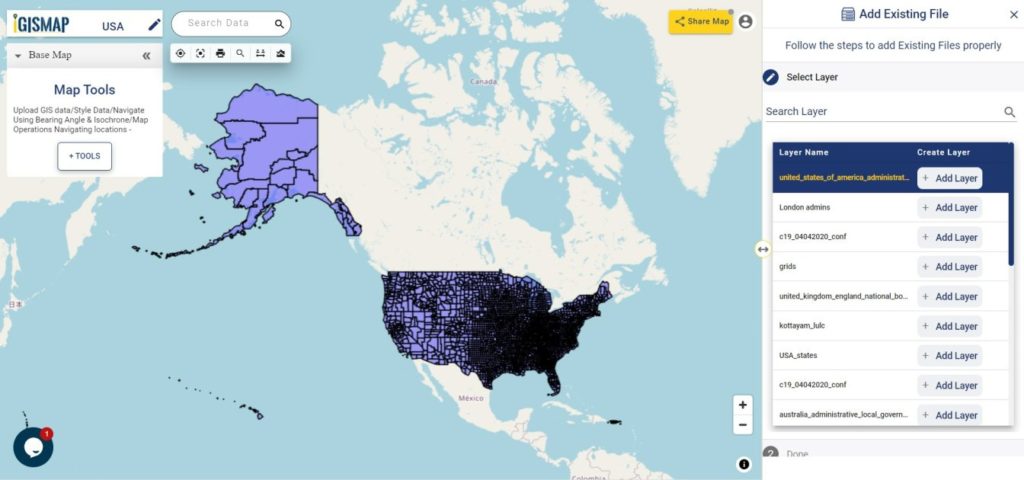
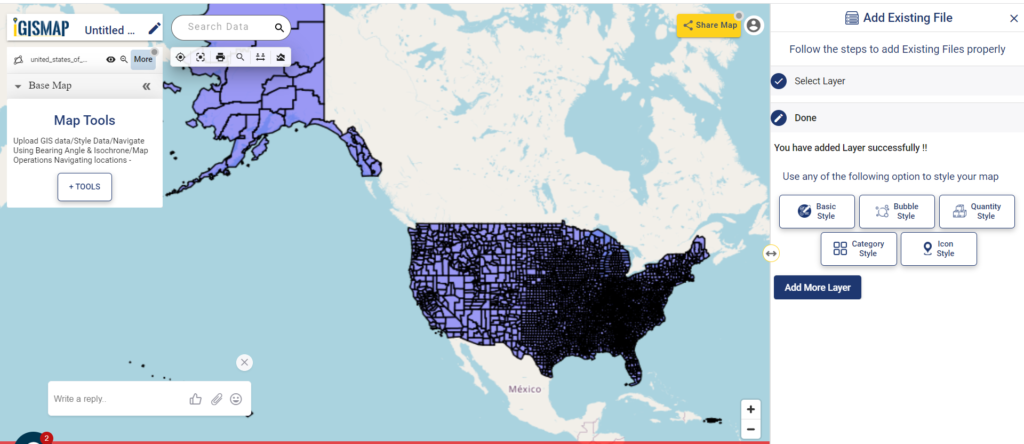
After successfully logging in with a legitimate email address, select the country you want to work with. Next, choose the specific layer you need and click on the download option. Once that’s done, pick the desired format to acquire the essential GIS data. Before proceeding with the data download, make sure to review the data table for any relevant information.
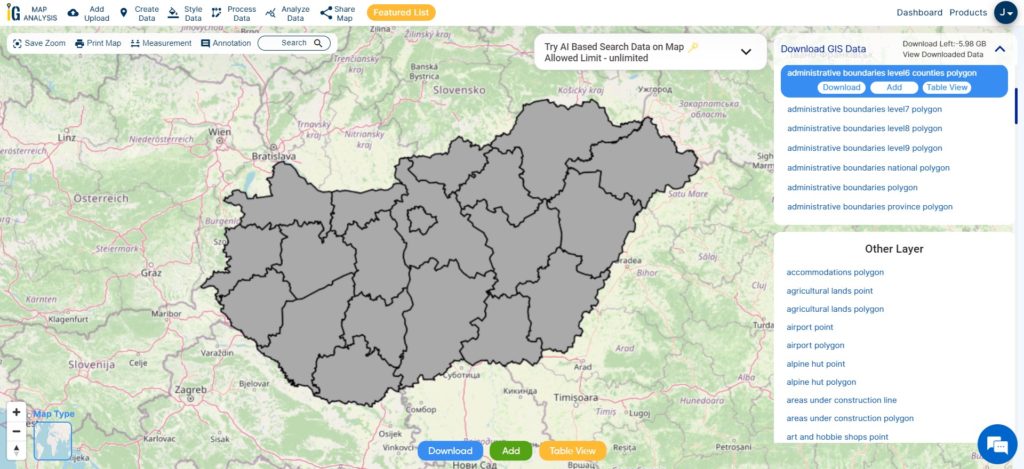
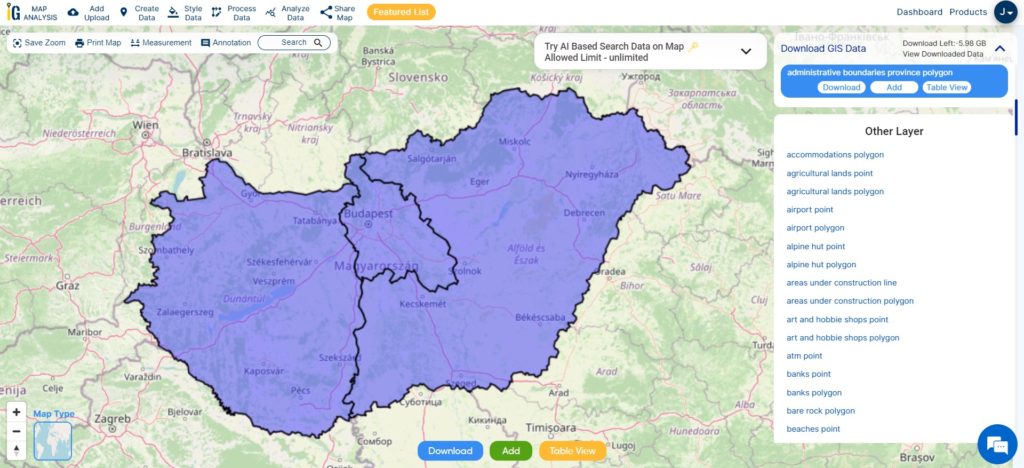
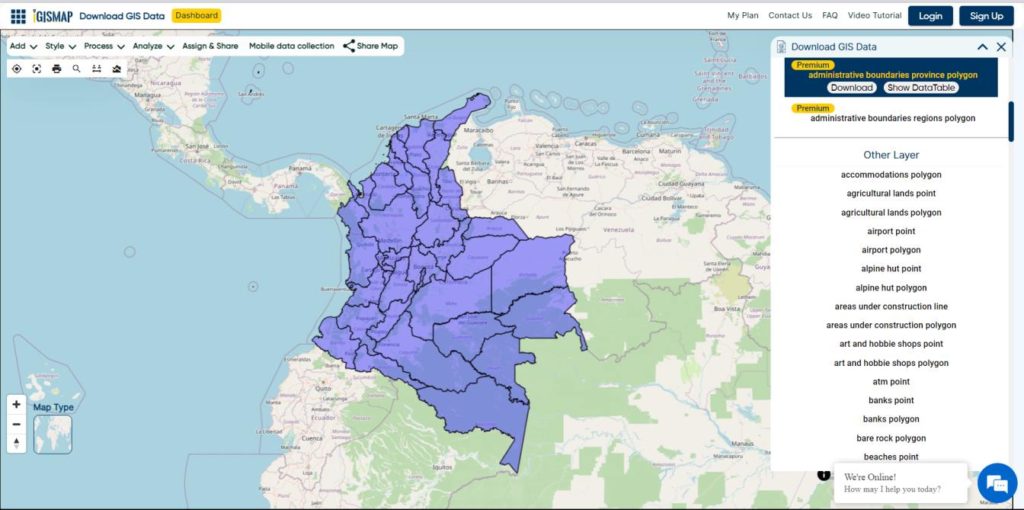
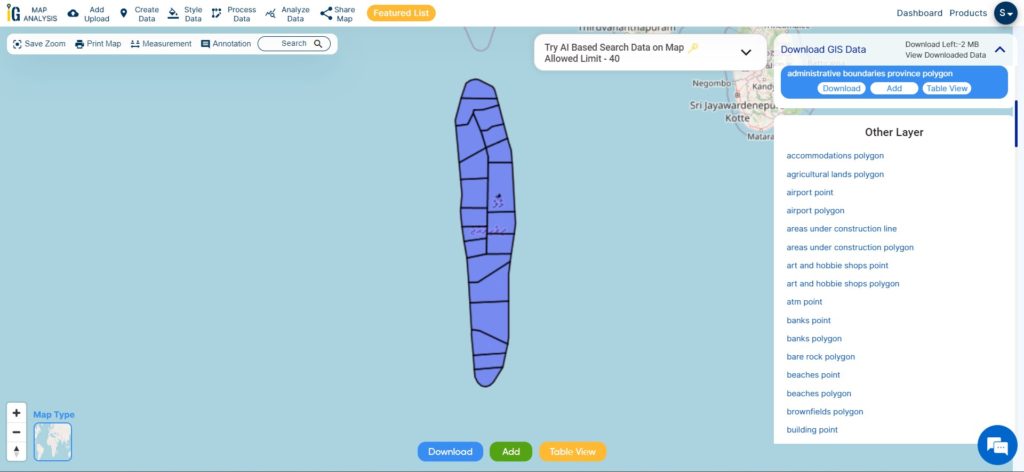
Download Laos Provinces Shapefile Data
Laos, officially known as the Lao People’s Democratic Republic, is divided into 17 provinces (referred to as “khoueng” in Lao) and one prefecture, which is the Vientiane capital city municipality (known as “Na Kone Luang Vientiane” in Lao).
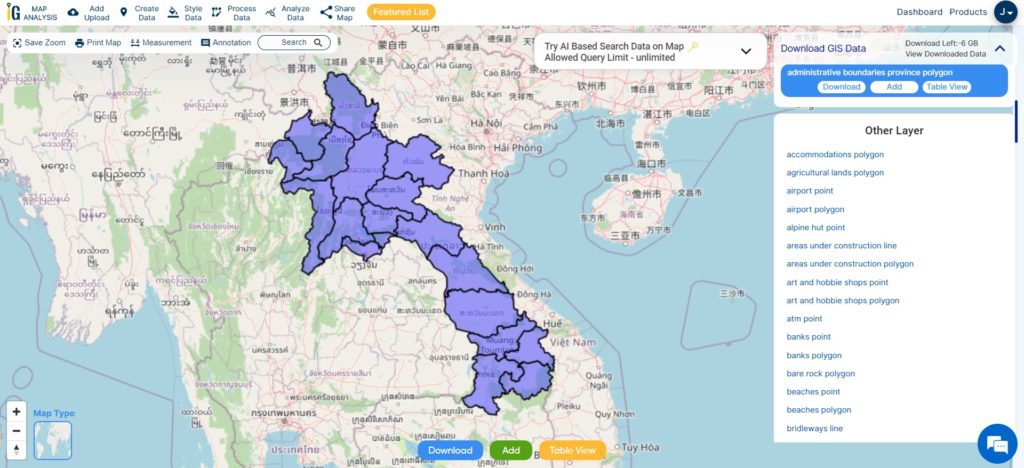
Download Laos Province Boundaries Shapefile
This shapefile covers following Province of Laos listed below:
- Attapeu
- Bokeo
- Bolikhamxay
- Champasak
- Houaphanh
- Khammouane
- Luang Namtha
- Luang Prabang
- Oudomxay
- Phongsaly
- Salavan
- Savannakhet
- Sekong
- Vientiane (capital)
- Vientiane Province
- Xaignabouli
- Xekong
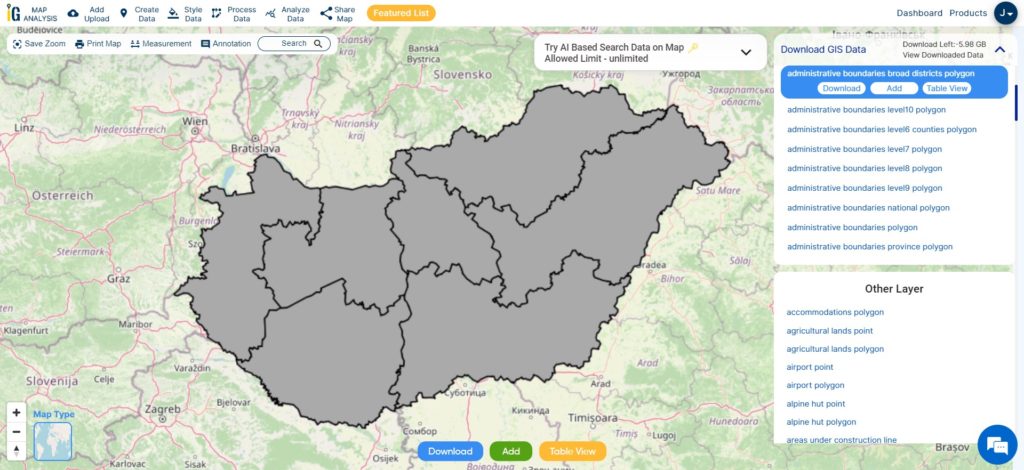
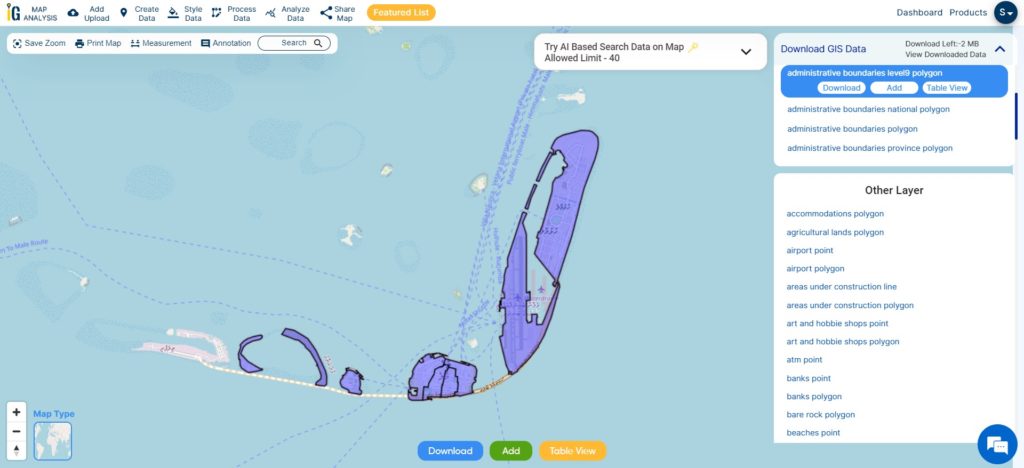
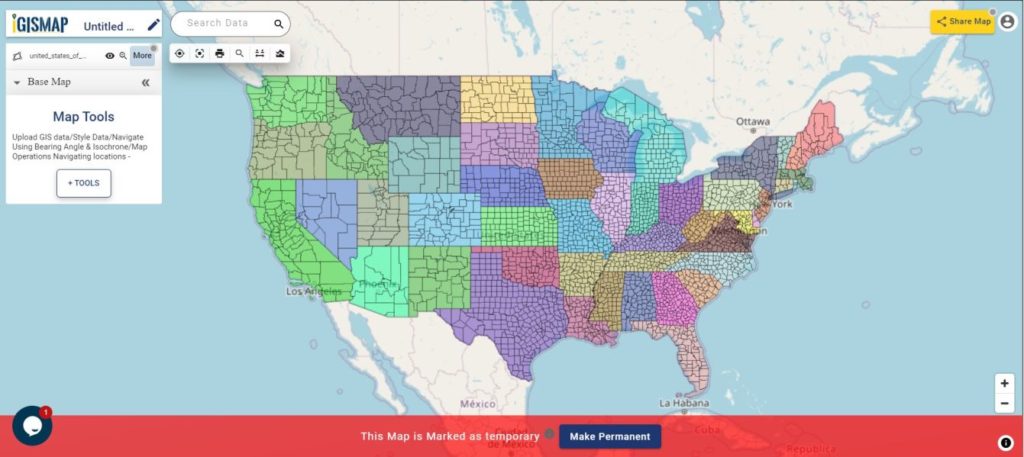
Download Laos District Shapefile Data
Laos is divided into districts, which are administrative subdivisions within the provinces. The number of districts can vary within each province, totaling approximately 141 districts in Laos. Each district is led by a district administrator and is further divided into villages or towns.
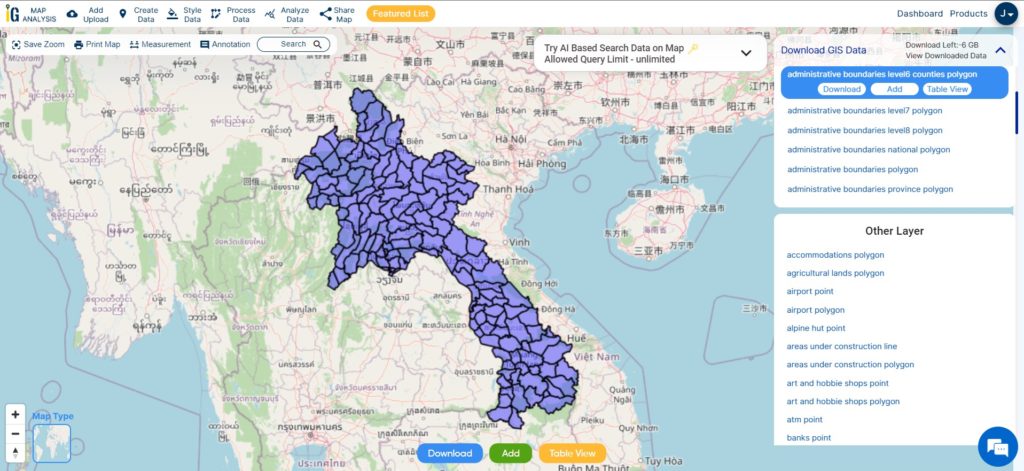
Download Laos District Boundaries Shapefile
Other Administrative Boundary Data:
Other GIS Data:
- Download Laos Airport Point Shapefile
- Download Laos Highway Lines Shapefile
- Download Laos Railway Lines Shapefile
- Download Laos Road Lines Shapefile
Above all links are provided for GIS data of Laos if you are looking for any specific data please write us on support@igismap.com
Download Shapefile for the following:
- World Countries Shapefile
- Australia
- Argentina
- Austria
- Belgium
- Brazil
- Canada
- Denmark
- Fiji
- Finland
- Germany
- Greece
- India
- Indonesia
- Ireland
- Italy
- Japan
- Kenya
- Lebanon
- Madagascar
- Malaysia
- Mexico
- Mongolia
- Netherlands
- New Zealand
- Nigeria
- Papua New Guinea
- Philippines
- Poland
- Russia
- Singapore
- South Africa
- South Korea
- Spain
- Switzerland
- Tunisia
- United Kingdom Shapefile
- United States of America
- Vietnam
- Croatia
- Chile
- Norway
- Maldives
- Bhutan
- Colombia
- Libya
- Comoros
- Hungary
- Laos
- Estonia
- Iraq
- Portugal
- Azerbaijan
- Macedonia
- Romania
- Peru
- Marshall Islands
- Slovenia
- Nauru
- Guatemala
- El Salvador
- Afghanistan
- Cyprus
- Syria
- Slovakia
- Luxembourg
- Jordan
- Armenia
- Haiti And Dominican Republic
Disclaimer : If you find any shapefile data of country provided is incorrect do contact us or comment below, so that we will correct the same in our system as well we will try to correct the same in openstreetmap.