Download Hungary Administrative Boundary Shapefiles – Regions, County and more

IGISMAP introduces Hungary’s comprehensive GIS data collection, featuring administrative boundaries, regions, counties, municipalities, and more in formats like ESRI Shapefile, KML, GeoJSON, and CSV, providing GIS enthusiasts with a wealth of up-to-date geographic information for mapping and analysis.

Exciting news for GIS enthusiasts! IGISMAP has just released GIS data collection sets for over 100 countries. Hungary is one among the 100 new countries that is published with updated GIS data representing almost all geographic and administrative features such as waterbodies, road lines, airport locations etc. GIS data of different levels of administrative divisions are also made available for Hungary. GIS data can be downloaded in ESRI Shapefile, KML, GeoJSON, and CSV etc. The links provided in this article will allow easy access to the data in IGIMAP Download GIS Data tool . Don’t miss this opportunity to enhance your mapping projects with up-to-date Hungary GIS data. Happy exploring!

Note:

  • All data available are in GCS datum EPSG:4326 WGS84 CRS (Coordinate Reference System).
  • You need to login for downloading the shapefile.

Here is the video tutorial to download data:

Download Shapefile Data of Hungary

Hungary, a landlocked country in Central Europe, boasts a geography as diverse as its rich history and culture. From the meandering Danube River to the picturesque Carpathian Mountains, Hungary’s landscape offers a captivating blend of natural wonders and breathtaking vistas.

The administrative structure of Hungary is organized into seven statistical regions, each with its unique character and offerings. These regions, such as Central Hungary, Northern Hungary, and Western Transdanubia, play a significant role in the country’s economic and development planning.

Hungary National Boundary

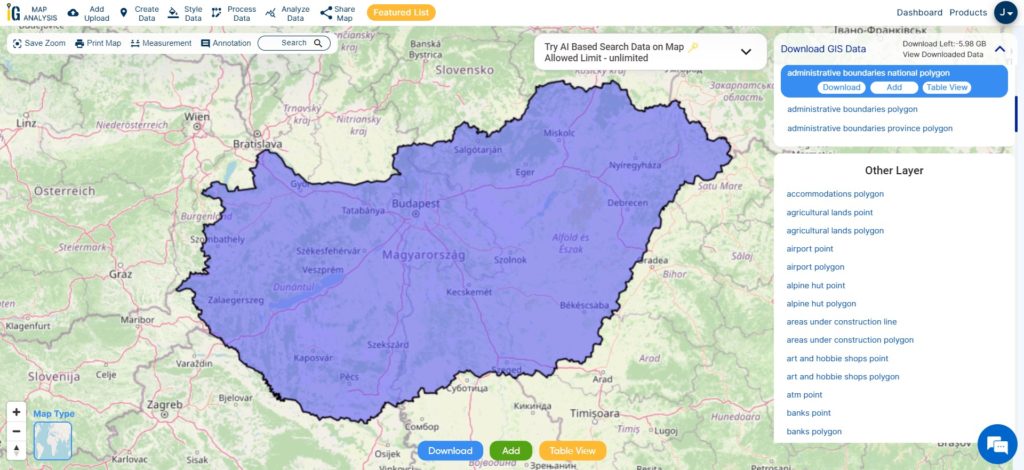
Download Hungary National Boundary Shapefile

After login with your verified email ID, select Hungary from the list of countries, which will open the list of GIS data available. Choose the desired GIS data from the list to preview the data on the map. You can review the GIS data through visualization of data on the map and opening the data table. Click Download button if you wish to download the file. This will open the section to select the file format. After selecting the format from the dropdown, click Download to start downloading the data to your system.

Download Hungary Regions Shapefile Data

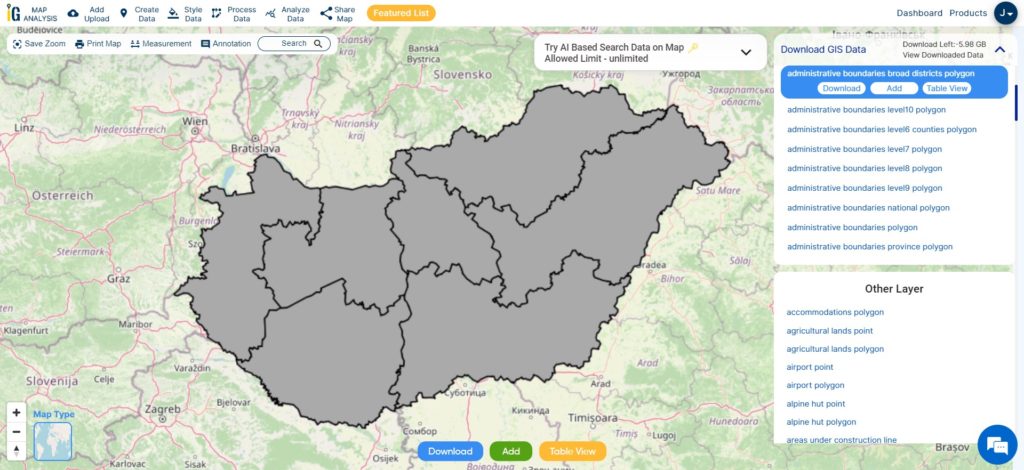
Hungary is divided into seven statistical regions, each offering its own unique charm and attractions. These regions, including Central Hungary, Northern Hungary, and Western Transdanubia, showcase the diverse landscapes, cultural heritage, and historical landmarks that Hungary has to offer. From the vibrant streets of Budapest in Central Hungary to the enchanting caves of Aggtelek in Northern Hungary, each region provides a distinct experience for visitors. The regions of Hungary play a vital role in the country’s economic and development planning, ensuring that the cultural, natural, and historical treasures are preserved and promoted for both locals and tourists to enjoy.

Hungary Region Boundaries

Download Hungary Region Boundaries Shapefile

This shapefile covers following regions of hungary listed below:

  1. Central Hungary (Közép-Magyarország)
  2. Northern Hungary (Észak-Magyarország)
  3. Northern Great Plain (Észak-Alföld)
  4. Southern Great Plain (Dél-Alföld)
  5. Central Transdanubia (Közép-Dunántúl)
  6. Western Transdanubia (Nyugat-Dunántúl)
  7. Southern Transdanubia (Dél-Dunántúl)

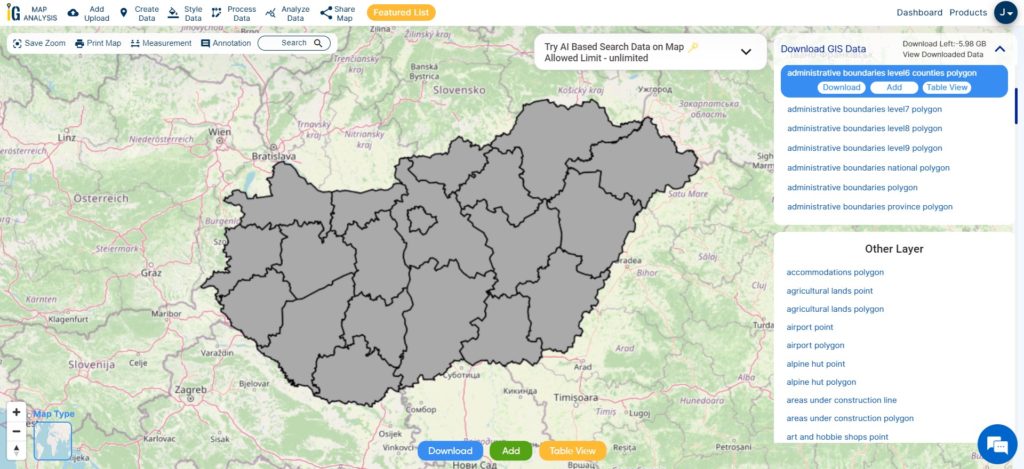
Download Hungary county Shapefile Data

Hungary is further divided into counties, which are administrative divisions that play a crucial role in local governance and regional development. The country is divided into 19 counties, each with its unique characteristics and offerings. From Pest County, home to the bustling capital city of Budapest, to the historical landmarks of Borsod-Abaúj-Zemplén County, each county showcases a blend of natural beauty, cultural heritage, and economic activities.

Click on the link given below

Hungary county Boundaries

Download Hungary county Boundaries Shapefile

This shapefile covers following counties of hungary listed below:

  1. Bács-Kiskun County
  2. Baranya County
  3. Békés County
  4. Borsod-Abaúj-Zemplén County
  5. Csongrád-Csanád County
  6. Fejér County
  7. Győr-Moson-Sopron County
  8. Hajdú-Bihar County
  9. Heves County
  10. Jász-Nagykun-Szolnok County
  11. Komárom-Esztergom County
  12. Nógrád County
  13. Pest County
  14. Somogy County
  15. Szabolcs-Szatmár-Bereg County
  16. Tolna County
  17. Vas County
  18. Veszprém County
  19. Zala County

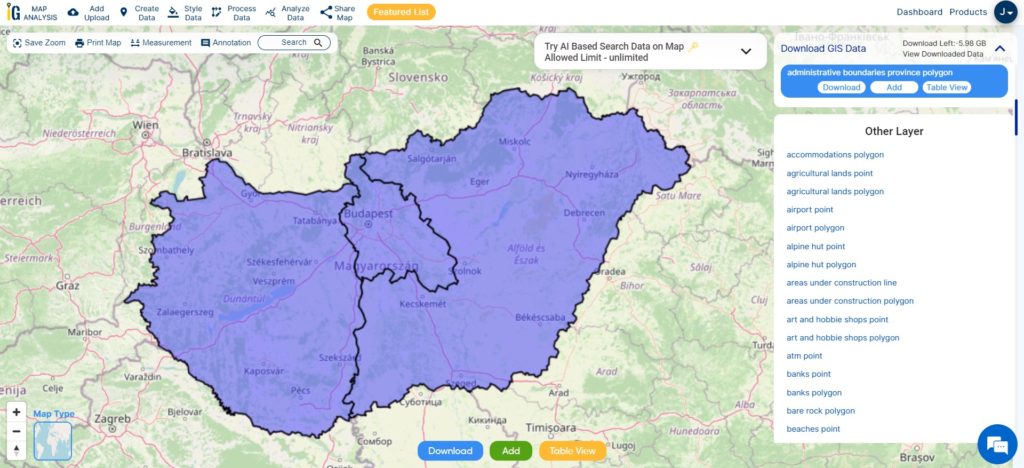
Download Hungary NUTS 1 Statistical Regions Shapefile Data

Hungary’s NUTS 1 statistical regions offer a higher-level classification of the country’s territorial units, facilitating statistical analysis. The three main regions, namely Central Hungary, Transdanubia, and the Great Plain and North, each have distinct characteristics that contribute to Hungary’s geographical and cultural diversity.

Hungary NUTS1 Boundaries

Download Hungary NUTS1 Boundaries Shapefile

This shapefile covers following NUTS1 big statistical regions of hungary listed below:

  1. Central Hungary (Közép-Magyarország)
  2. Transdanubia (Dunántúl)
  3. Great Plain and North (Alföld és Észak)

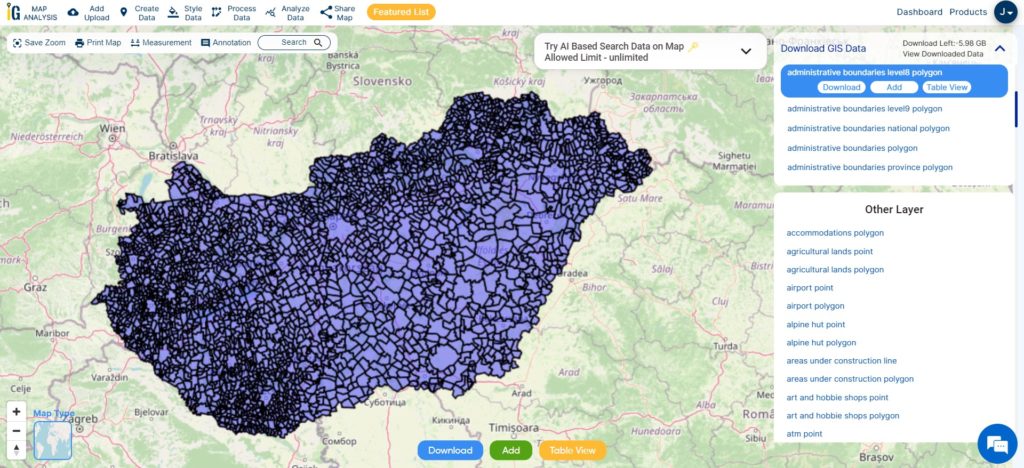
Download Hungary Municipality Shapefile Data

The municipalities of Hungary represent the smallest administrative divisions within the country. With over 3,155 municipalities, they play a vital role in local governance and community development.

Hungary Municipality Boundaries

Download Hungary Municipality Boundaries Shapefile

Other Administrative Boundary Data:

Other GIS Data:

Above all links are provided for GIS data of Hungary if you are looking for any specific data please write us on sales@igismap.com

Download Shapefile for the following:

  1. World Countries Shapefile
  2. Australia
  3. Argentina
  4. Austria
  5. Belgium
  6. Brazil
  7. Canada
  8. Denmark
  9. Fiji
  10. Finland
  11. Germany
  12. Greece
  13. India
  14. Indonesia
  15. Ireland
  16. Italy
  17. Japan
  18. Kenya
  19. Lebanon
  20. Madagascar
  21. Malaysia
  22. Mexico
  23. Mongolia
  24. Netherlands
  25. New Zealand
  26. Nigeria
  27. Papua New Guinea
  28. Philippines
  29. Poland
  30. Russia
  31. Singapore
  32. South Africa
  33. South Korea
  34. Spain
  35. Switzerland
  36. Tunisia
  37. United Kingdom Shapefile
  38. United States of America
  39. Vietnam
  40. Croatia
  41. Chile
  42. Norway
  43. Maldives
  44. Bhutan
  45. Colombia
  46. Libya
  47. Comoros
  48. Hungary
  49. Laos
  50. Estonia
  51. Iraq
  52. Portugal
  53. Azerbaijan
  54. Macedonia
  55. Romania
  56. Peru
  57. Marshall Islands
  58. Slovenia
  59. Nauru
  60. Guatemala
  61. El Salvador
  62. Afghanistan
  63. Cyprus
  64. Syria

Disclaimer : If you find any shapefile data of country provided is incorrect do contact us or comment below, so that we will correct the same in our system as well we will try to correct the same in openstreetmap.
Download Colombia Administrative Boundary Shapefiles – National , Provinces and more

Download Colombia Shapefile Maps – Colombia National Boundary, Colombia Provinces, Roads, Airports, Railway & Highway Lines

Have you been hunting GIS data too long and couldn’t find the right data or a proper data collection hub for fulfilling your requirements? Worry no more, IGISMAP GIS solutions offer a comprehensive collection of GIS data for over 150 countries, providing access to more than 150 datasets per country. Each dataset is carefully curated and accurately represents the administrative divisions of the respective countries. IGISMAP provides two essential tools for accessing this data: the Download GIS Data and Add GIS Data functionalities. Users can download the data in multiple formats, including ESRI Shapefile, KML, GeoJSON, or CSV, depending on their preferences and requirements. The platform ensures that users have a seamless experience in accessing valuable GIS data for their projects. Check the article – Add GIS data from IGISMap GIS data collection to understand more about Add GIS Data.

In this article, we will talk about administrative level GIS data of Colombia and how it can be accessed from Download GIS Data tool. GIS data of almost all natural and man made geographic features are available in IGISMAP for Colombia. This article will give you an overview of all the administrative divisions GIS data available for Colombia.

Note:

  • All data available are in GCS datum EPSG:4326 WGS84 CRS (Coordinate Reference System).
  • You need to login for downloading the shapefile.

Download Free Shapefile Data of Colombia

The geography of Colombia is characterized by its six main natural regions that present their own unique characteristics, from the Andes mountain range region shared with Ecuador and Venezuela; the Pacific Coastal region shared with Panama and Ecuador; the Caribbean coastal region shared with Venezuela and Panama; the Llanos (plains) shared with Venezuela; the Amazon rainforest region shared with Venezuela, Brazil, Peru and Ecuador; to the insular area, comprising islands in both the Atlantic and Pacific oceans. It share its maritime limits with Costa Rica, Nicaragua, Honduras, Jamaica, Haiti, and the Dominican Republic.

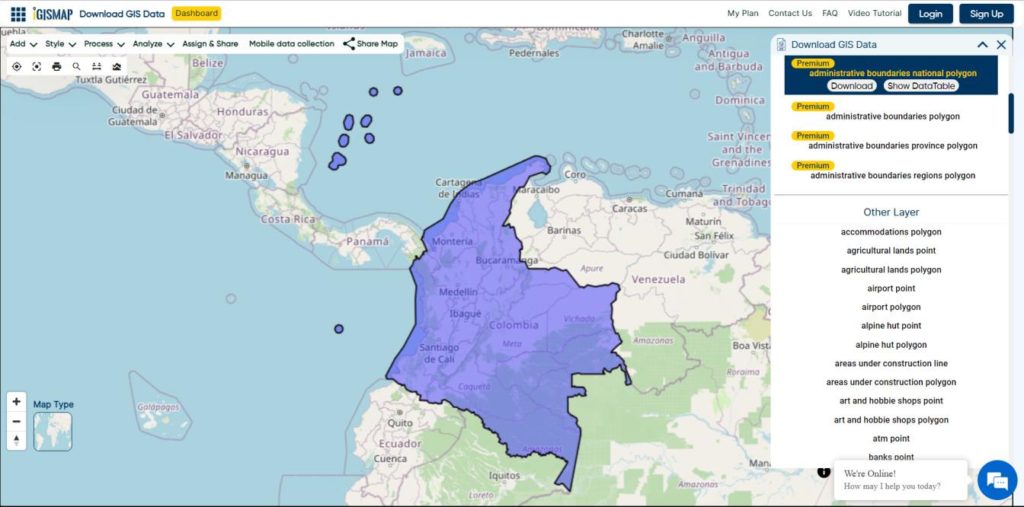
Colombia National Boundary

Download Colombia National Boundary Shapefile

Download Colombia Provinces Shapefile Data

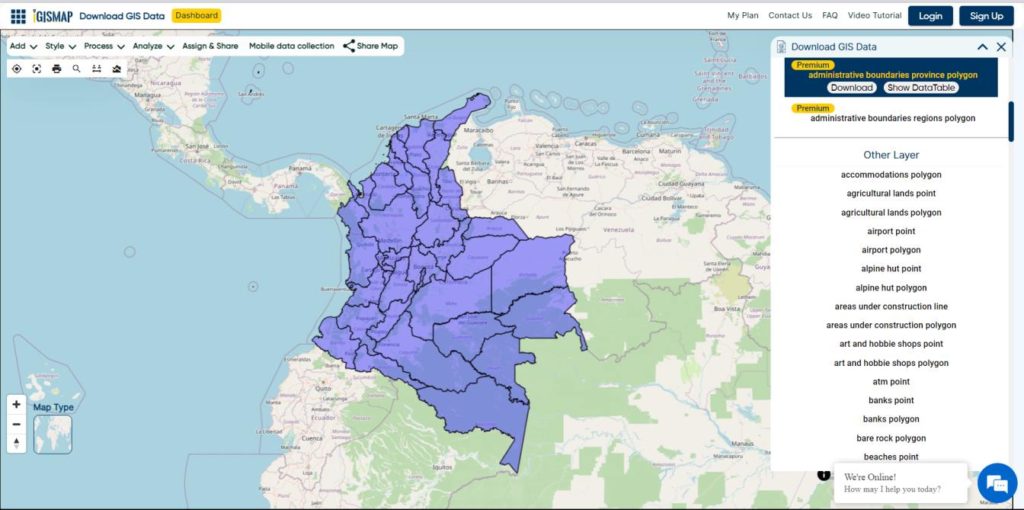
Colombia is divided into 32 provinces

Colombia Provinces Boundaries

Download Colombia Provinces Boundaries Shapefile

Other GIS Data:

Download Shapefile for the following:

  1. World Countries Shapefile
  2. Australia
  3. Argentina
  4. Austria
  5. Belgium
  6. Brazil
  7. Canada
  8. Denmark
  9. Fiji
  10. Finland
  11. Germany
  12. Greece
  13. India
  14. Indonesia
  15. Ireland
  16. Italy
  17. Japan
  18. Kenya
  19. Lebanon
  20. Madagascar
  21. Malaysia
  22. Mexico
  23. Mongolia
  24. Netherlands
  25. New Zealand
  26. Nigeria
  27. Papua New Guinea
  28. Philippines
  29. Poland
  30. Russia
  31. Singapore
  32. South Africa
  33. South Korea
  34. Spain
  35. Switzerland
  36. Tunisia
  37. United Kingdom Shapefile
  38. United States of America
  39. Vietnam
  40. Norway
  41. Chile
  42. Crotia
  43. Estonia
  44. Laos
  45. Hungary
  46. Libya
  47. Comoros
  48. Bhutan
  49. Maldives

Disclaimer : If you find any shapefile data of country provided is in correct do contact us or comment below, so that we will correct the same in our system as well we will try to correct the same in OpenStreetMap.

Download Maldives Administrative Boundary GIS Data – Provinces, Atolls and more

IGISMAP introduces the Maldives’ GIS data collection, encompassing administrative boundaries such as national boundaries and atolls, available for download in various formats including ESRI Shapefile, KML, GeoJSON, and CSV, providing GIS enthusiasts with the opportunity to explore and analyze geographic and administrative features for mapping projects.

Exciting news for GIS enthusiasts! IGISMAP has just released GIS data collections for over 100 new countries. You can now access the shapefiles of all essential administrative and other geographical features. The provided links allow you to download the Maldives Administrative Boundary GIS Data in ESRI Shapefile, KML, GeoJSON, and CSV formats.

Note:

  • All data available are in GCS datum EPSG:4326 WGS84 CRS (Coordinate Reference System).
  • You need to login for downloading the shapefile.

Here is the video tutorial to download data:

Download Shapefile Data of Maldives

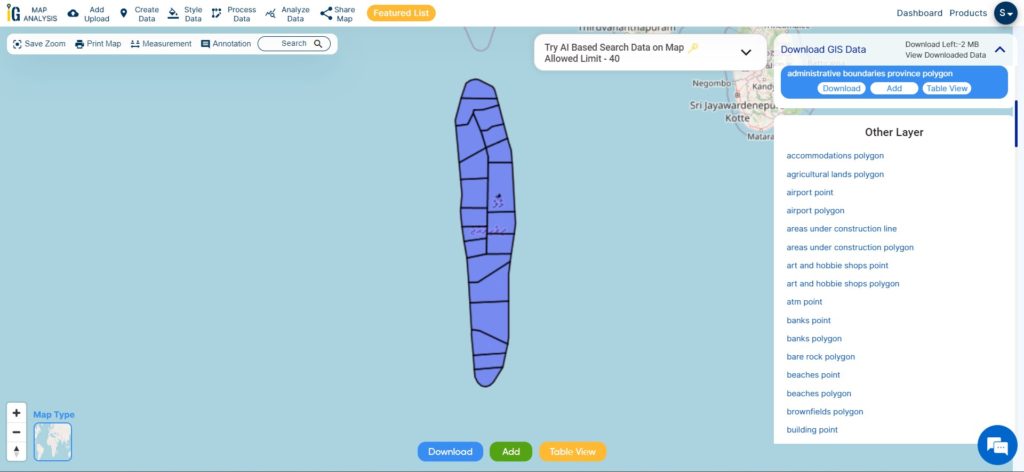
Maldives, officially known as the Republic of Maldives, is a picturesque island nation situated in the Indian Ocean. Comprising a total of 26 atolls, which are formed by more than 1,000 coral islands, Maldives is renowned for its breathtaking beauty, pristine beaches, and crystal-clear turquoise waters.

Geographically, Maldives is located southwest of Sri Lanka and India, spanning an area of approximately 298 square kilometers (115 square miles). The country stretches over 820 kilometers (510 miles) from north to south and 120 kilometers (75 miles) from east to west. The nearest landmass is the Indian Lakshadweep Islands.

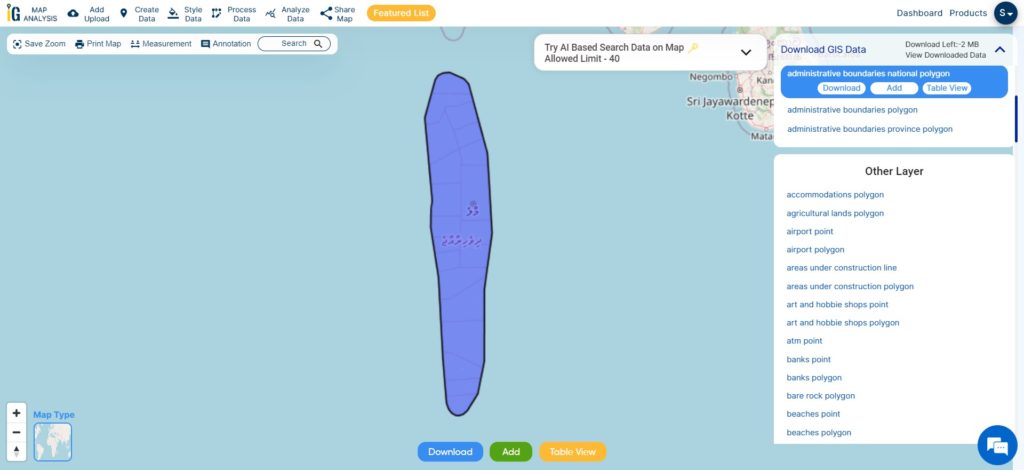
Maldives National Boundary

After logging in with a verified email ID, select the desired country. Next, choose the specific layer and format for the GIS data. Before downloading the Maldives GIS data, you have the option to check the data table for further details. Finally, click on the download button to initiate the download.

Download Maldives National Boundary Shapefile

Download Maldives Atolls Shapefile Data

The Maldives, a tropical paradise in the Indian Ocean, is an archipelago consisting of 26 atolls, which are further divided into 20 administrative atolls. These atolls serve as the country’s primary administrative divisions. Each atoll comprises numerous coral islands, with some atolls boasting more than 200 individual islets. The capital city, Malé, located in the Kaafu Atoll, is not only the political and economic hub of the Maldives but also one of the most densely populated cities in the world. Despite facing challenges from climate change and rising sea levels, the Maldives’ administrative atolls remain a symbol of natural beauty and cultural richness, attracting tourists from around the globe.

Maldives Atolls boundaries

Download Maldives Atoll Shapefile

This shapefile covers following administrative atolls of maldives listed below:

  1. Alifu Alifu Atoll (North Ari Atoll)
  2. Alifu Dhaalu Atoll (South Ari Atoll)
  3. Baa Atoll
  4. Dhaalu Atoll
  5. Faafu Atoll
  6. Gaafu Alifu Atoll (North Huvadhoo Atoll)
  7. Gaafu Dhaalu Atoll (South Huvadhoo Atoll)
  8. Gnaviyani Atoll (Fuvahmulah)
  9. Haa Alifu Atoll (Thiladhunmathi Uthuruburi)
  10. Haa Dhaalu Atoll (Thiladhunmathi Dhekunuburi)
  11. Kaafu Atoll (Male Atoll)
  12. Laamu Atoll
  13. Lhaviyani Atoll
  14. Meemu Atoll
  15. Noonu Atoll
  16. Raa Atoll
  17. Seenu Atoll (Addu Atoll)
  18. Shaviyani Atoll
  19. Thaa Atoll
  20. Vaavu Atoll

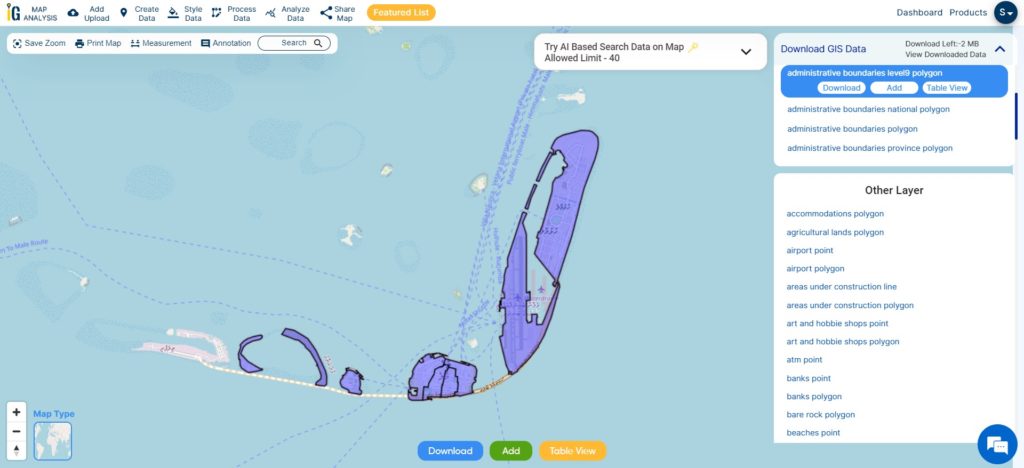
Download  Maldives North Male Atoll Shapefile Data

North Malé Atoll is one of the most popular and frequently visited atolls in the Maldives. Located in the northern part of the archipelago, it is situated close to the capital city of Malé, making it easily accessible for tourists.

The capital city of the Maldives is Malé, and it is not specifically located within the North Malé Atoll. However, Malé is situated in close proximity to the atoll and serves as the central hub for transportation, administration, and commerce in the country. It is located on the southern edge of the North Malé Atoll, which makes it easily accessible from the various resorts and islands within the atoll.

Hulhumalé is a reclaimed island located in the Maldives, situated in the southern part of the North Malé Atoll. It is an artificial island developed as a response to the growing population and urbanization pressures faced by the capital city of Malé. Hulhumalé serves as an extension of the greater Malé area and has become a key residential, commercial, and recreational hub.

Maldives North Male Atoll Boundary

Download Maldives North Male Atoll Shapefile

Other Administrative Boundary Data:

Above all links are provided for GIS data of Maldives if you are looking for any specific data please write us on sales@igismap.com

Download Shapefile for the following:

  1. World Countries Shapefile
  2. Australia
  3. Argentina
  4. Austria
  5. Belgium
  6. Brazil
  7. Canada
  8. Denmark
  9. Fiji
  10. Finland
  11. Germany
  12. Greece
  13. India
  14. Indonesia
  15. Ireland
  16. Italy
  17. Japan
  18. Kenya
  19. Lebanon
  20. Madagascar
  21. Malaysia
  22. Mexico
  23. Mongolia
  24. Netherlands
  25. New Zealand
  26. Nigeria
  27. Papua New Guinea
  28. Philippines
  29. Poland
  30. Russia
  31. Singapore
  32. South Africa
  33. South Korea
  34. Spain
  35. Switzerland
  36. Tunisia
  37. United Kingdom Shapefile
  38. United States of America
  39. Vietnam
  40. Croatia
  41. Chile
  42. Norway
  43. Maldives
  44. Bhutan
  45. Colombia
  46. Libya
  47. Comoros
  48. Hungary
  49. Libya

Disclaimer : If you find any shapefile data of country provided is incorrect do contact us or comment below, so that we will correct the same in our system as well we will try to correct the same in o

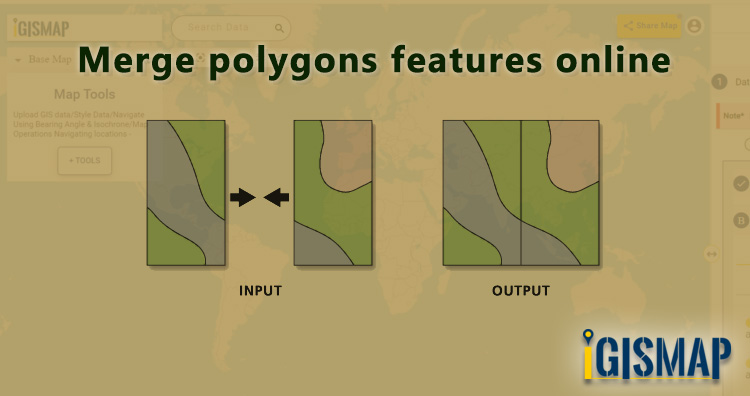
Merge polygons features online using IGISMap

In GIS data, a geographic area is represented in a polygon shape. Geospatial features such as administrative boundaries are digitized in the polygon vector model. In some cases, we need to merge the polygon features based on attribute values or location. After merging, input polygons will merge into a single polygon feature assigned with a single row to store attribute values. When the adjacent polygons with common border lines are merged, they combine to form a single polygon. Through merge functionality, we can create any primary-level administrative boundaries like national boundaries from the secondary level divisions like state or district level boundaries. So here in this article, we are providing steps to merge polygons features online in a single layer.

Merging is a common geoprocessing used in GIS projects for two important cases. One is to merge multiple GIS features into single GIS feature within a GIS data itself. Another application is to merge multiple GIS data into single GIS data. In both cases, geometry entity of the input GIS feature or GIS data should be same ie., either point, polyline or polygon.

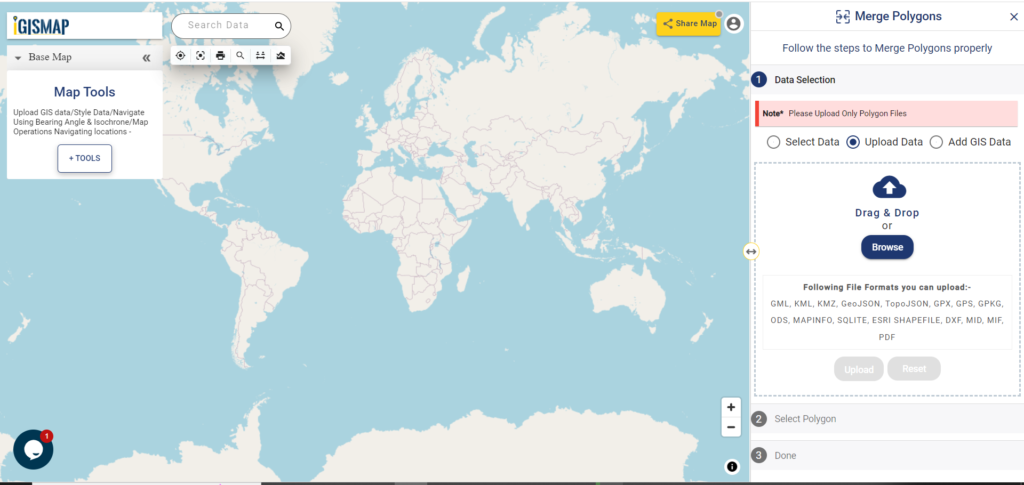
IGISMap provides Merge Polygons tool to merge multiple polygon features of a polygon GIS data into single polygon feature. IGISMap is a GIS-based web platform, that provides multiple GIS applications that are most important in the field of geospatial analytics. The peculiarity of IGISMAP in the GIS Industry is its user interface which helps the user to perform effortless geospatial operations. Merge Polygons tool is very easy to use and you can merge the required polgons in just two steps.

In this article we will create the national boundary of USA by merging the polygons of state boundaries. Without further due, lets dive into Merge Polygons tool.

Click https://map.igismap.com/merge-polygon to open Merge Polygons tool.

Add your data

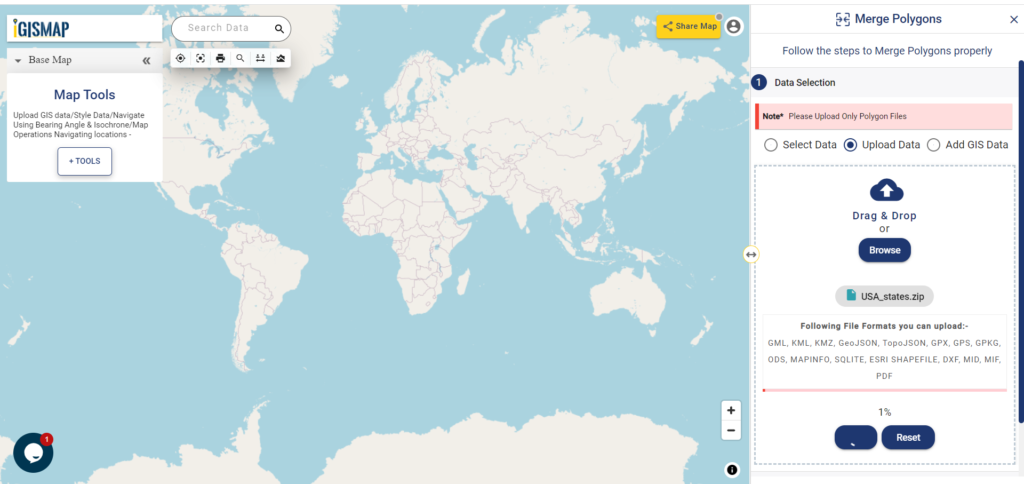
After opening Merge Polygons tool, first step is to add or upload polygon GIS data. Here we will choose Upload Data option to upload the data from your personal computer. Then, click on the Browse button to open the browsing box, where you will choose the file from your pc. In this article, we will be uploading a polygon GIS data of USA state level boundaries.

Upload Data
Upload Data

After opening the file, click the Upload button to start the upload process.

Uploading GIS data
Uploading GIS data

Check the article Add / Upload polygon GIS data and merge required polygon features to understand how to use IGISMap GIS data in Merge Polygons tool.

Select polygons using Lasso Tool

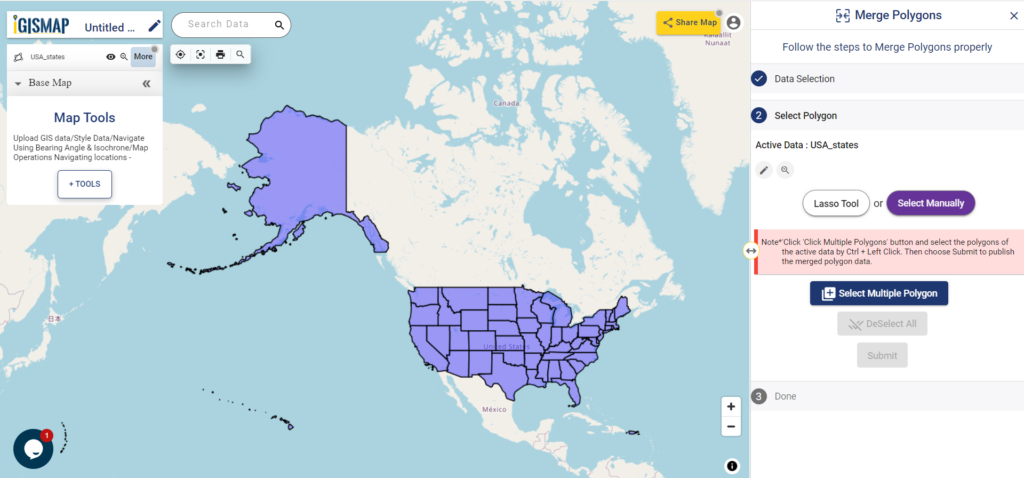
When uploading is complete, polygon GIS data of USA state level boundaries will be published in the map. This data will be selected as the input data for carying out the merge operation.
Select Lasso Tool
Select Lasso Tool

You can access this same data from IGISMap GIS Data collection through Add GIS Data option provided in the Data Selection section.

Click https://map.igismap.com/add-gis to access Add GIS Data tool directly

Click below to download polygon GIS data of USA state level boundaries

Download USA State Level Boundaries Shapefile

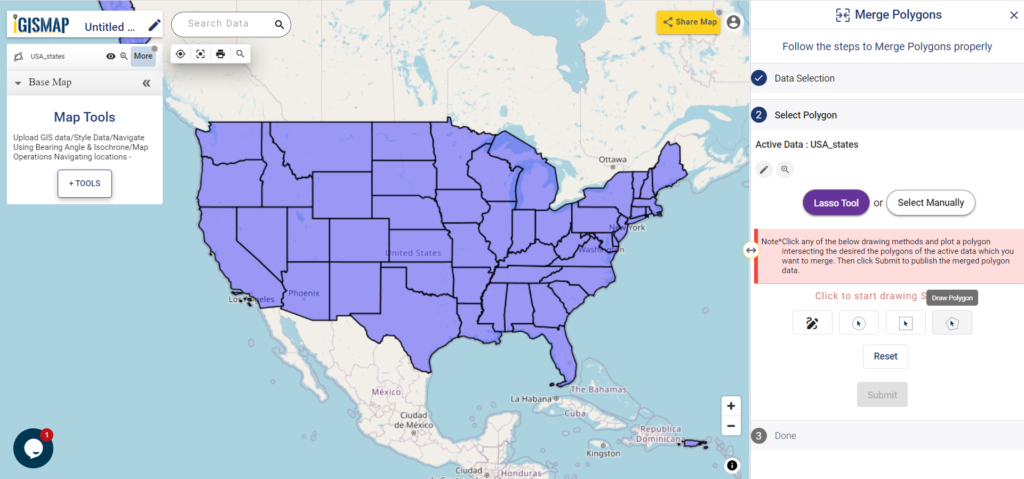
Next step is to select the required polygon features from the input polygon data. IGISMap provides two options to select the polygons. They are – Lasso Tool and Select Manually. Lasso Tool option is suitable to selecte large number of polygon features, hence we will select Lasso Tool tab.

Lasso Tool will open the list of modes to draw a polygon over the required polygon features. These are Draw Polygon With Free Hand, Draw Circle, Draw Rectangle, and Draw Polygon. Select Draw Polygon and draw a polygon intersecting all the polygons of the states.

Draw Polygon using Lasso Tool
Draw Polygon using the Lasso Tool

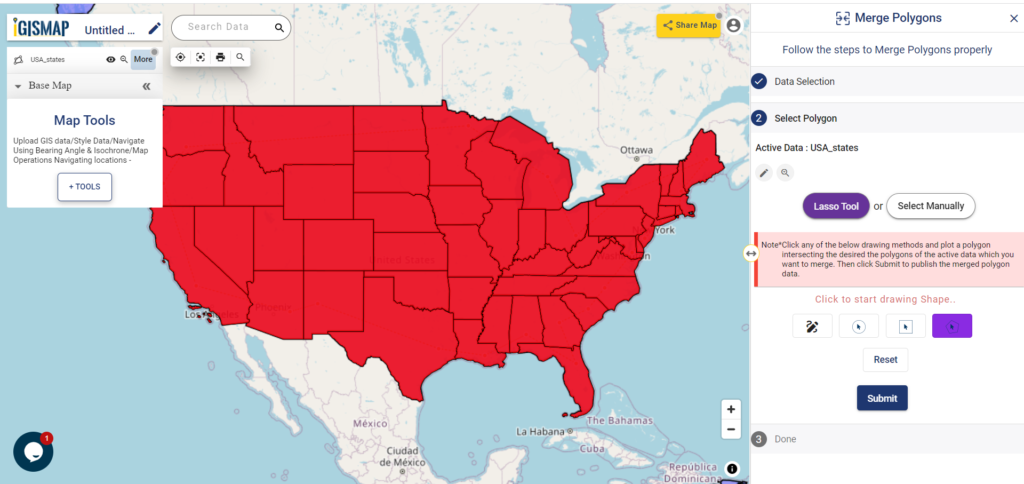
Polygon features of the input polygon GIS data that intersected by the lasso polygon will be selected for merging. Then click Submit to start merging.

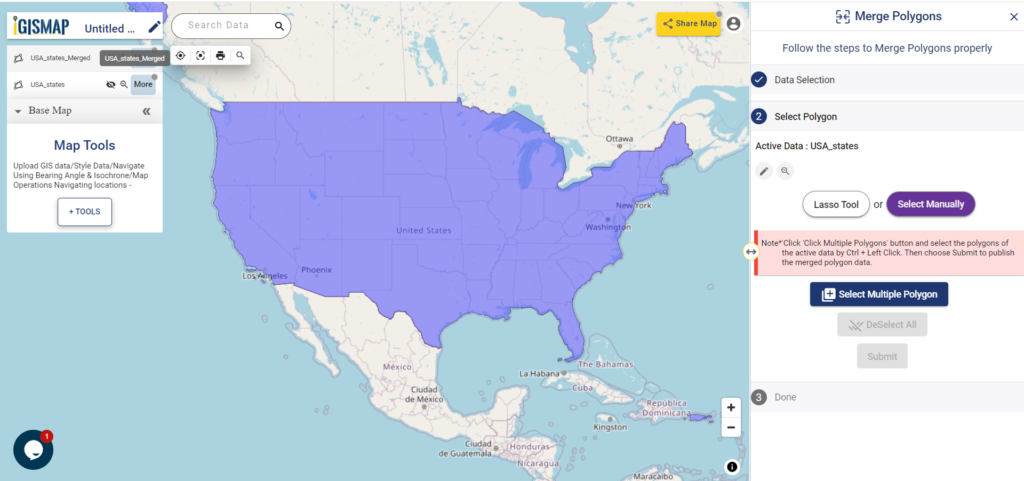
Polygons selected using Lasso tool

Output polygon

After submitting, merged polygon GIS data of USA national ouline boundary is published in the map, as shown below

Merged Layer
Merged Layer

In the above article we uploaded polygon GIS data and merge polygons features online. But if you have point data you can also convert it into polygon by point to polygon conversion feature of IGISMap Tool. This is good if you have point data. If you don’t have data you can Create Point Data using our tool.

Check the article Share your Map to understand the Share Map feature of IGISMap.
Check other articles:
Check the following IGISMap tools:

Add / Upload polygon GIS data and merge required polygon features

For a GIS project, accessing the required data is the first step that determines the further workflow of the project. Online sources either provides the data or provide tools to work with data. There are very few web tools that provides important data and services to work with the data in a single platform. Yes, that is rightIGISMap is one of that kind, where you can find most demanding GIS data in vector formats with a number of tools to carry out analysis and other operations over the GIS data. In the article below we will how to add/upload data and merge polygons. In addition, to merge the feature you can add GIS Data i.e shapefile, kml, kmz, geojson etc.

GIS Data in IGISMap contains administrative boundaries such as country, states, districts, roads, railway lines, and other geographical features such as roads, farmlands, waterbody, etc. IGISMap gis data tool provides you data for 30+ countries, and 51 US states. Also, a few spatial data on a global level are also provided. These data can be directly accessed using Add GIS Data tool from the dashboard or from the map tools. Add GIS Data is also made available in certain IGISMap tools to help users access GIS data directly within the tool itself.

In Merge Polygons tool, Add GIS Data option is provided to access polygon GIS data of various administrative level boundaries of each country. Users can add any polygon data from IGISMap collection and merge the required polygon features. In this article we are going to see how this is done.

Click https://map.igismap.com/merge-polygon to open the Merge Polygons tool or click Merge Polygons tab from the dashboard.

Add/Upload GIS Data

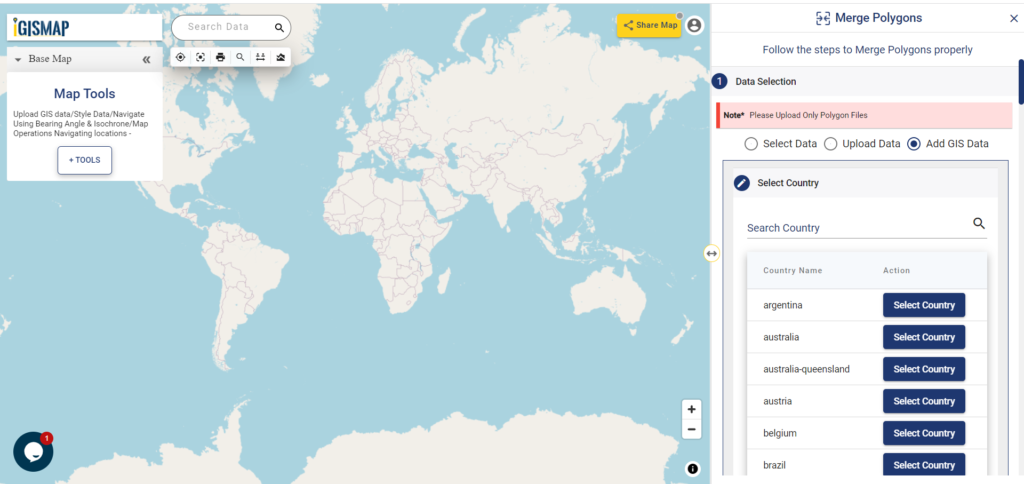
There are multiple options in Merge Polygons tool to add the input data. In this article, we will select Add GIS Data option to add the required data from IGISMap data collection. For demonstration, we will use the GIS data of local government area boundaries of South Australia. Thus we will select Australia from the Select Country list.

Add/Upload data and merge polygons
Add GIS Data – Select Country

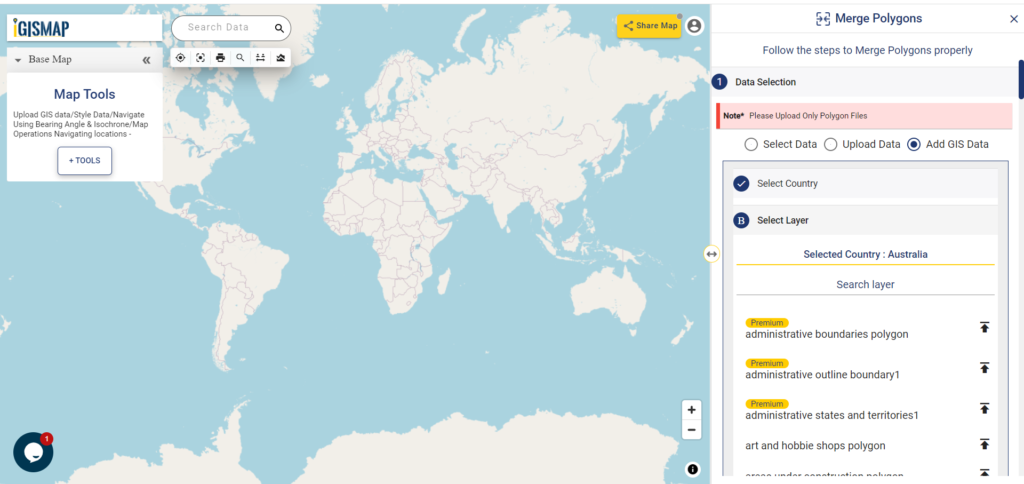
After selecting the country, list of GIS data associated with Australia will open.

Add/Upload data and merge polygons
Add GIS Data – Select Layer

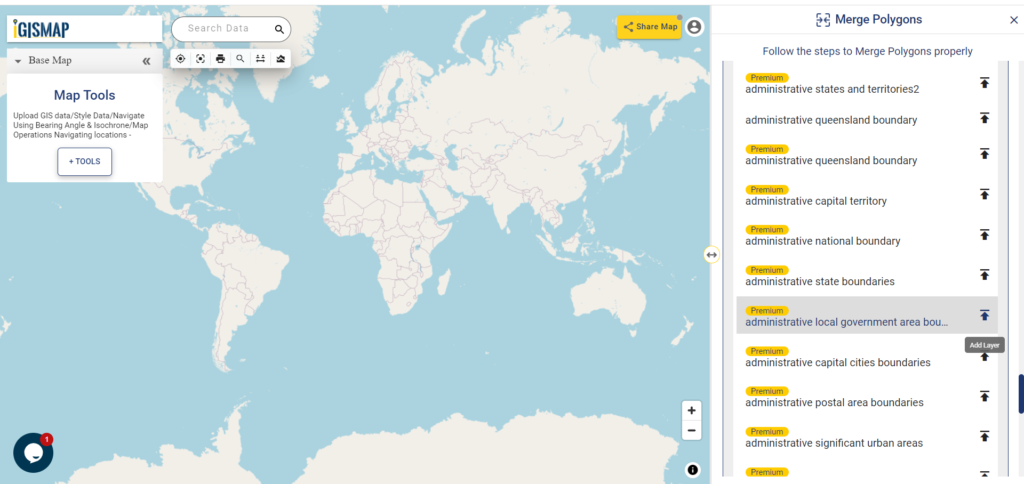
Scroll down or search for local government area in the search bar to filter the list to the required data. Select administrative local government area boundaries data from the list and click Add Layer icon.

Local Government Area Boundaries of Australia

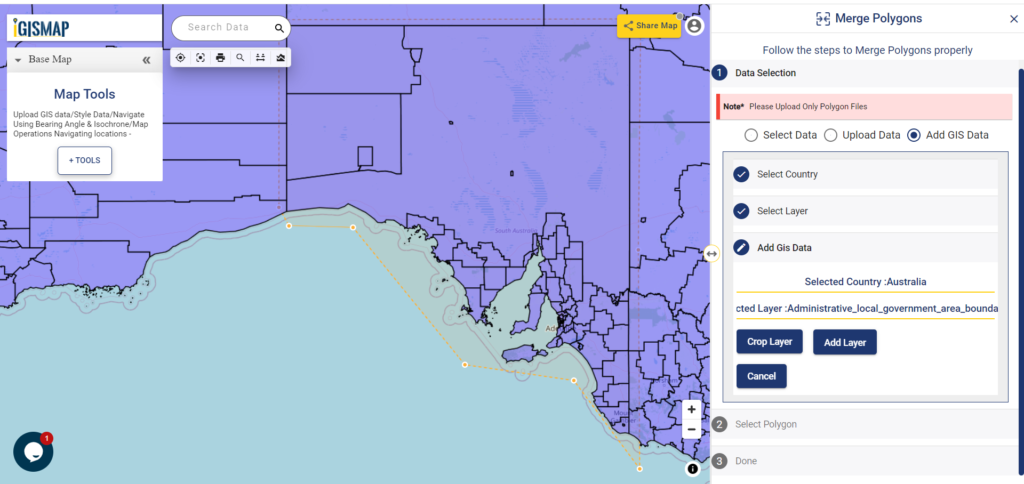
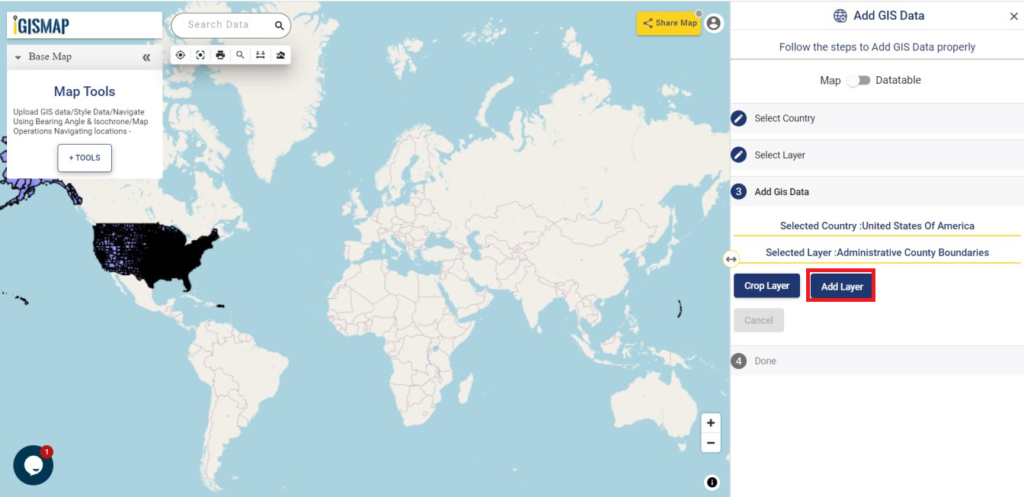
Add Layer will preview the selected layer in the map and the options to crop the layer will be available in the tool. Since we only want the LGA boundaries of South Australia. Thus click the Crop Layer button and start drawing a polygon completely enclosing the LGA polygon features of South Australia and click Add Layer button.

Crop Layer
Crop Layer

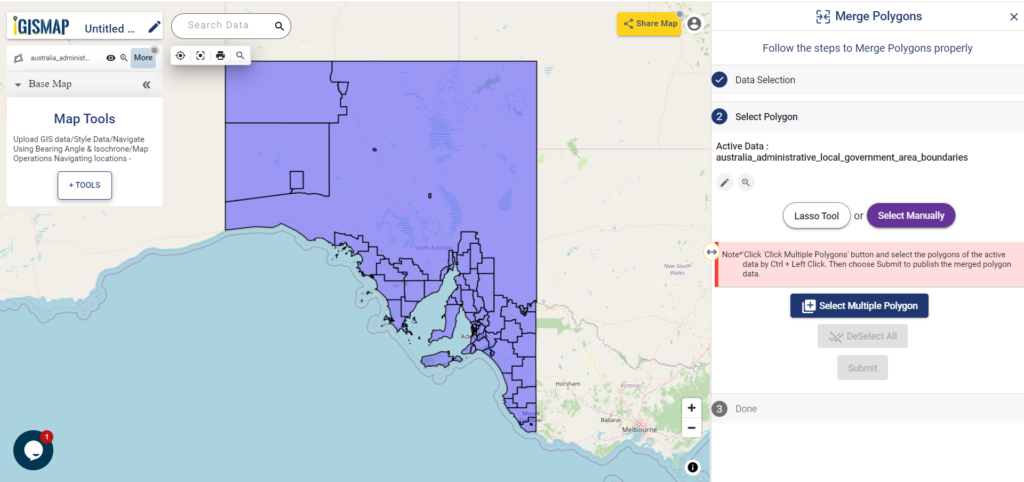
Add Layer button will publish the cropped LGA boundaries of South Australia on the map and the Select Polygon section of the Merge Polygons tool will open.

Data Published From Add GIS Data

Check this article Merge polygons features online using IGISMap to understand how to upload data and merge polygons in Merge Polygons tool.

If you have Point data then use our feature points to polygon converter. You can directly upload the point GIS data or convert addresses from spreadsheets to points.

Merging Polygons

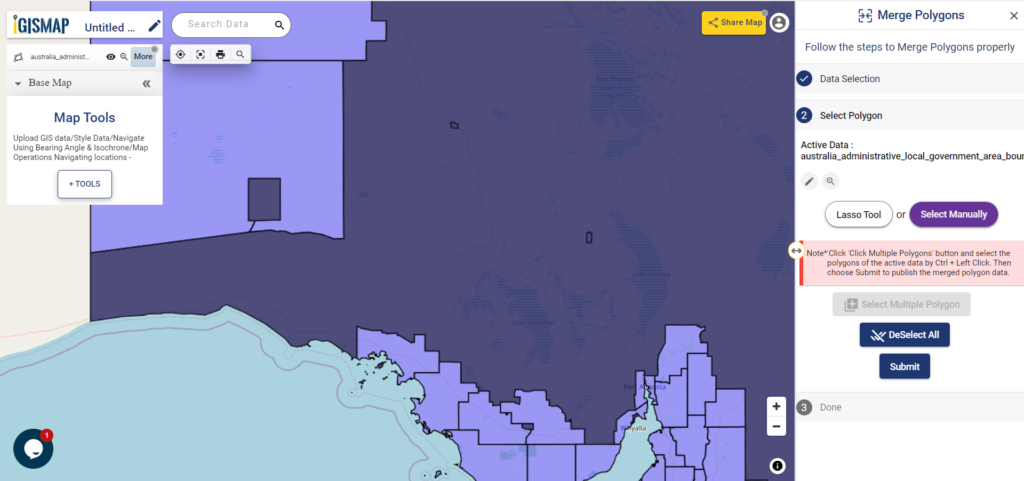
There are two options to select the required polygon features – Lasso Tool and Select Manually. We will use Select Manually option. After selecting Select Manually, click Select Multiple Polygon button. Now select the polygon features of Roxby Downs, Coober Pady, and Unincorporated SA boundaries, which we want to merge the polygons together. After selecting the polygons, click on the Submit button to start the process of merging the selected polygon features.

Select Polygon - Select Manually
Select Polygon – Select Manually

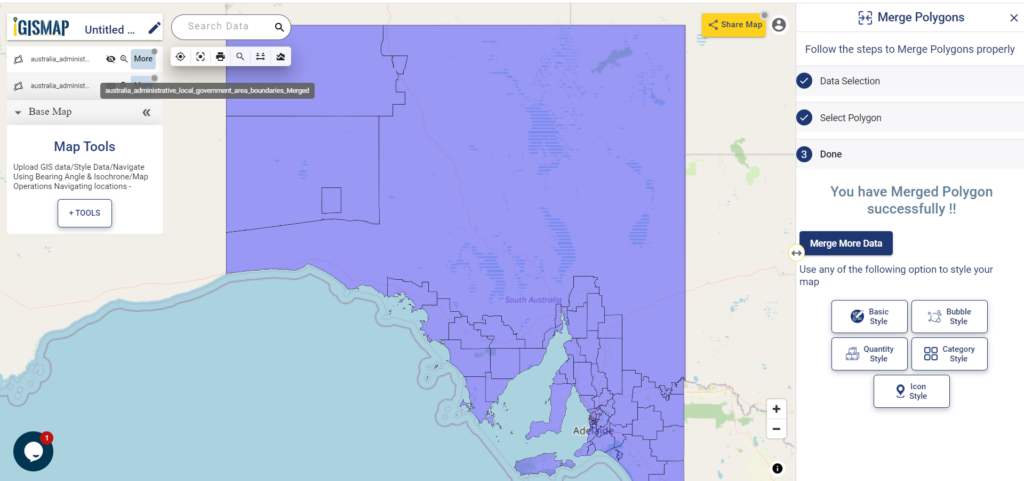
In a few seconds, a new layer of the input GIS data of LGA boundaries gets published. In this layer, the selected polygon features are merged into a single polygon as shown below.

Add/Upload data and merge polygons
Polygons Merged and Published

Check the article Share your Map to know how to share your map with others using Share Map feature.

Check other articles:
Check the following IGISMap tools:

Convert addresses from spreadsheet to points on Map in two steps

Consider a customer service manager working for a supermarket company wants to connect with some of their best customers for giving winning prizes and to promote their business. The manager has a list of contacts along with their address which is located all over America. In order to deliver the winning prizes to their doorstep, he has to find the best route which takes a minimum number of days to receive it. Hence he has to give the delivery partner the best route which is easier and less time-consuming.

In such cases, Geocoding helps to make the process easier. Geocoding is the process of converting one or more valid address with location details into GIS points.Geocoder tool of IGISMap can be used for converting address details to point GIS data in a few steps. You only need to upload the spreadsheet file with address columns and assign the address columns to start plotting. Option to review the plotting and edit the points are also available in this tool.

IGISMap is a GIS-based web platform, that provides multiple GIS applications that are most important in the field of geospatial analytics. The peculiarity of IGISMap in the GIS Industry is its UI/UX, which helps the user to perform effortless geospatial operations. IGISMap allows users to edit the data table of vector data by editing the name of the columns, deleting the columns, and adding new columns. The Geocoder tool on the IGISMap increases efficiency by enabling different companies to better coordinate their sales in both domestic and foreign marketing activities.

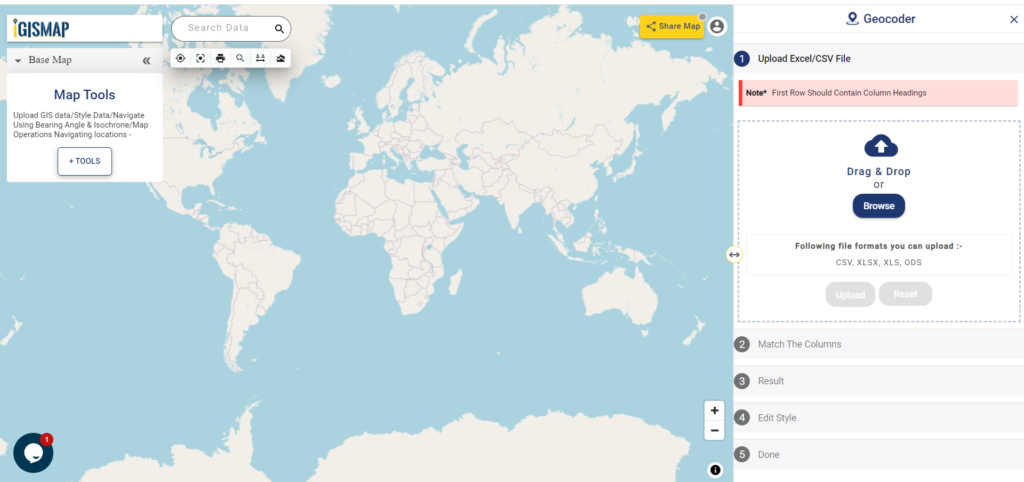
Open Geocoder tool using the following link https://map.igismap.com/geocoder

Upload spreadsheet file

For uploading the input file, click on the Browse option, select the excel/CSV file from your system that you want to visualize on IGISMap, and click on the Upload option.

Geocoder - Upload Excel/CSV file
Upload Excel/CSV file

Match the Columns

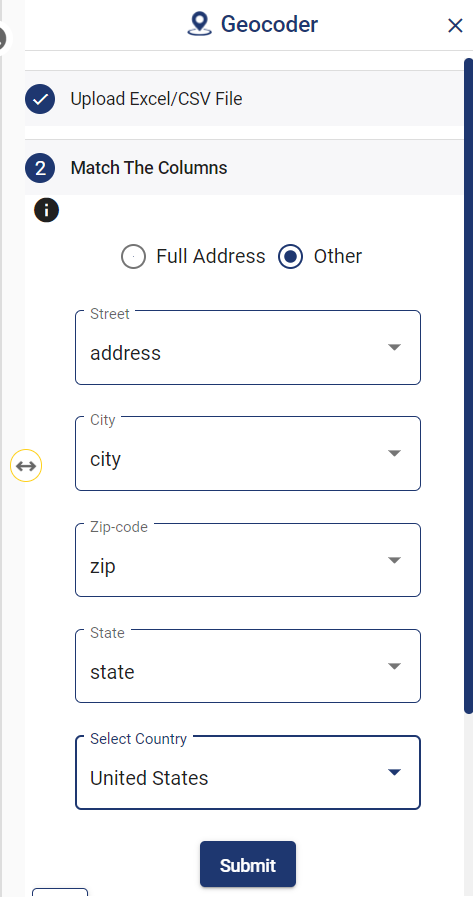
After successfully uploading the file, the next step is to assign the address columns in your file to be used for geocoding. There are 2 options to match the columns – Full Address and Other. Full Address option is used for files with address information provided in a single column. In our case, we have address distributed in several columns, thus we will choose Other option. Click Other option and select the right address columns from you file at the right address types such as address, city, zip, state. Then select the country and click Submit button to geocode the address.

Geocoder - Match The Columns
Match The Columns

Review the geocoded locations

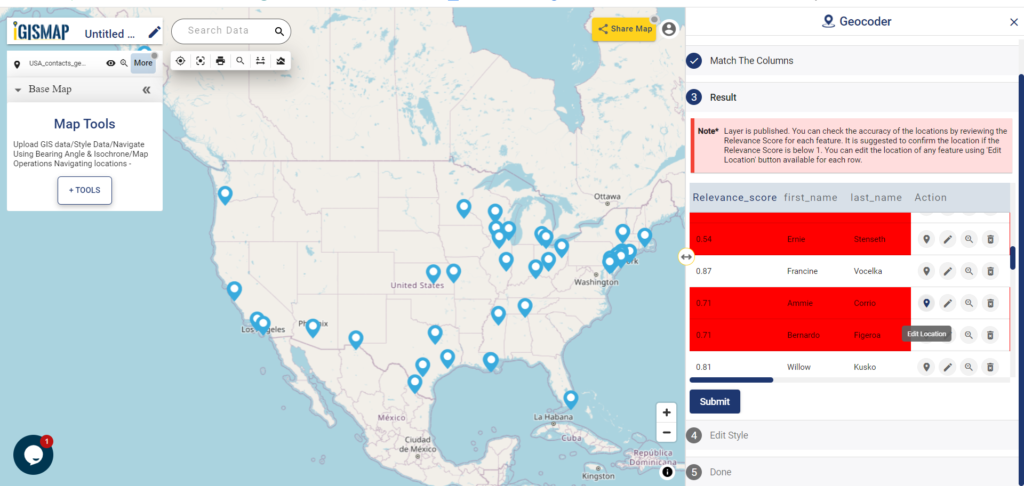
A GIS layer gets published after submitting, with point locations based on the address information from the input spreadsheet file. Result section also opens with datatable and Relevance_score column.

Geocoder Result
Geocoder Result

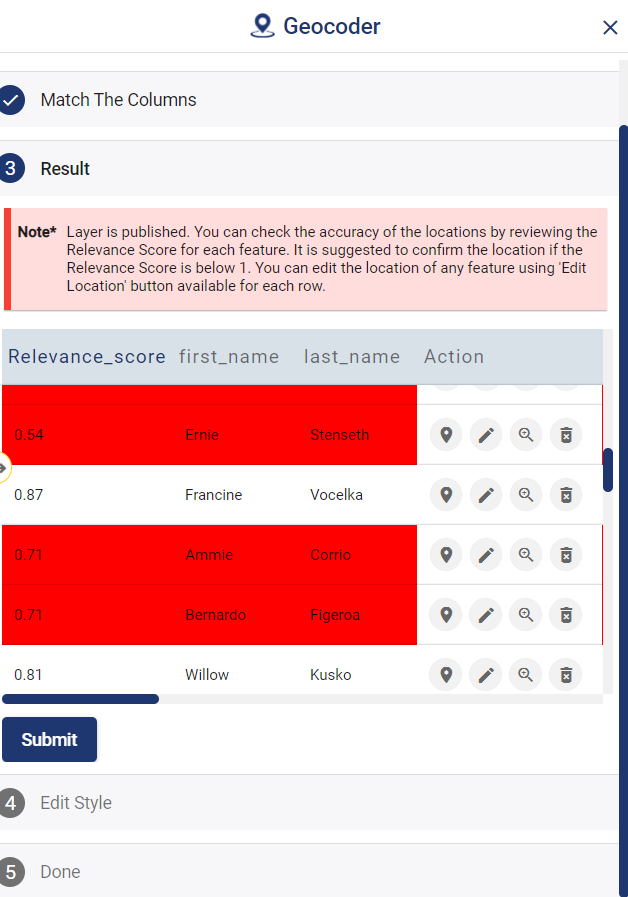
Relevance_score is a value ranging between 0 to 10 provided for every row depicting the accuracy of the plotted locations after the geocoding each address, where 10 being the highest accuracy. User can check the relevance score for each row and edit the point location if needed. Rows of the point features will be highlighted in red color if the relevance score is below 8. This is to notify the user to confirm the location plotted.

Result - Relevance Score
Relevance Score

How to edit location by checking relevance score

The user can delete any feature by using the Delete Feature button present on the Relevance_score table. Click Edit Attribute button of any required feature to start editing the attribute values of that feature and then click Save icon.

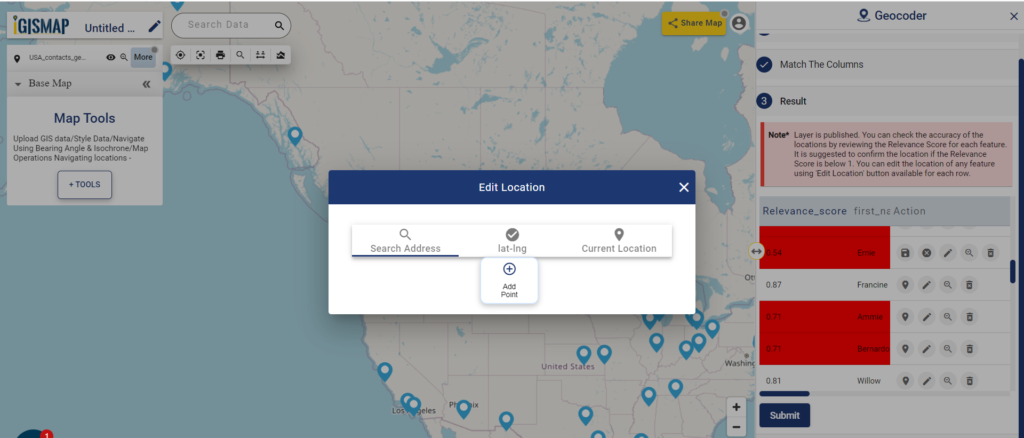
The user can edit the location of any point feature by using the Edit Location button. After clicking the Edit Location button in the row of any point feature, a pop-up menu with the options to edit the location.

Edit Location
Edit Location
  1. Search Address – Enter an appropriate address to replace the pin to that location
  2. lat-lng – Enter latitude/longitude values to replace the pin to that coordinate
  3. Current Location – To replace the pin to your current location
  4. Add Point – Manually plot a point on the base map

Now click Submit button to save the changes in the point GIS data

User can further edit the style of the points or share the map publicly or privately

How to style your polygon GIS data categorically

GIS helps users to understand patterns, relationships and geographic context. It benefit includes improved communication and efficiency, as well as improved management and decision-making. GIS combines datasets with maps, integrated regional datasets with any type of descriptive information or data. It provides mapping and assessment prerequisites for technology and almost every industry.

Visualization and intepretaion of data is what makes GIS a beautiful and interesting fields in data analytics. Science of visualization is the core essence in the art of cartography and mapping. Any type of geospatial features presented in the map with proper color combination, accurate size and location helps in better image interpretation. Quantity and category based representation of spatial features are the common visualization styles used in GIS.

IGISMap Styling Tools

IGISMap is a web platform providing multiple GIS applications that are most important in the field of geospatial analytics. The peculiarity of IGISMap in the GIS Industry is its UI/UX that helps the user to perform effortless geospatial operations. IGISMap provides the following styling tools:

Among the styling options listed above – Basic, Category and Quantity styling options are used to style polygon and points, whereas Bubble Style and Icon Style are used to symboloze point GIS data. Basic Style will give any single color for the while GIS layer. Quantity Style is used to visualize the GIS data quantitatively. And Category Style will style your GIS map with separate colors assigned to each category of features

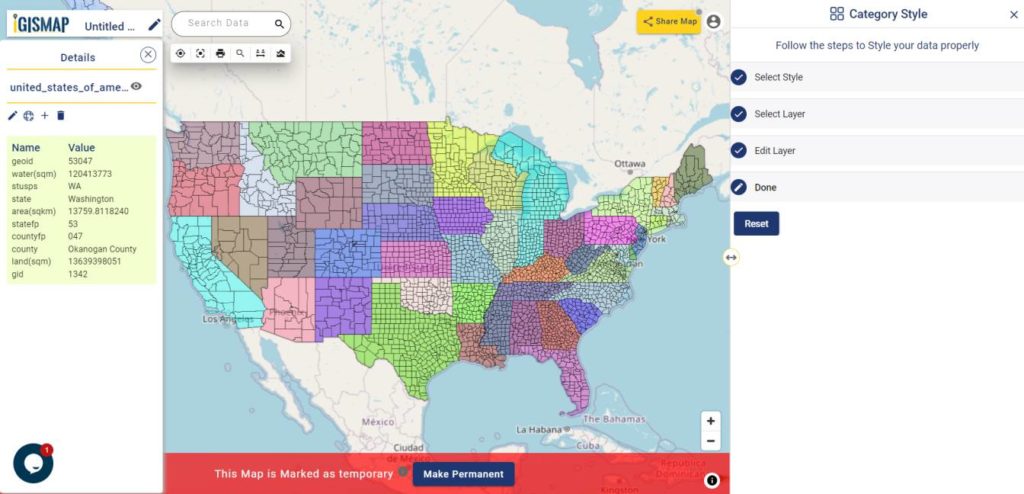
In this article we will talk about Category Style tool of IGISMap and how it can be used to categorically visualize your polygon GIS data like the following.

USA County Boundaries Data Categorized Based On States

Add your GIS data

For the demonstration, let’s add county boundary polygon data of USA from IGISMap GIS data collection. For this let’s use Add GIS Data tool of IGISMap.
Click https://map.igismap.com/add-gis to open Upload Vector File tool.
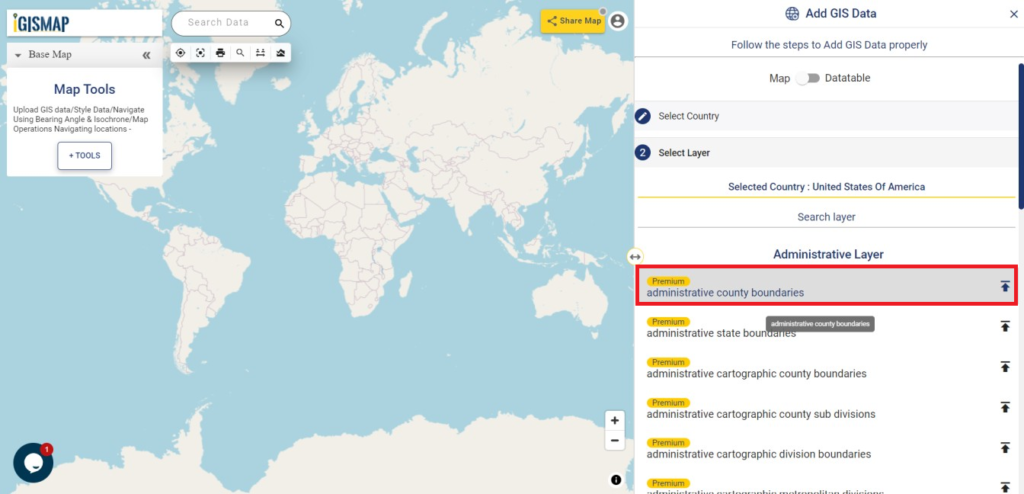
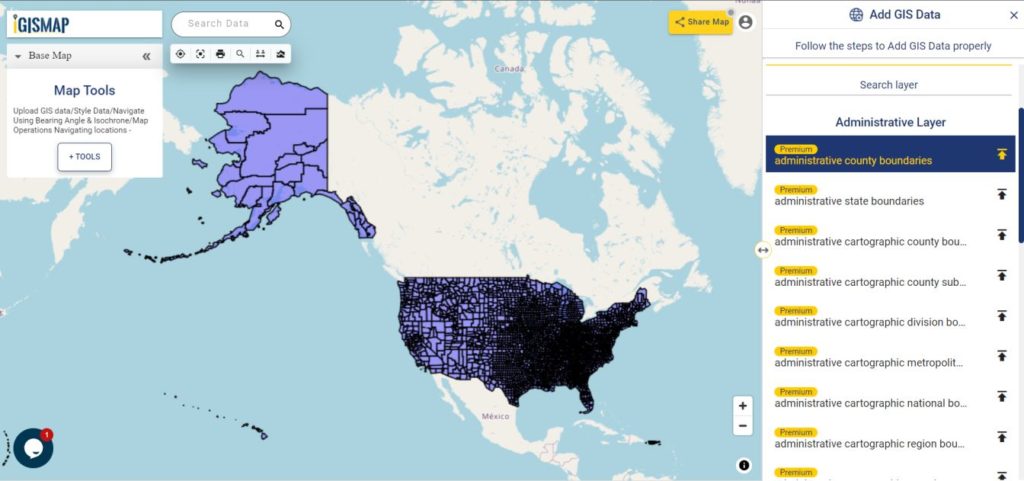
After opening the Add GIS Data tool, in the Select Country section we will select United States of America. Then Search Layer section opens with the list of GIS data of USA, where we need to select ‘administrative county boundaries‘.

Add GIS Data
Add GIS Data

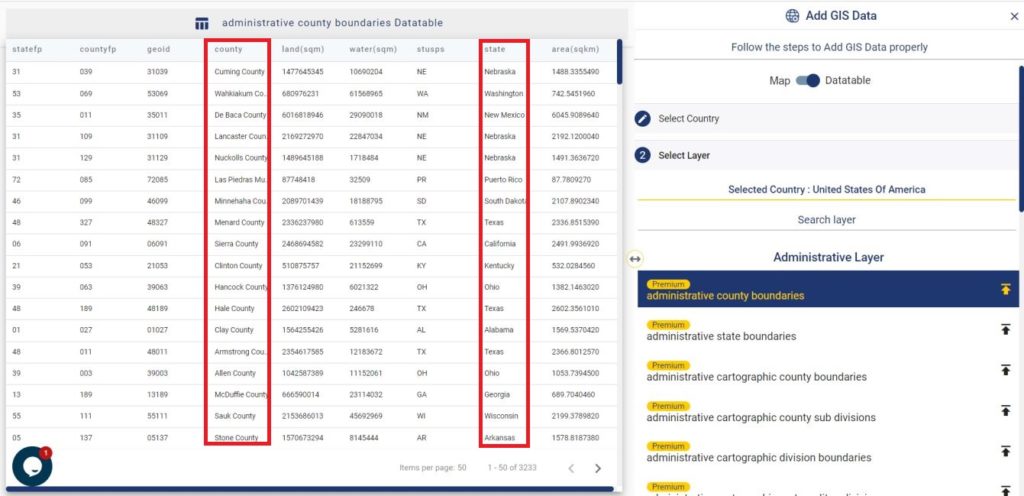
Before adding this data, lets check the data table of this data and verify the attribute field which we need to categorize this data. Switch the view from Map to Datatable and review the attribute fields. Here we are going to categorize the polygon features of county boundaries based on the state which it belongs to.

As you can see below, we have the attribute field for counties and the attribute field with states it belongs to.

Add GIS Data - Datatable
Datatable in Add GIS Data

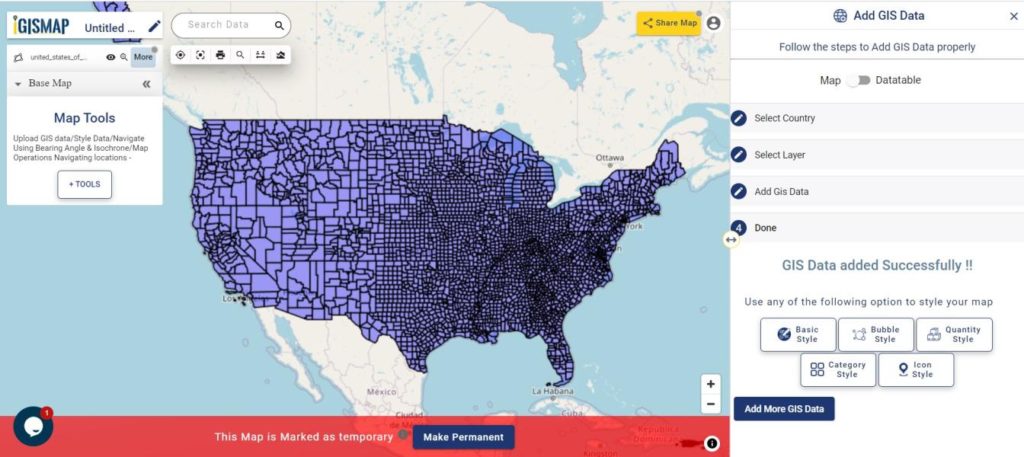
Since we have confirmed the data, lets continue downloading. First click the download icon beside the data name and then click the Add Layer button in the next section that opens.

Add GIS Data - Add Layer
Add Layer

Now the layer is published in the map with the name ‘united_states_administrative_county_boundaries

Data published
Data published from Add GIS Data

Click here – Download USA County Boundaries GIS Data

Open IGISMap Category Style tool

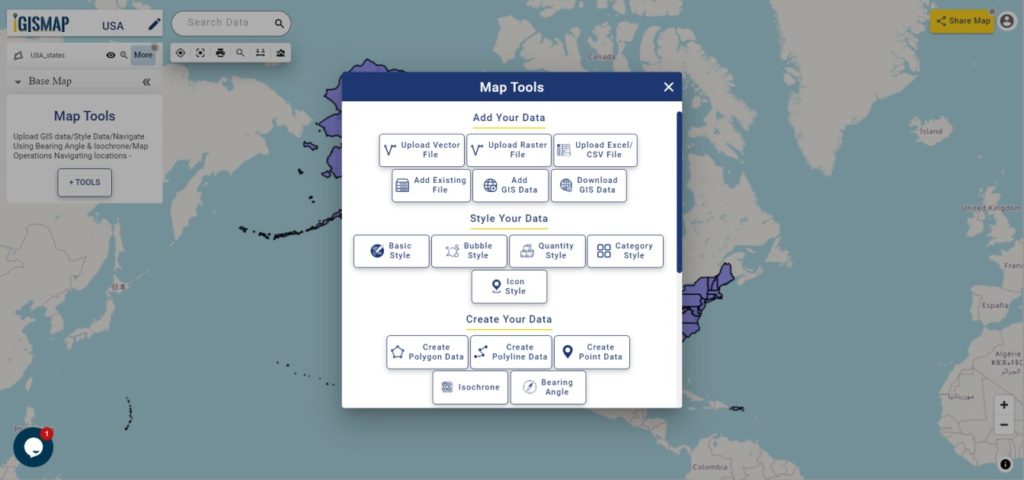
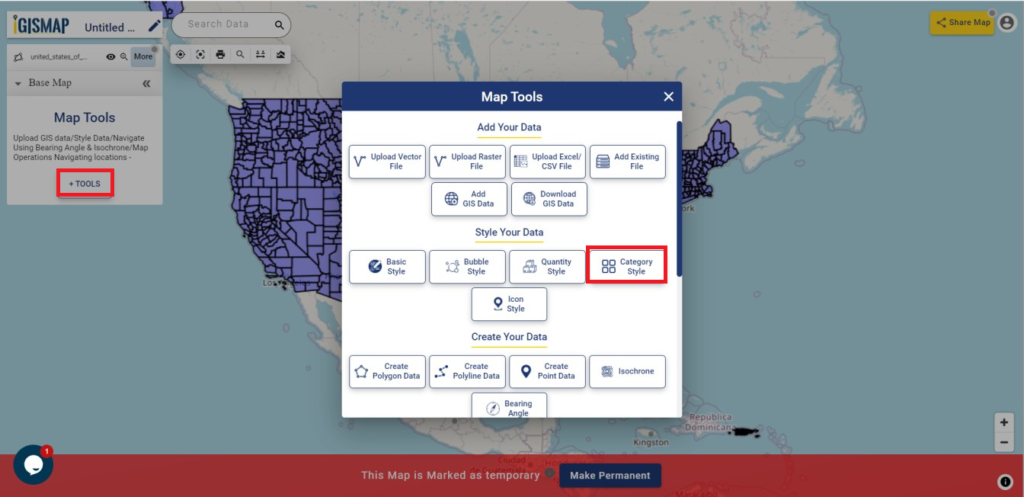
After adding the input GIS data from Add GIS Data, we can style the counties categorically using Category Style tool. For accessing the tool, click Tools button at the upper left side of screen to open the map tools popup. Then select Category Style tool listed under Style Your Data section.

Map Tools
Map Tools

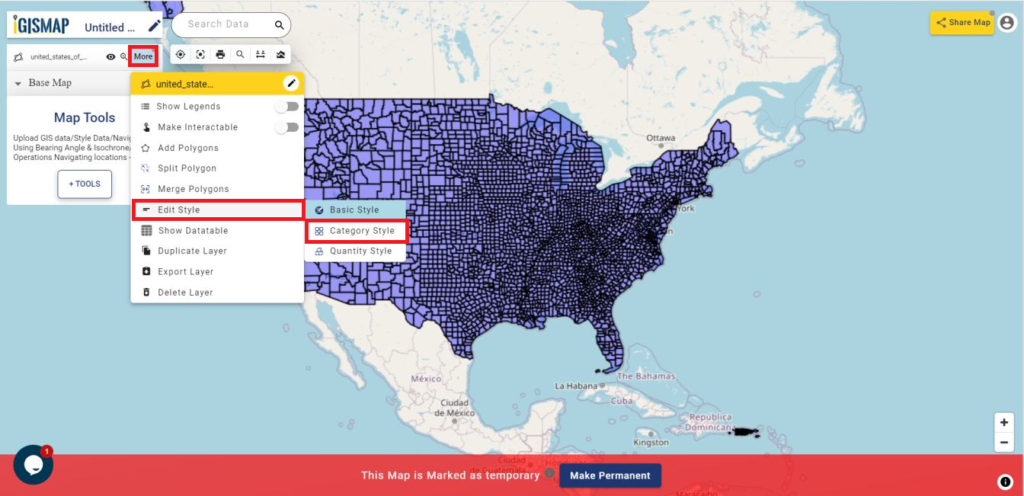
We can also open the Category Style tool by going to the More option of input point data and choose the Category Style from the Edit Style option.

More options - Category Style
More options -Edit Style – Category Style

Styling GIS data categorically

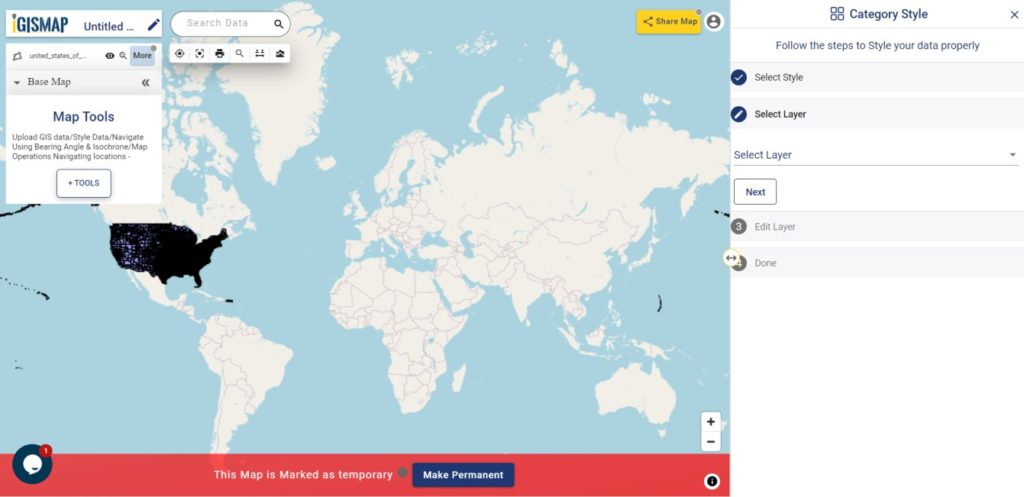
Then the tool is appeared on the screen of IGISMap.

Category Style
Category Style

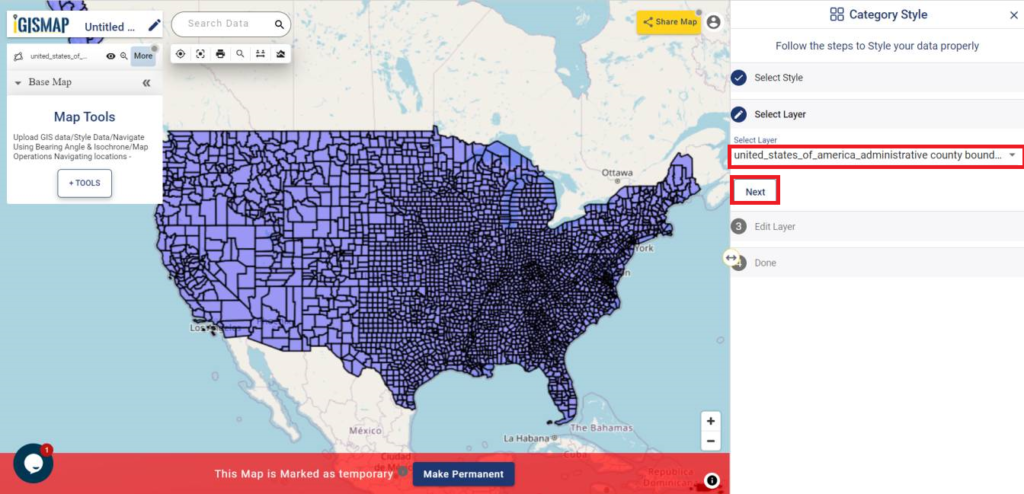
Then the tool appears and we have to select the layer from Select Layer section which is the ‘united_states_administrative_county_boundaries‘ data that is published in this map and then we have to click Next option.

Category Style - Select Layer
Select Layer

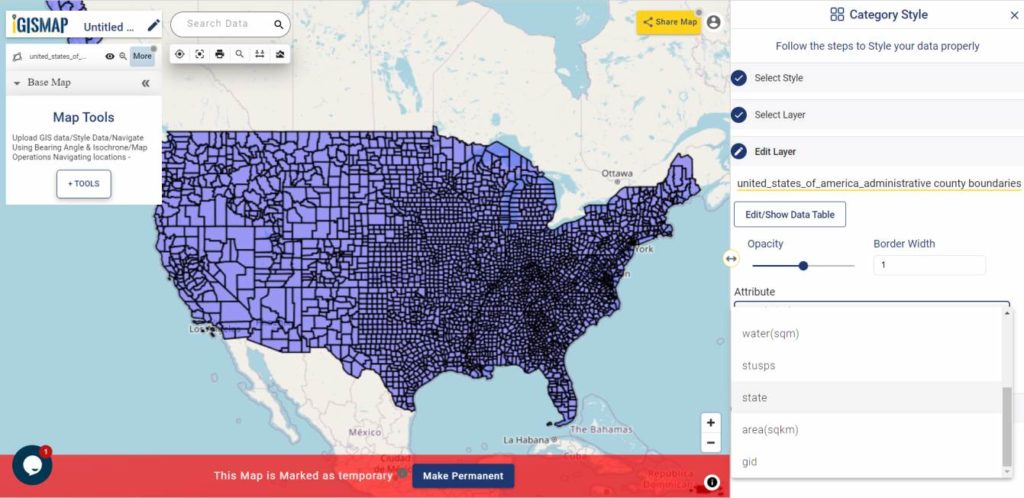
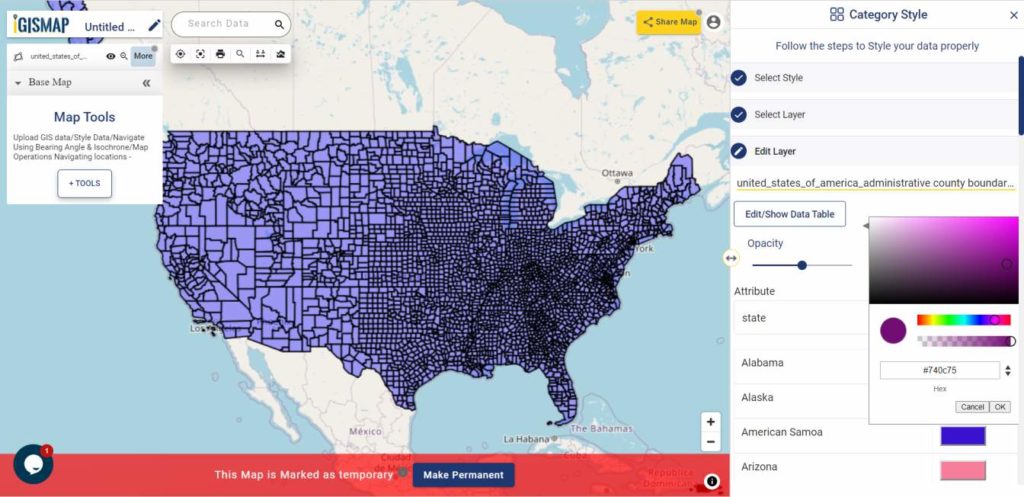
After clicking Next, in the Edit Layer section, we can change the style as we want. In this section we can can change Opacity and change the Border Width as required. Now in the Attribute field, select state field to categorize the counties based on its individual attributes values.

Category Style - Edit Layer
Edit Layer

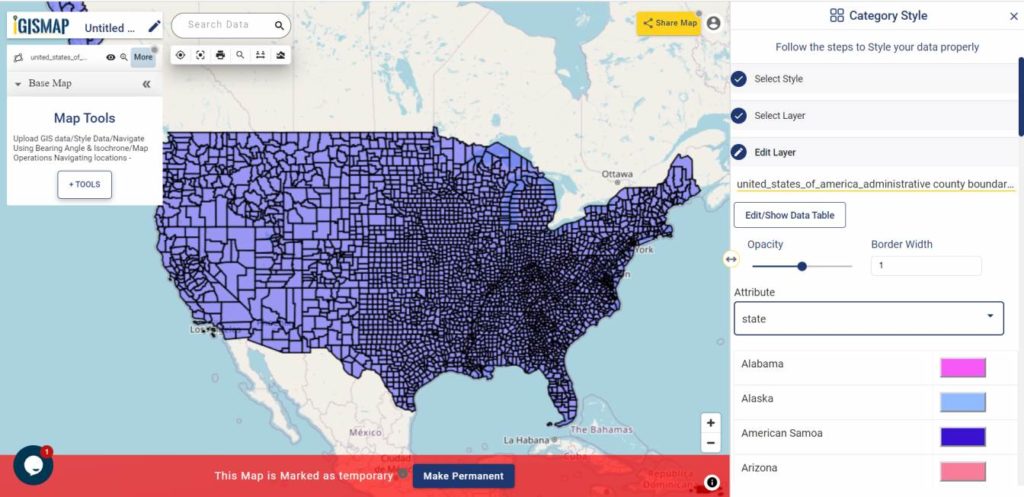
After selecting the required attribute field, all individual values will be listed with different colors assigned for each category.

Select Attribute Field

We can change the color for each category by the color and choosing the right color. Then we have to click OK.

Category Style - Assign Color
Assign color to each category

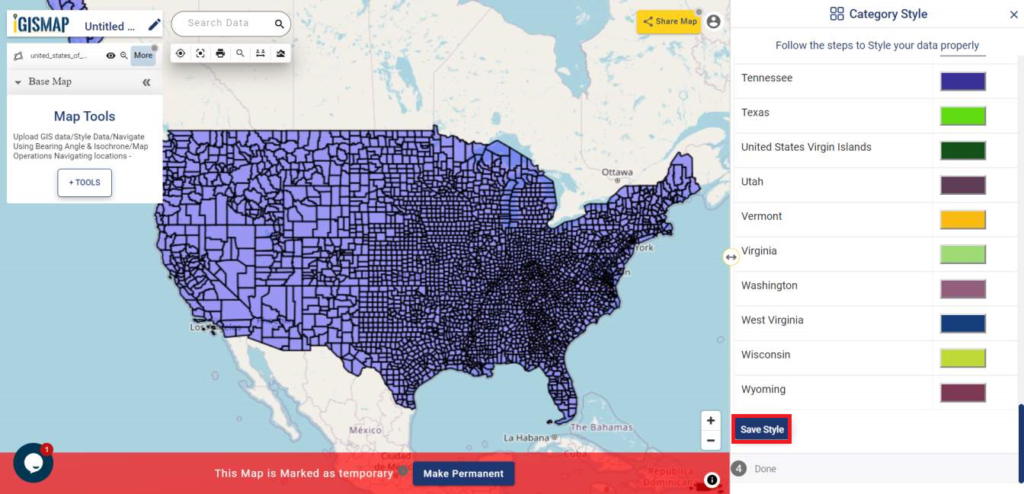
After changing all color of the attributes we have to click on Save Style for styling the map categorically.

Save style
Save the Style

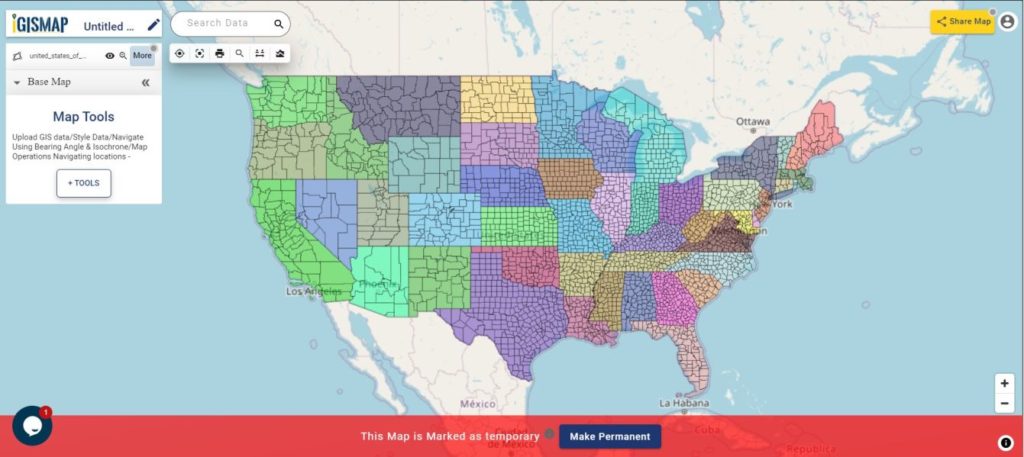
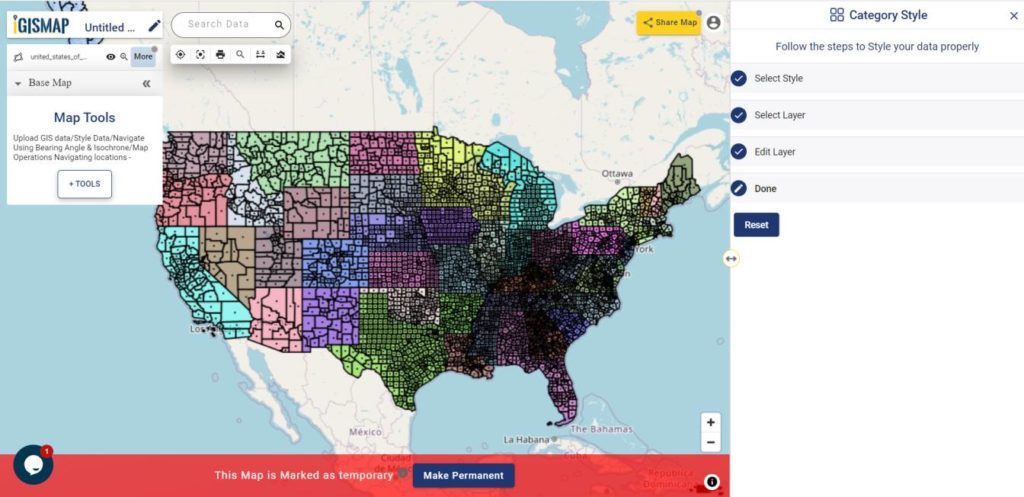
Now as you can see the map is converted into categorical style and the output map is shown.

Polygon GIS data categorized

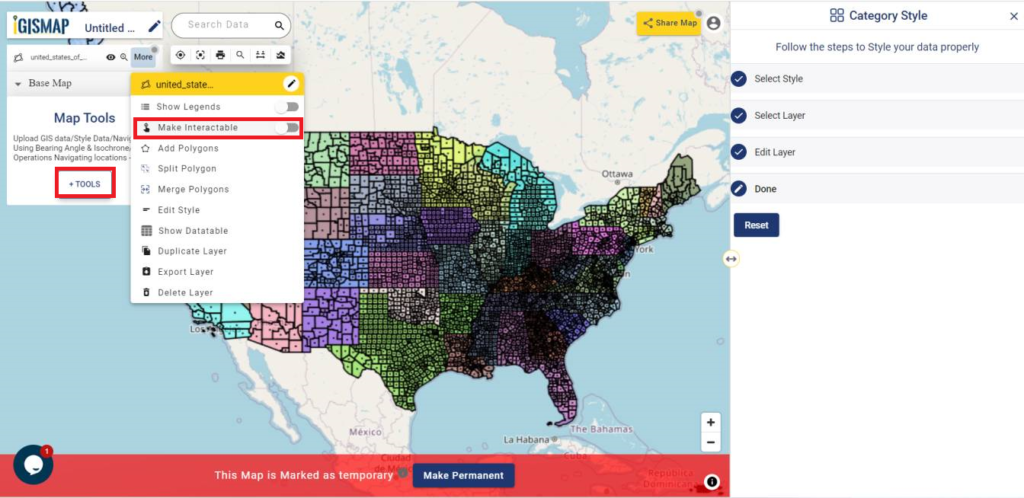
For better view and make your data more interactive in the map, go to More and enable Make Interactive option.

Make Interactable
Make Interactable

Now as you see below, the USA county level boundaries GIS data is better visualized in state based categories and the map got more interactive.

Interactable Map
Interactable Map

You can share your map with others in public or private mode. Article Share your Map will help you understand more about Share Map feature of IGISMap.

Other articles:
Check the following IGISMap tools:

How to style point GIS data categorically

GIS helps users to understand patterns, relationships and geographic context. It benefit includes improved communication and efficiency, as well as improved management and decision-making. GIS combines datasets with maps, integrated regional datasets with any type of descriptive information or data. It provides mapping and assessment prerequisites for technology and almost every industry.

Visualization and intepretaion of data is what makes GIS a beautiful and interesting fields in data analytics. Science of visualization is the core essence in the art of cartography and mapping. Any type of geospatial features presented in the map with proper color combination, accurate size and location helps in better image interpretation. Quantity and category based representation of spatial features are the common visualization styles used in GIS.

IGISMap Styling Tools

IGISMap is a web platform providing multiple GIS applications that are most important in the field of geospatial analytics. The peculiarity of IGISMap in the GIS Industry is its UI/UX that helps the user to perform effortless geospatial operations. IGISMap provides the following styling tools:

  • Basic Style
  • Category Style
  • Quantity Style
  • Bubble Style
  • Icon Style

Among the styling options listed above, Bubble Style and Icon Style are used to symboloze point GIS data, whereas Basic, Category and Quantity styling options are used to style polygon and polyline GIS data. Bubble Style is used to style the point GIS data quantitatively and Icon Style is used to style point GIS data with the icon or categorically by assigning separate icon for each categories.

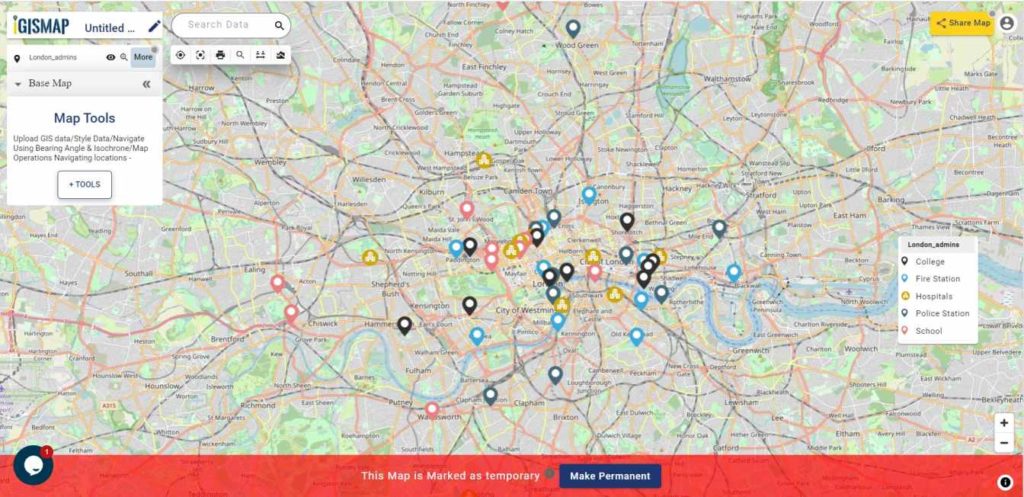
In this article, we will talk about how to categorically represent point GIS data using Icon Style tool of IGISMap and will walk through the steps to style your data categorically like the following

Administrative Locations in London

Uploading the data

For the demonstration, we will upload the point GIS data of administrative buildings locations in London city and categorize it based on types. First lets upload this data using Upload Vector File tool of IGISMap.

Click https://map.igismap.com/upload-vector-files to open Upload Vector File tool.

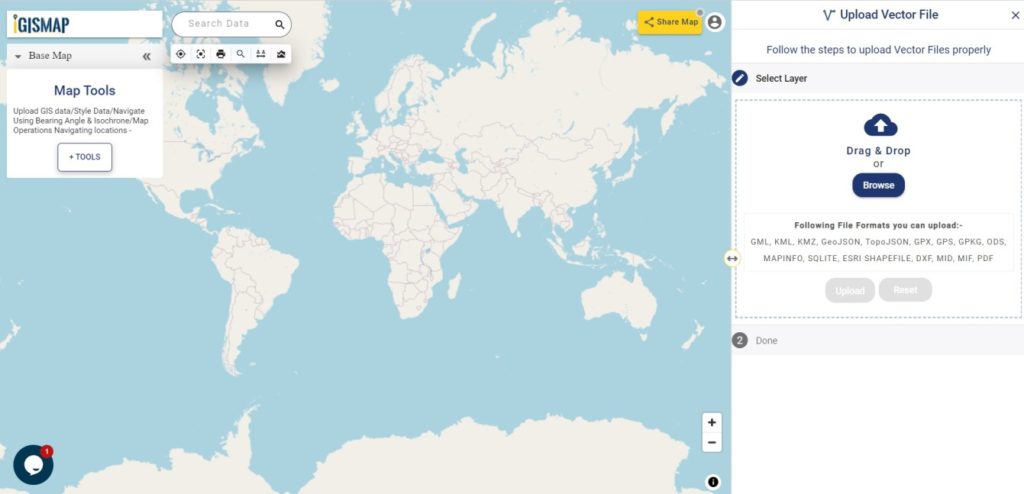
After opening the Upload Vector File tool, here we can upload required the vector data in any of the following vector formats.

GML, KML, KMZ, GeoJSON, TopoJSON, GPX, GPS, GPKG, ODS, MAPINFO, SOLITE, ESRI SHAPEFILE DXF MID. MIF, PDF

Upload Vector File tool
Upload Vector File

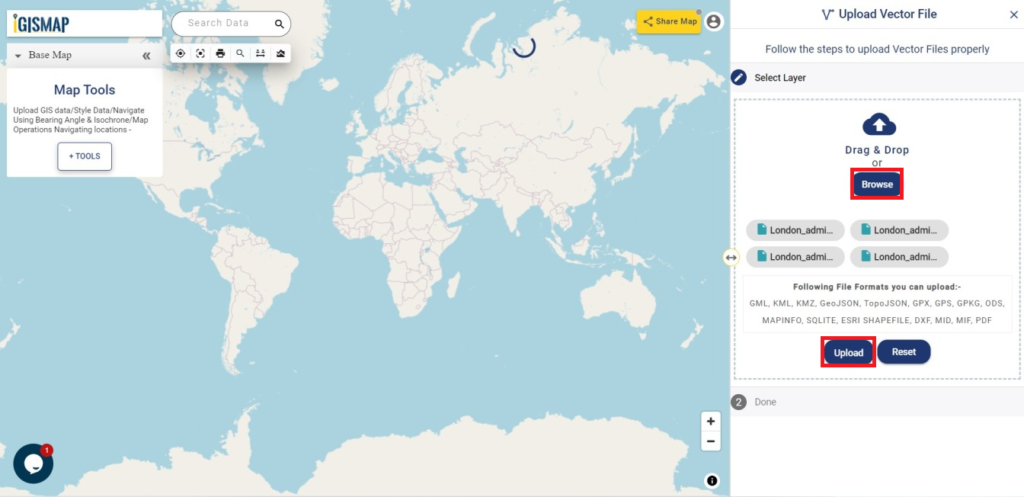
In the Select Layer section we have to click on Browse and select the input file from the system, which is the GIS data of administrative building locations in Lonndon named as London_admins. After opening the file, click Upload.

Upload Vector File - Select Layer
Uploading the file

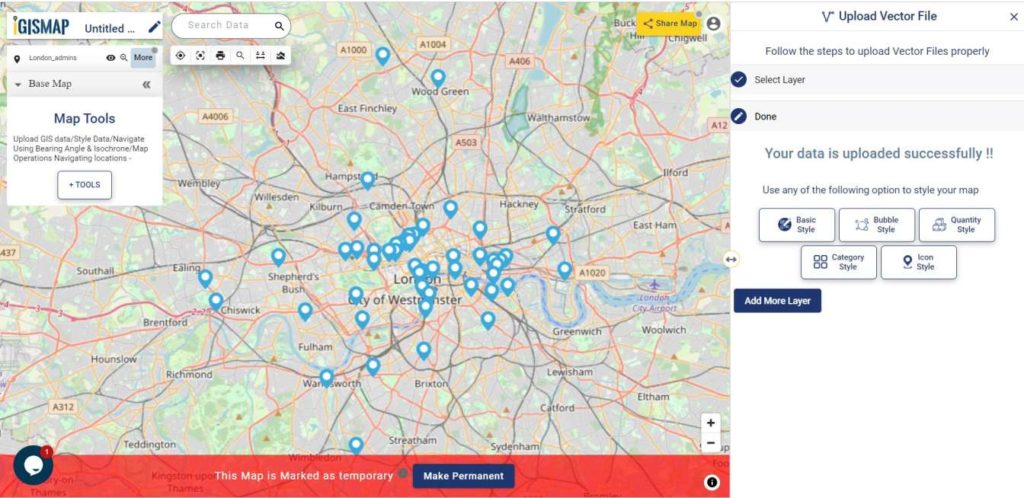
After uploading, input GIS data will be visible on the IGISMap screen, represented by default icon style as shown below.

Upload Vector File - Point GIS Data
Point GIS Data plotted on map

Open IGISMap Icon Style tool

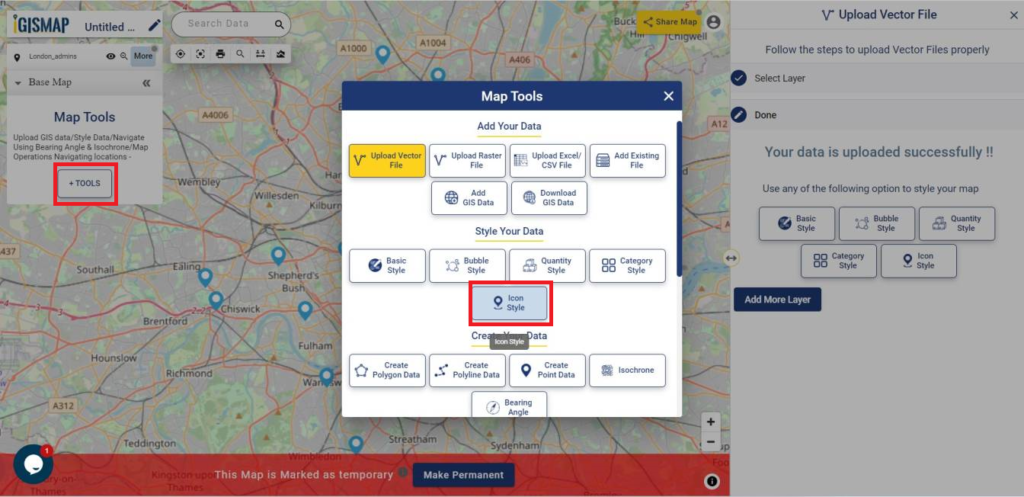
After adding the input GIS data, we can style the points categorically using Icon Style tool. For accessing the tool, click Tools button at the upper left side of screen to open the map tools popup. Then select Icon Style tool listed under Style Your Data section.

Map Tools popup
Map Tools

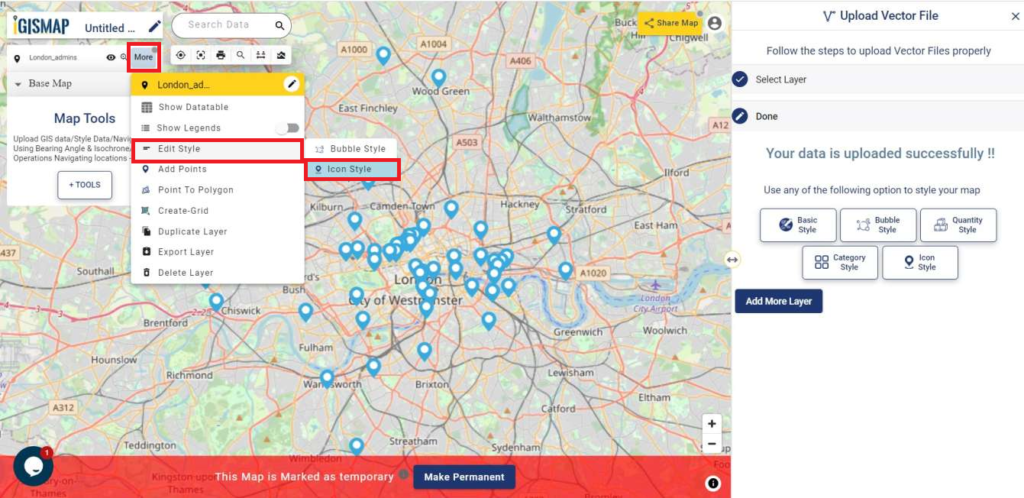
We can also open the Icon Style tool by going to the More option of input point data and choose the Icon Style from the Edit Style option.

IGISMap More options
More options

Styling point GIS data categorically

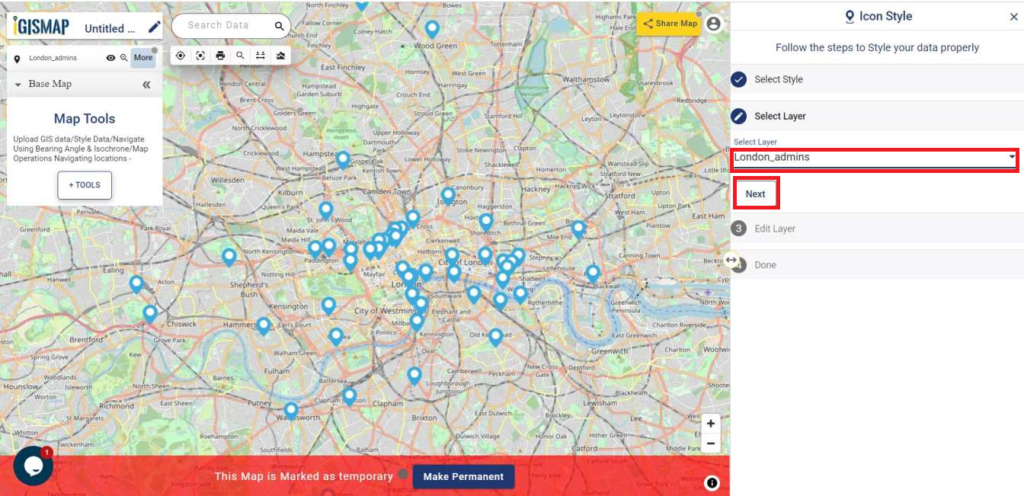
After the tool appears, we have to select the layer from Select Layer section which is the London_admins data that is published in this map and then we have to click Next option.

Icon Style - Select Layer
Select Layer

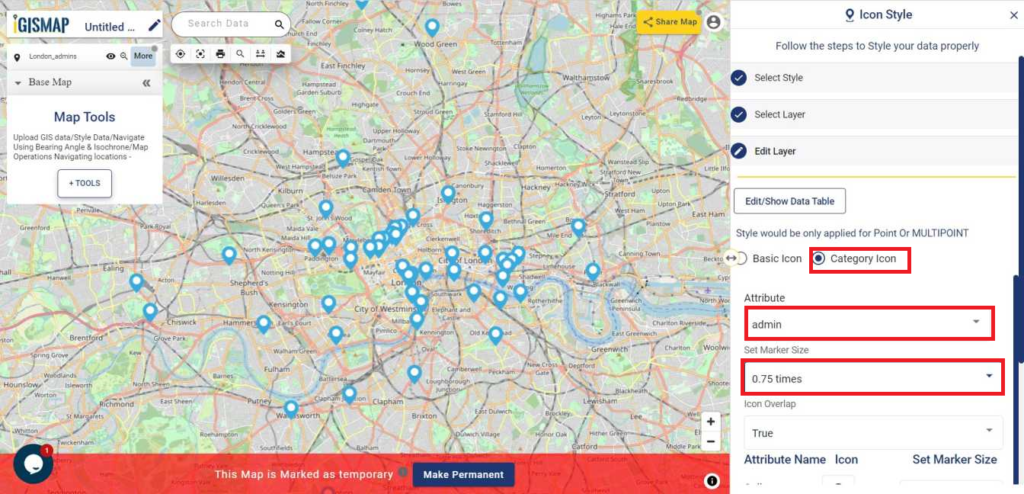
Then the Edit Layer section is appeared. Here we have to choose Category Icon. Now in the Attribute field, select admin field to categorize the point data based on its individual attributes values. You can also assign a default icons size to applied for every icon style in the Set Market Size box.

Select the Attribute in Category Icon
Icon Style – Category Icon

In the Icon Overlap, you can change the option between True or False. Choose True if you want the icons to be overlapping when the map is zoomed out. Select False if you want to see every point icons any zoom extend of the map.

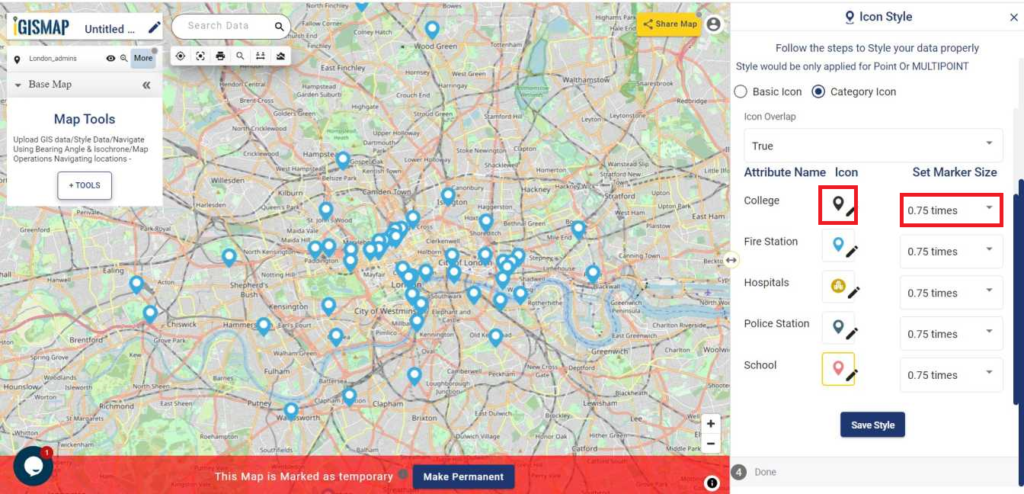
After selecting the required attribute field, all individual values will be listed with different icons assigned for each category, with default marker size. We can change the icons for each category by selecting the edit option and choosing the right icon from the list provided. We can also assign appropriate marker size for each category at Set Marker Size section.

Setting Icon and Marker Size

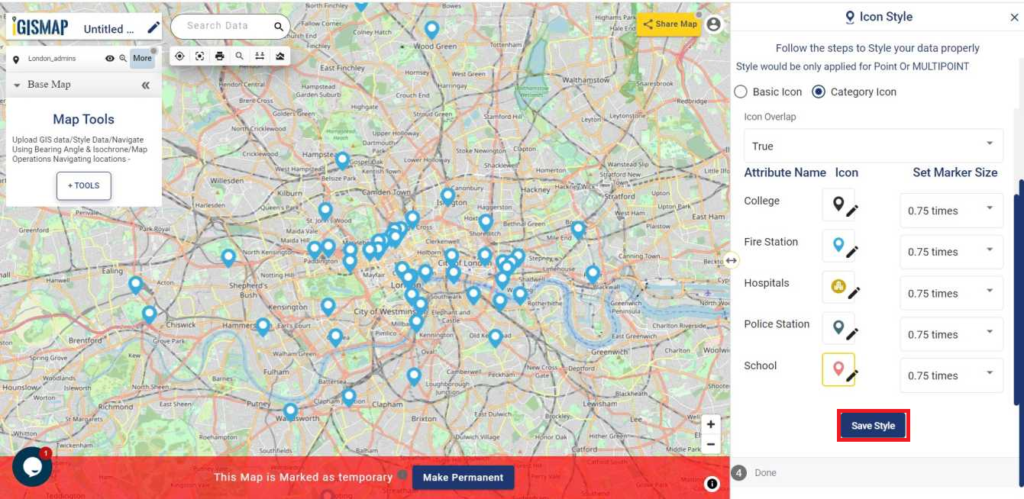
After editing we have to click on Save Style for styling the point data.

Save the Style after Edit Layer

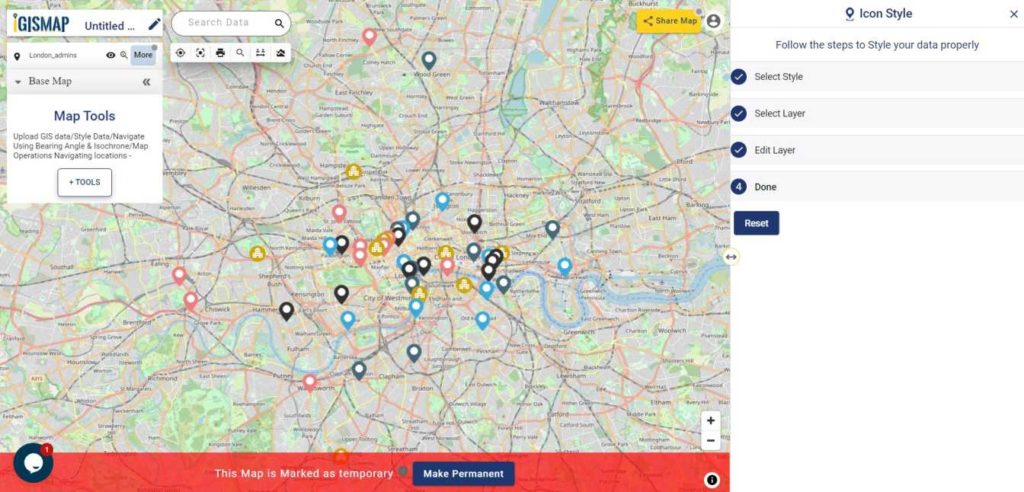
Following all the process we get the desired output on the screen of IGISMap.

Point Map by Icon Style

How to use Add Existing File tool of IGISMap

The applications of GIS tools are expanding in the field of business, research, defense, etc. Thus the features and tools of every GIS software are updating abruptly for helping users in these industries to get the right information by performing complex analyses over GIS data. But working with most of the GIS software in the market requires adequate training and dense knowledge in geospatial concepts.

That is where IGISMap is useful. IGISMap is GIS based web platform providing multiple GIS applications that are most important in the field of geospatial analytics. The peculiarity of IGISMAP in the GIS Industry is its UI/UX that helps the user to perform effortless geospatial operations. In this article, we will discuss Add Existing File tool of IGISMap.

In IGISMap, GIS data is uploaded, created, edited and worked on a map. A map is a spatial interface that supports GIS data and give access to various tools to perform geospatial operations. As a user of IGISMap, you can create any number of maps and add GIS data of any formats.

Add Existing File is a tool that keeps the list of all data that are available on every map in your IGISMap account. Users can open this tool directly from the map or from the dashboard to view the list of data that are published in the maps. You can select any data from the list, preview it and add that data to the map. Thus you dont have to take effort on uploading the data again if it is available in any map.

Let’s look into the application of Add Existing File tool in IGISMap.

Get directed to Add Existing file tool using the following link https://map.igismap.com/your-data

Publish GIS data in the map

Let’s see how a data published in a map get listed in Add Existing Tool. So let’s first publish a data in a map. For this lets use Add GIS Data and publish USA county boundaries polygono data

Add data from IGISMap GIS data collection

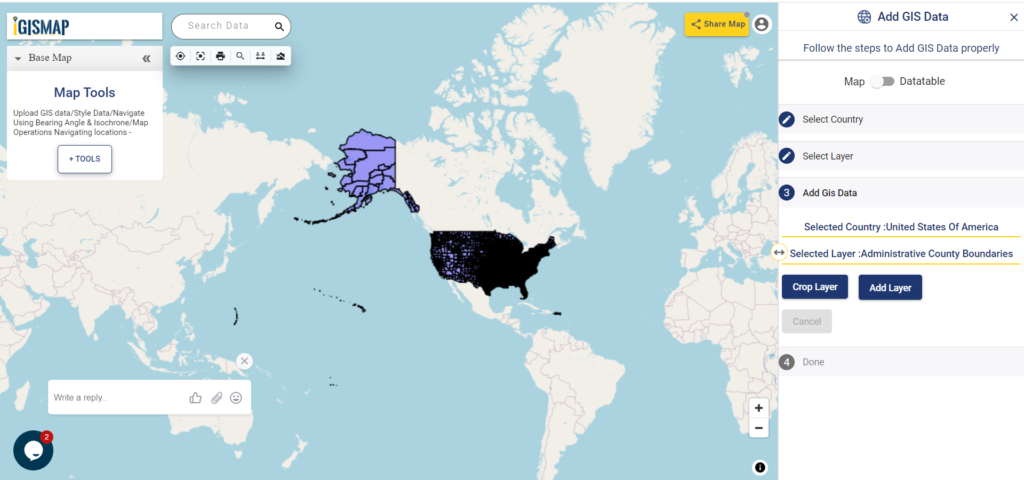
Select united states of america from the list of countries and select the data administrative county boundaries and click Add Layer icon.

Download USA County Boundaries Shapefile

Add GIS Data
Add GIS Data

In the next step, since we dont need to crop the data, directly click Add Layer button as shown below.

Add GIS Data - Add Layer
Add GIS Data – Add Layer

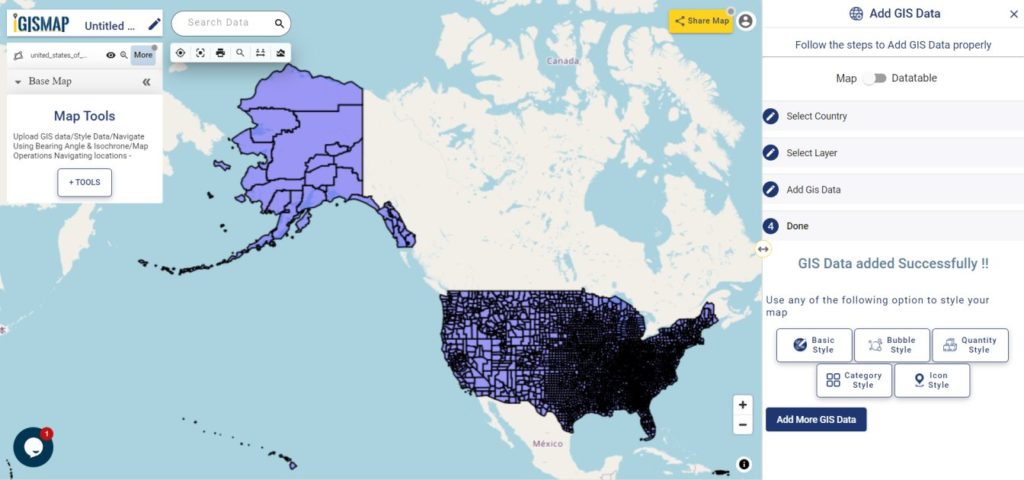
Now, GIS data of USA county boundaries are successfully added in the map.

Add GIS Data - Data Published
Data Published

Publish data from Add Existing File

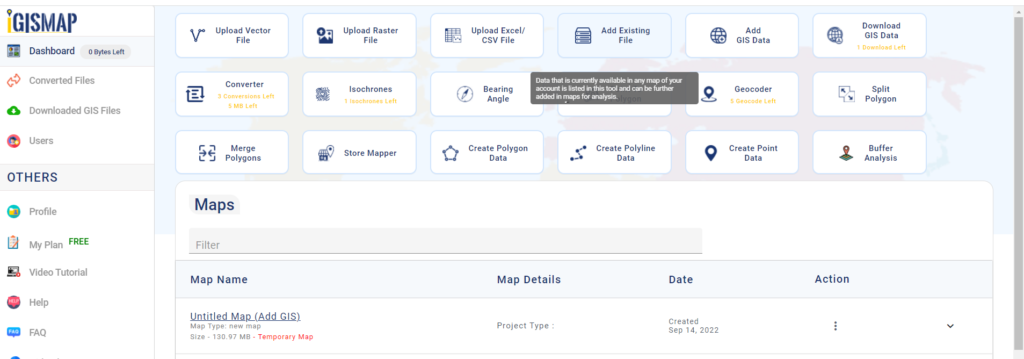
Now, we can add the USA County Level data layer using the Add Existing File. If you want add the data in a new map, open Add Existing File tool from the dashboard.

IGISMap Dasboard
IGISMap Dasboard

If you want to add the data from an existing map, click the Tools button below the layer list. This will open the list of all tools of IGISMap, as shown below.

In the section Add Your Data, click Add Existing File to open the tool.

Map Tools
Map Tools

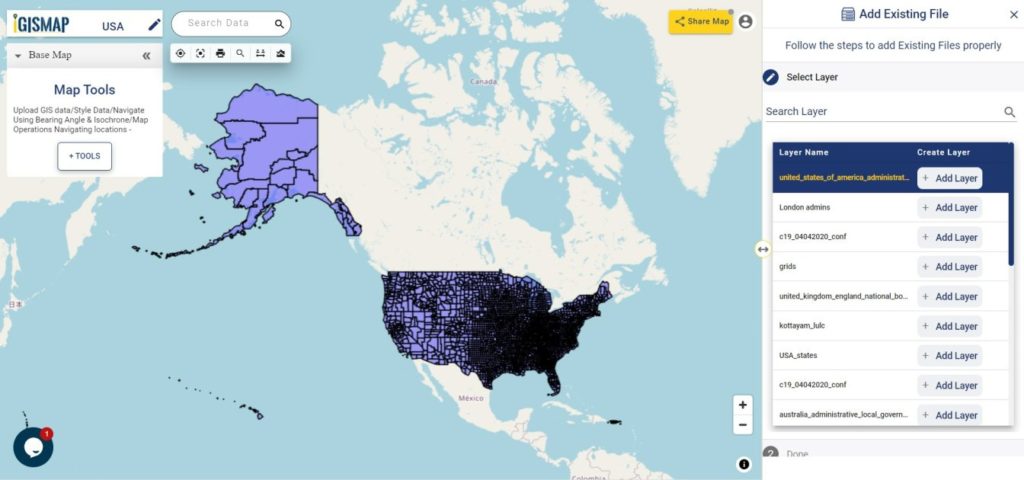
Now Add Existing File tool is opened with the list of all images currently published in the maps of your IGISMap account. The data we added from Add GIS Data, which is administrative county boundaries data of USA is listed top of the list. Or you can search the data using Search Layer option.

You can click and preview the data like the following.

IGISMap Add Existing File tool
Add Existing File tool

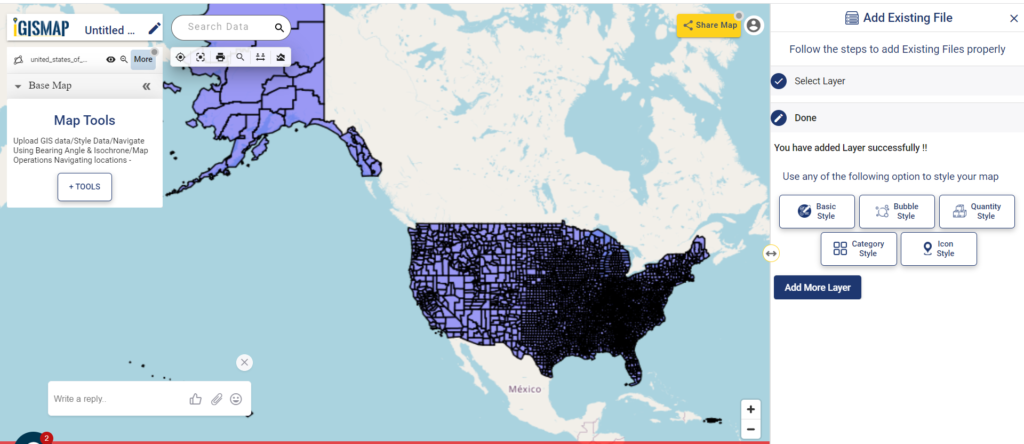
Click Add Layer button to publish this layer in your new map.

Data published
Data published from Add Existing File tool

More link:

Download United States of America Administrative Boundary Shapefiles – States, Counties, Reservation Lands and more

Create point data and convert it into polygons

Voronoi polygon is an area representing the influence from a particular point location. A Voronoi polygon is actually a systematic way to divide spaces into a number of regions using a set of input points. For each point there will be a corresponding area that consists of the locations closer to that point than any other. These areas are called Voronoi cells.

IGISMap provides a Point to Polygon tool to create Voronoi polygons out of point from input point data. IGISMap is a web platform providing multiple GIS applications that are most important in the field of geospatial analytics. In IGISMap, you can upload your GIS data and perform geospatial analysis.

In IGISMap, Point To Polygon tool will convert input point data into polygon data by creating a polygon shape for each point in the input point data, like the following.

Voronoi Polygon
Voronoi Polygon

Let’s look into the steps to use Point to Polygon tool of IGISMap.

Click https://map.igismap.com/point-to-polygon to open Point to Polygon tool directly

Point to polygon

After opening Point to Polygon tool, first step is to add the data using any of the following options:

  • Select
  • Create Points
  • Upload Vector
  • Upload CSV/Excel
  • Add GIS Data
IGISMap Point To Polygon tool
Point to Polygon

Here we are going to choose the option to Create Points and then convert the point to polygons through voronoi conversion. Thus lets first create and publish point GIS data.

Creating point data

Select Create Points tab which open Add Points section to plot points on the map at the desired locations.

Create Points
Create Points

Points can be plotted through any of the following options that can be used anytime in this section. They are:

  • Add Points
  • Search Address
  • Lat Lon Values

After finish the plotting, click Save and Publish button to publish the point GIS data.

Add Points
Add Points

Check the article Plot ATM locations on a map and embed in your website to know how to create point GIS data using Create Point Data tool.

Converting the Point data to Polygon data

After saving the point data, Convert Layer section is appears to carry out the point to polygon process.

Now click Convert button to run the point to polygon process.

Convert the Point Layer

As you can see, voronoi polygon layer is created and published in the map.

Voronoi Polygon
Voronoi Polygon

Sharing the voronoi polygon map

For sharing this map we have to click on Share Map button from the map. In the Share Map window, you can give the map name at the map title and  click on Next. Then a share map section appears.

Share Map
Share Map

Choose the option between Share Map as a link or Embed Map to get the html iframe to attach in the webpage. Here you can also two security of the map by selecting Public or Private.

Embed Map
Embed Map

Check the article Share your Map to understand the Share Map feature of IGISMap.

Check other articles:
Check the following IGISMap tools: