In this guide, we’ll walk you through how to efficiently convert your GML files to PDF using the powerful Converter Tool in MAPOG Map Analysis. Whether you’re a beginner or an experienced user, Converting GML to PDF with MAPOG, this tutorial will help you understand the process in easy steps.
Key Concept to Converting files
The Converter Tool is a feature in MAPOG Map Analysis that helps you change your data from one format to another. It’s like magic! You give it your data in one form, and it transforms it into another form that you need for your analysis. Additionally, with GIS Data, you can download data in any format, making it versatile and adaptable for various applications.
Converting GML to PDF
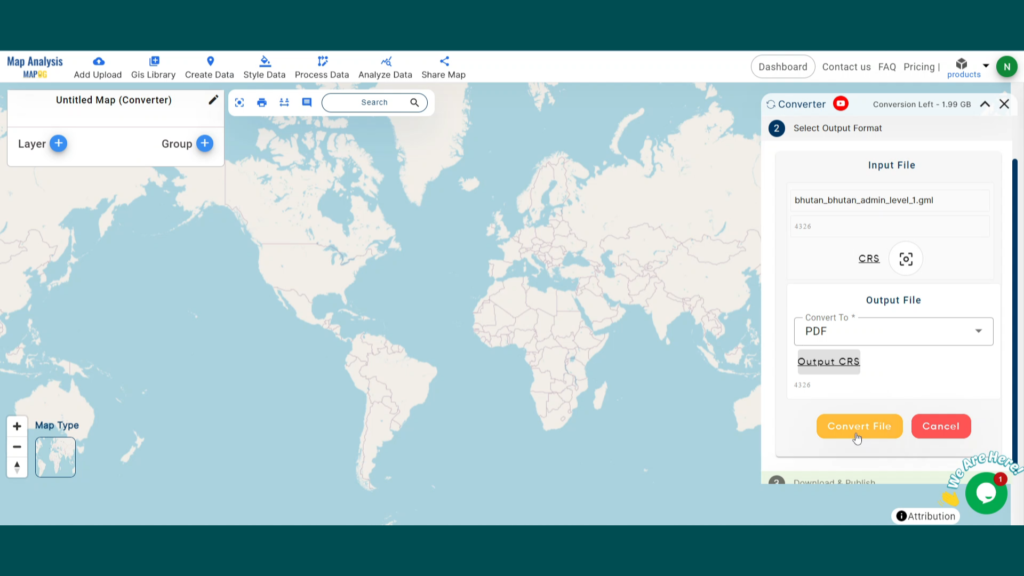
Step 1: Upload the Data
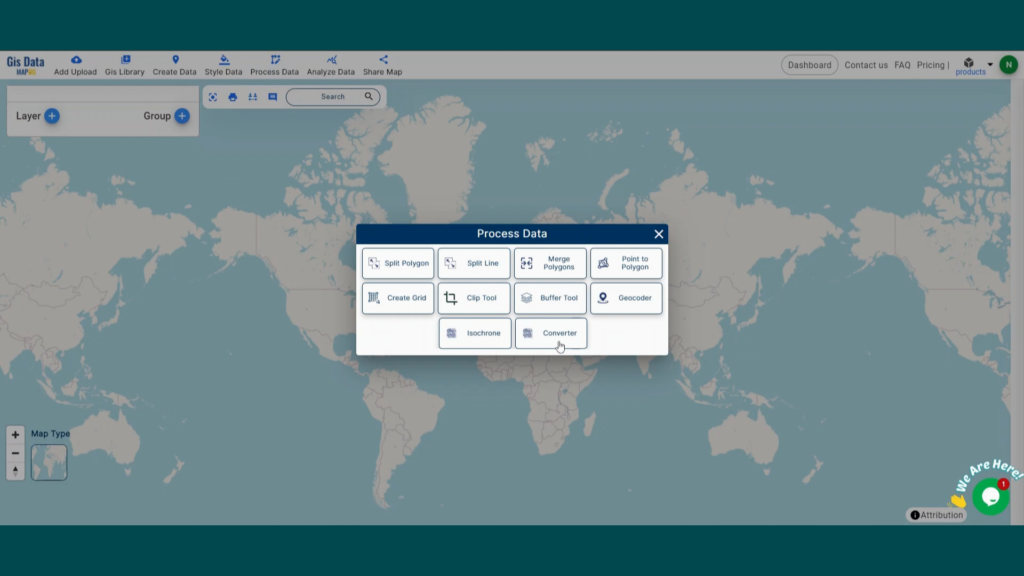
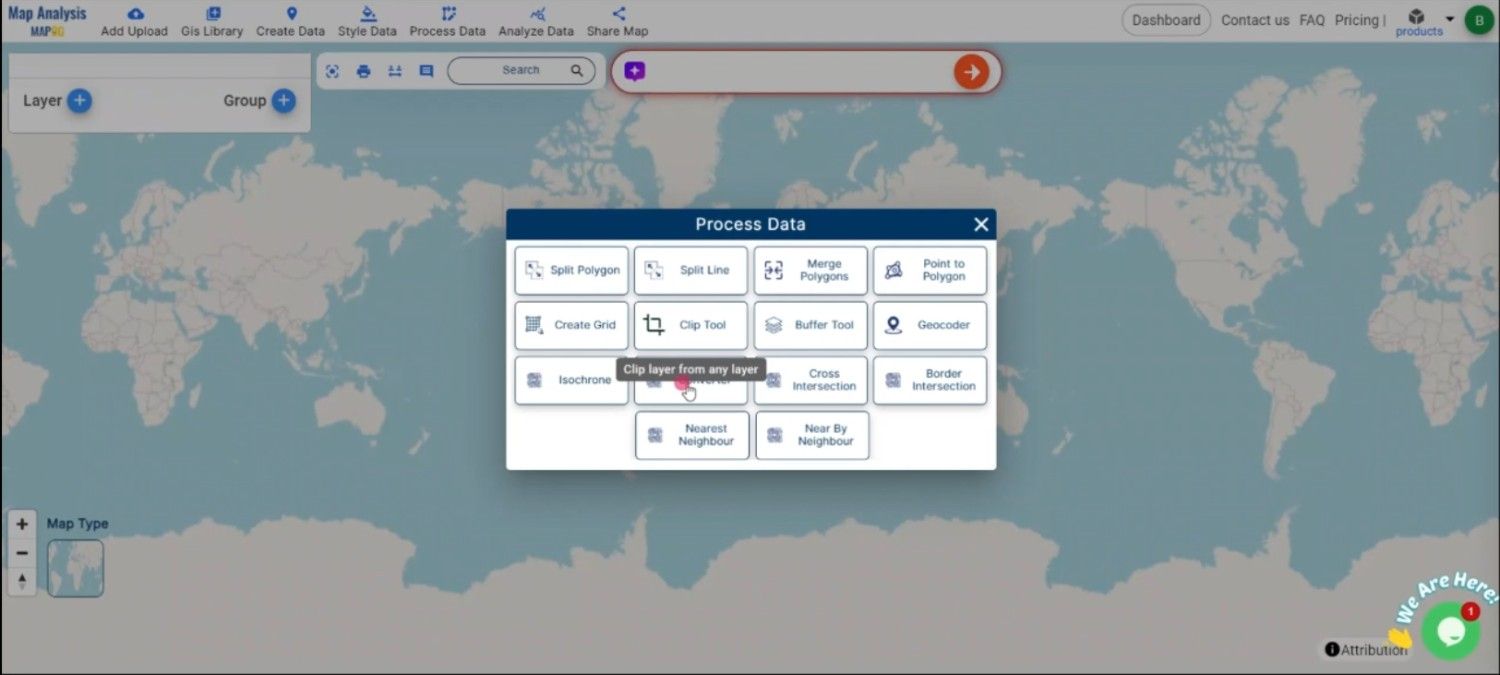
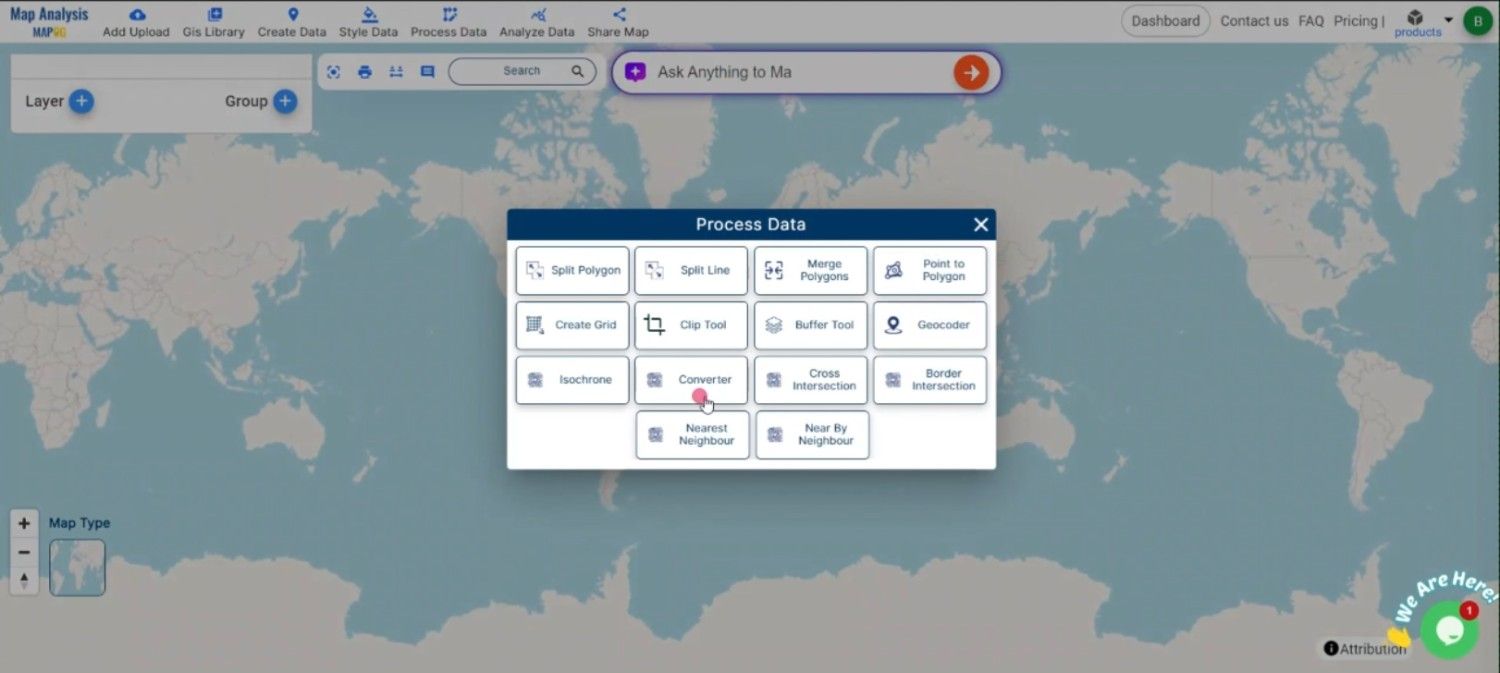
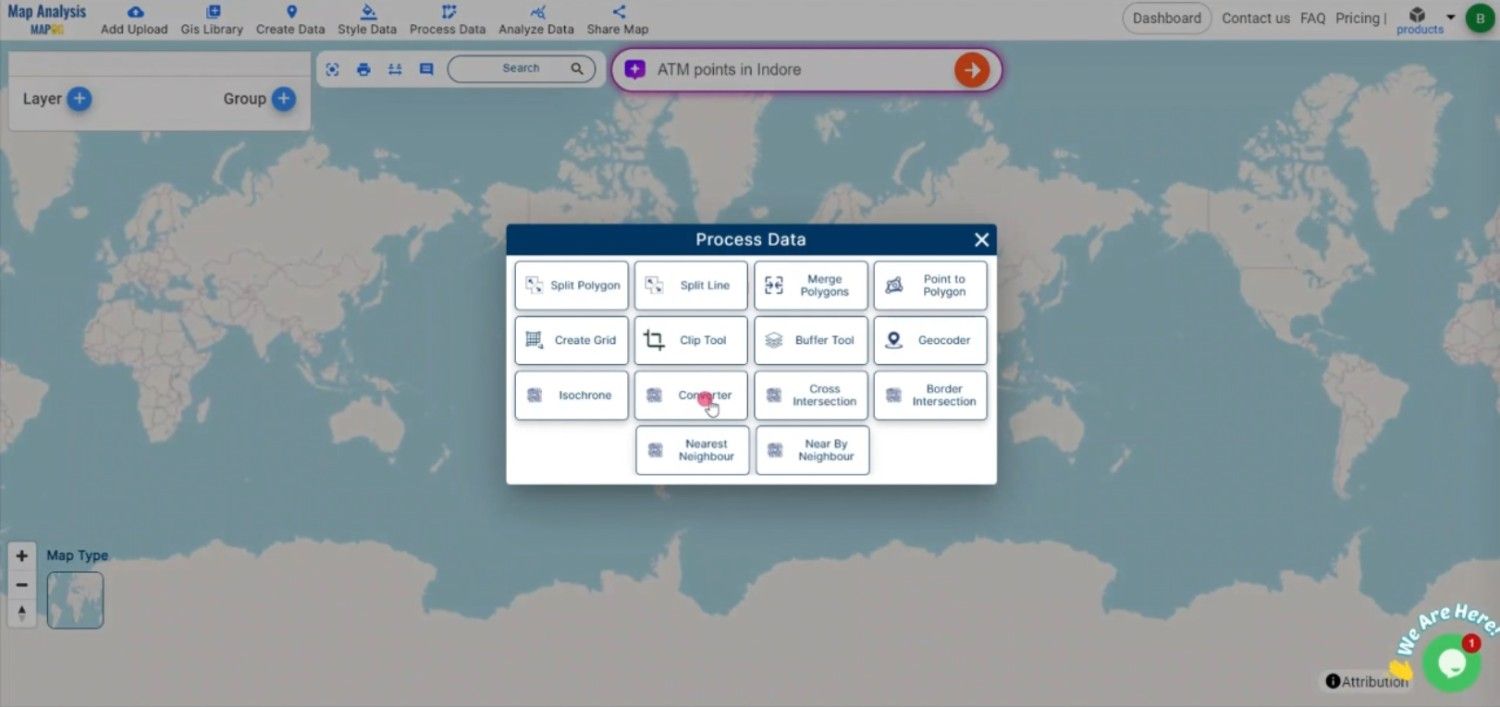
1. Click on the “Process Data” menu and choose the “Converter Tool” option.
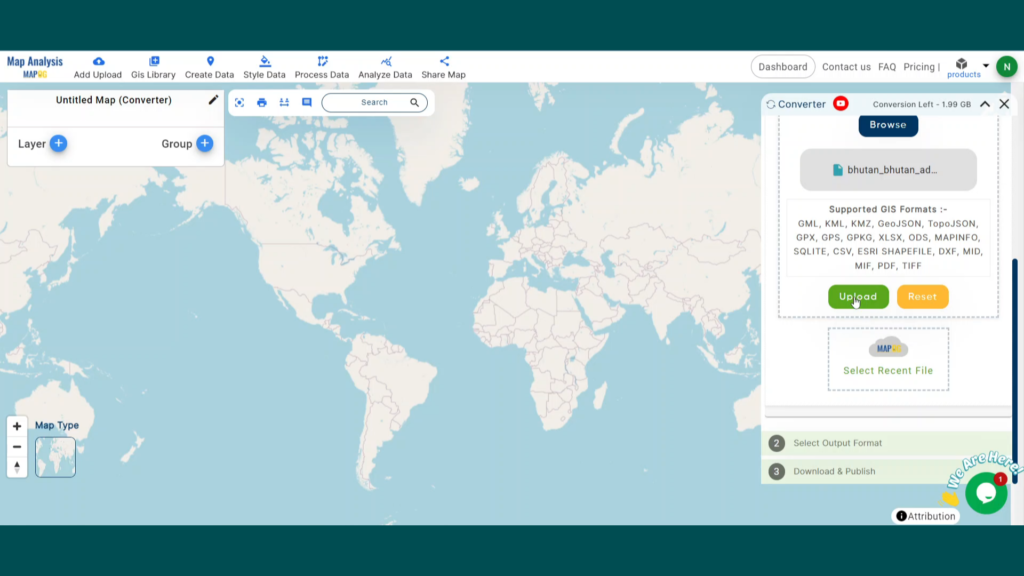
2. Upload your GML file. This is your starting point where you provide the data that needs conversion.
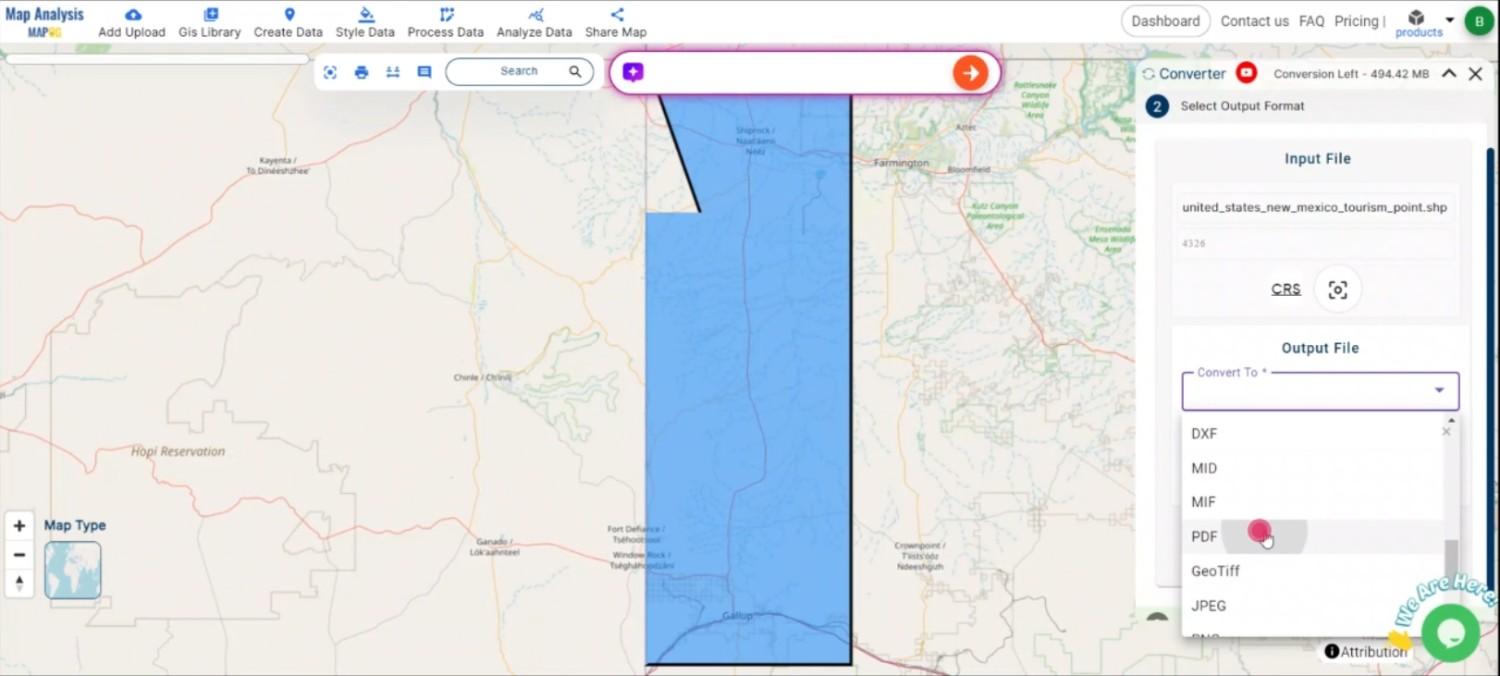
Step 2: Select the Format for Conversion
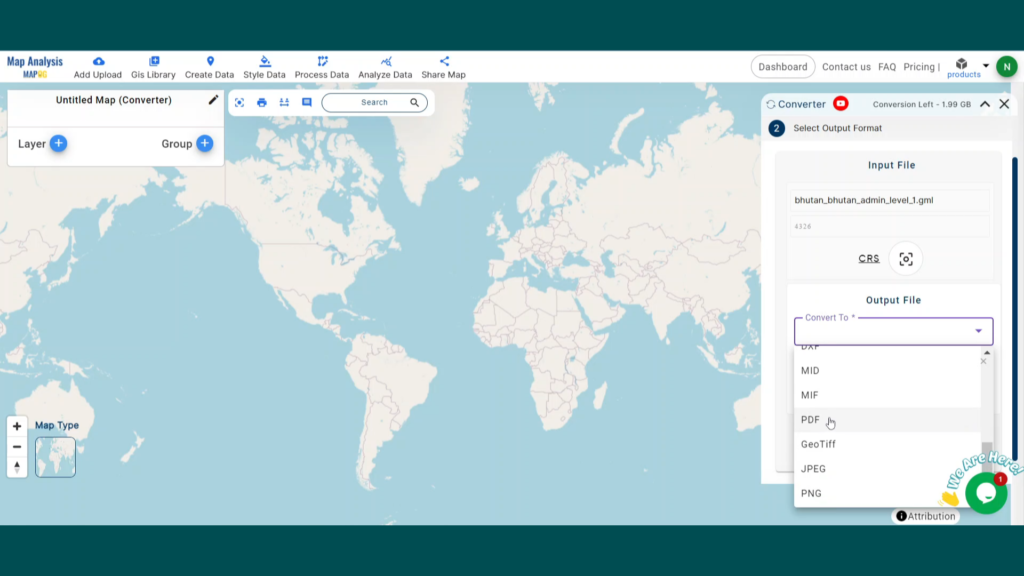
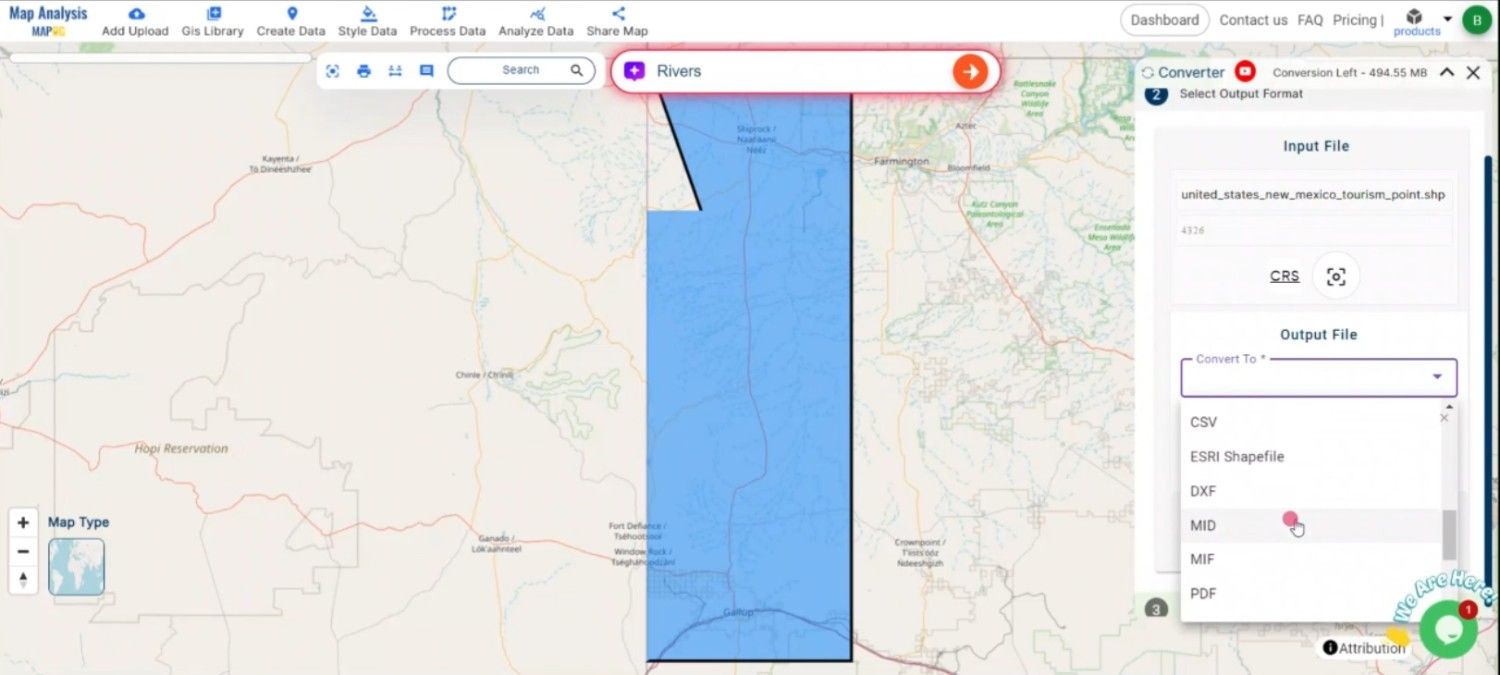
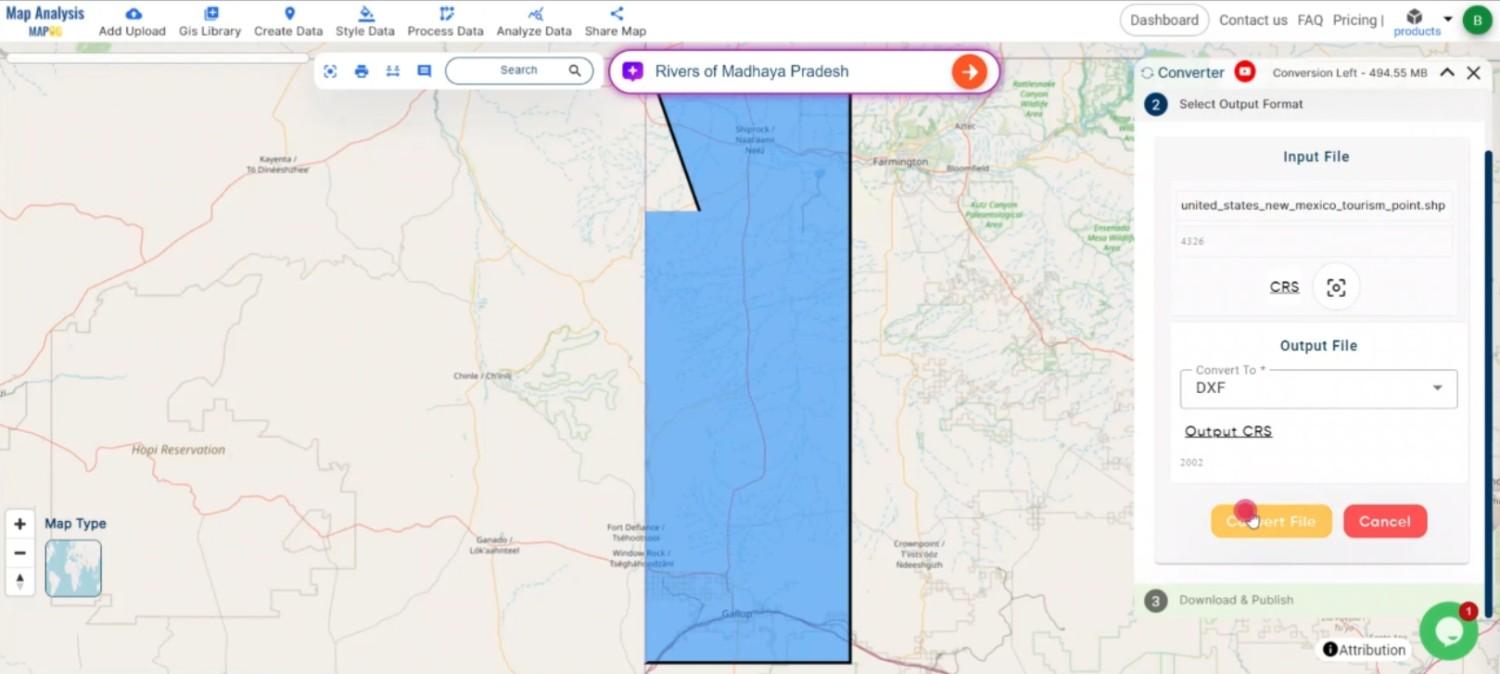
1. Choose the output file format as PDF. The tool offers various formats, but for this guide, we are focusing on converting to PDF.
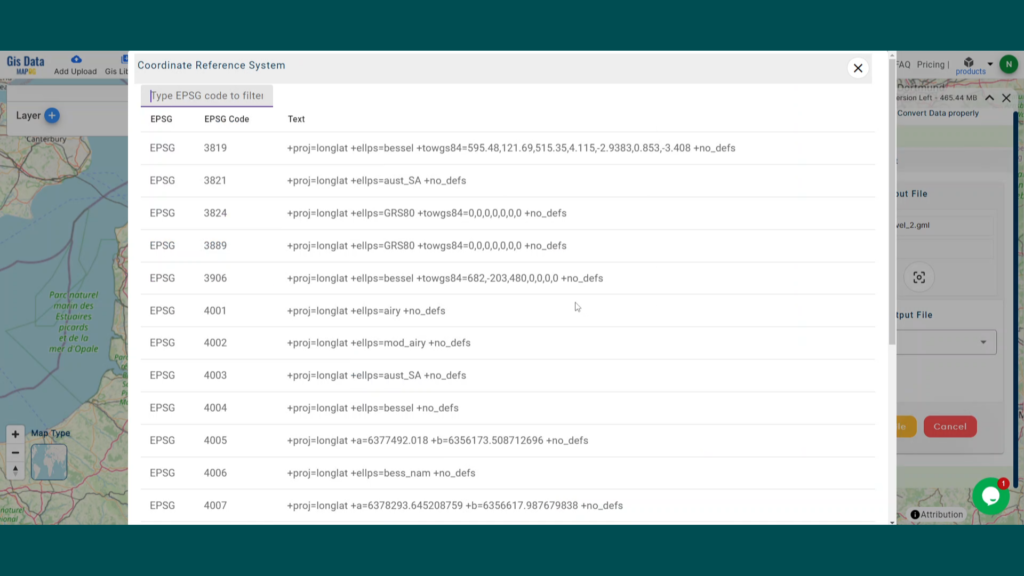
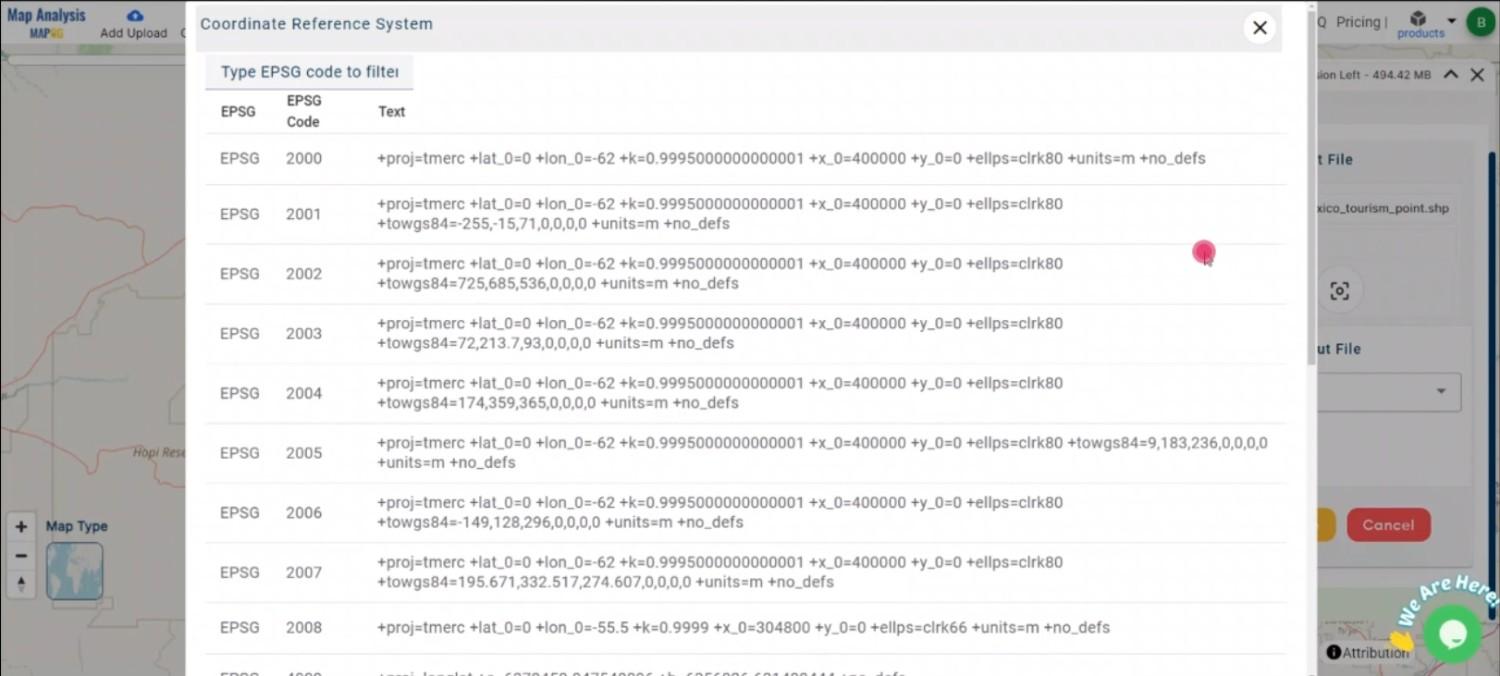
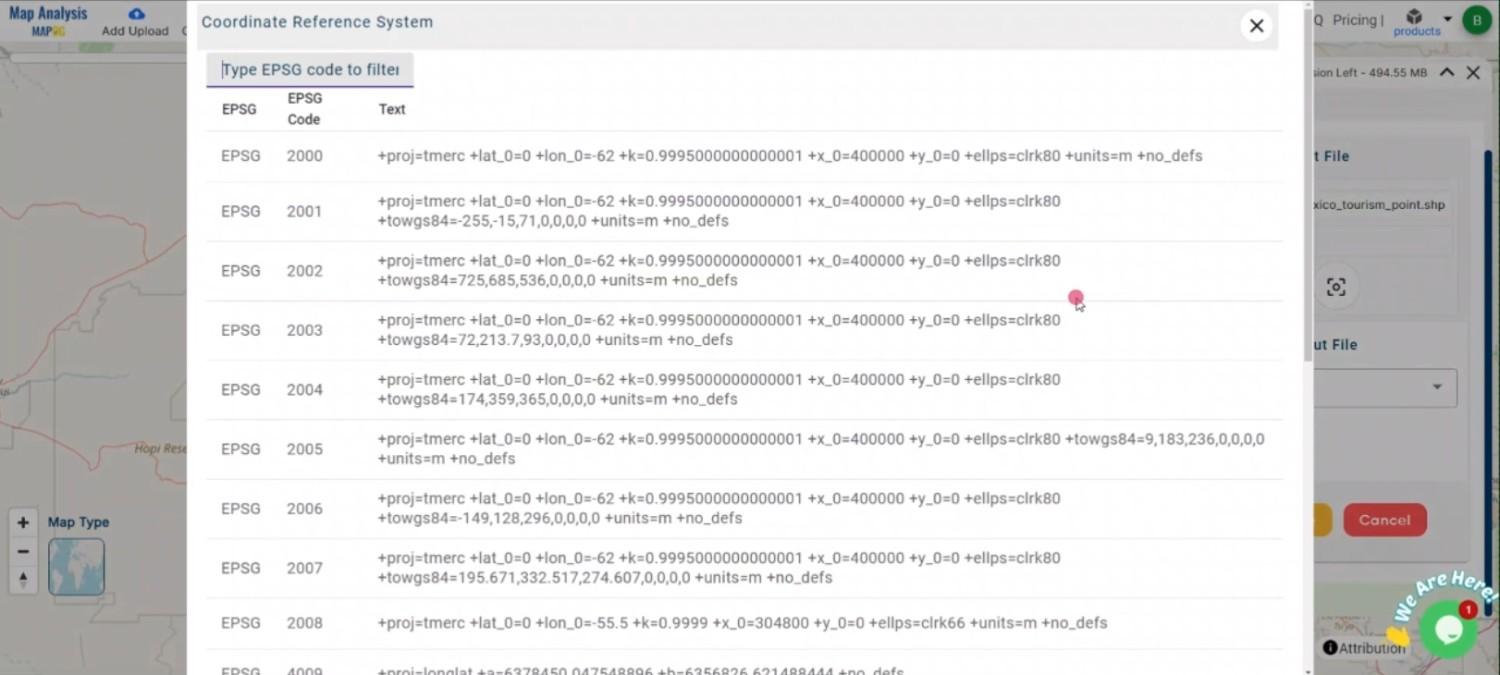
2.You can also set the CRS at this stage.
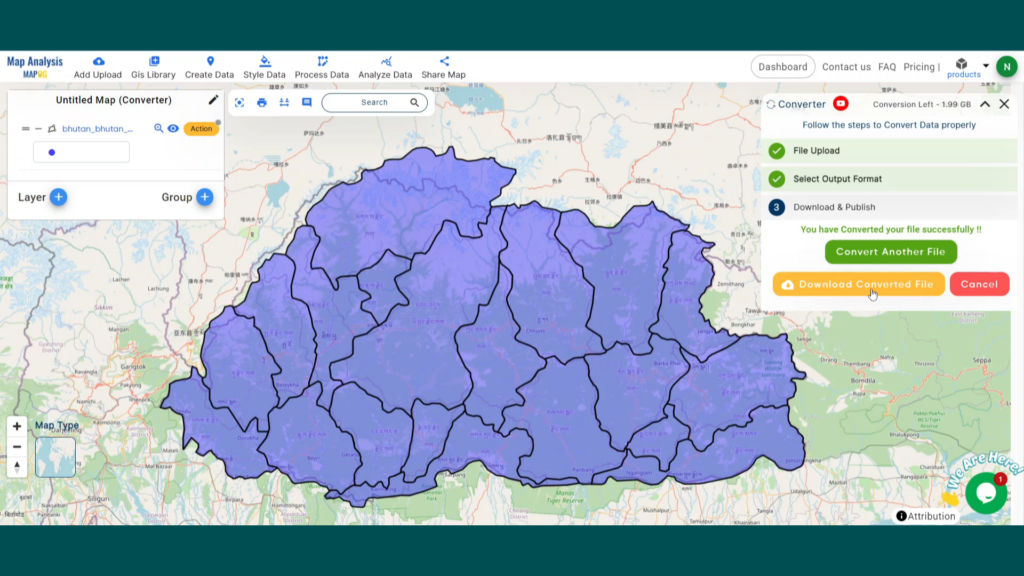
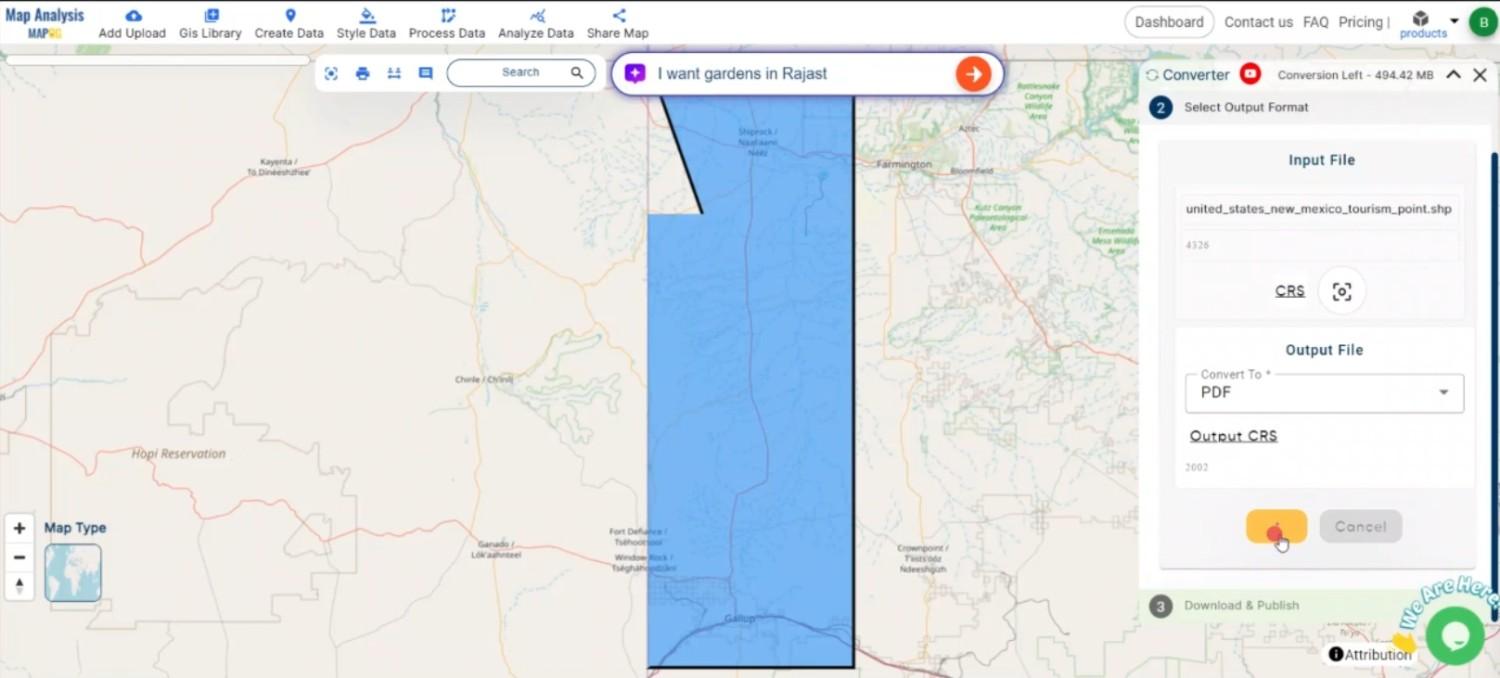
Step 3: Run the Conversion
Click ‘Convert’ and let the tool work its magic. The Converter Tool processes your data, transforming it from GML to PDF format.
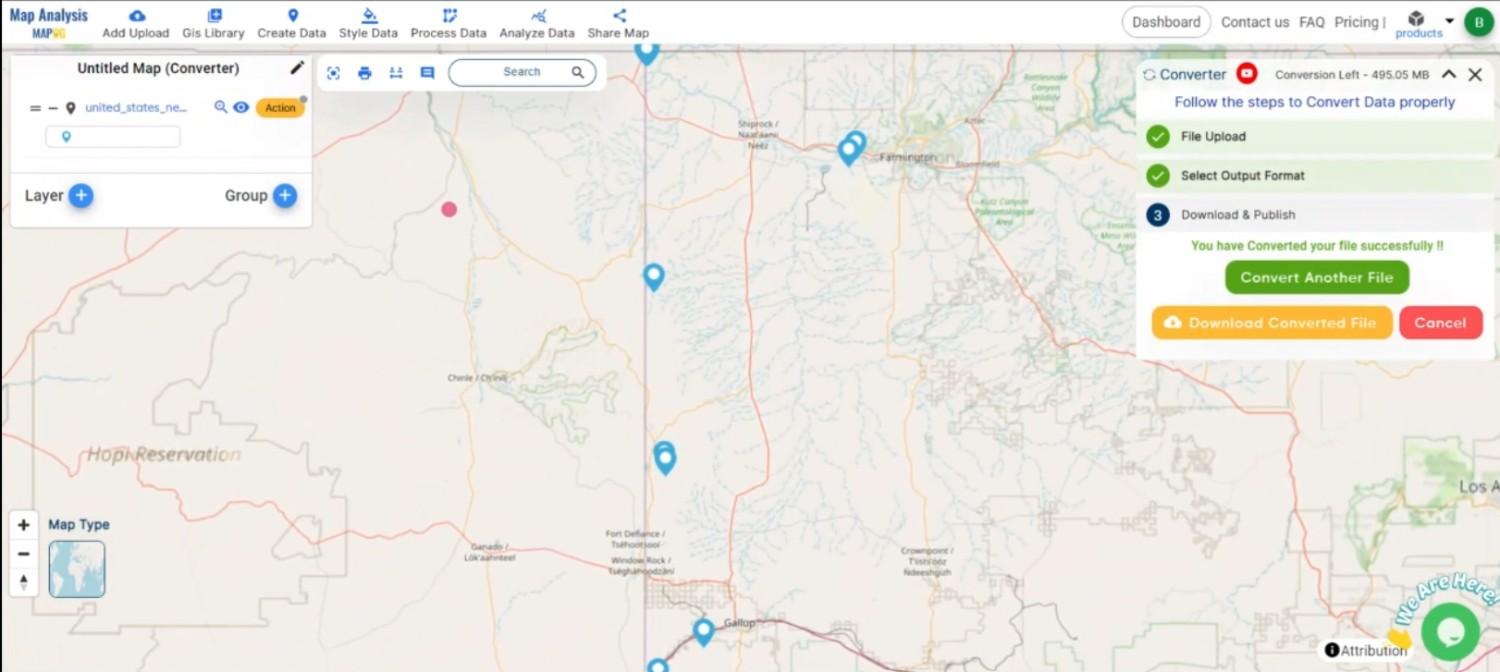
Step 4: Review and Download
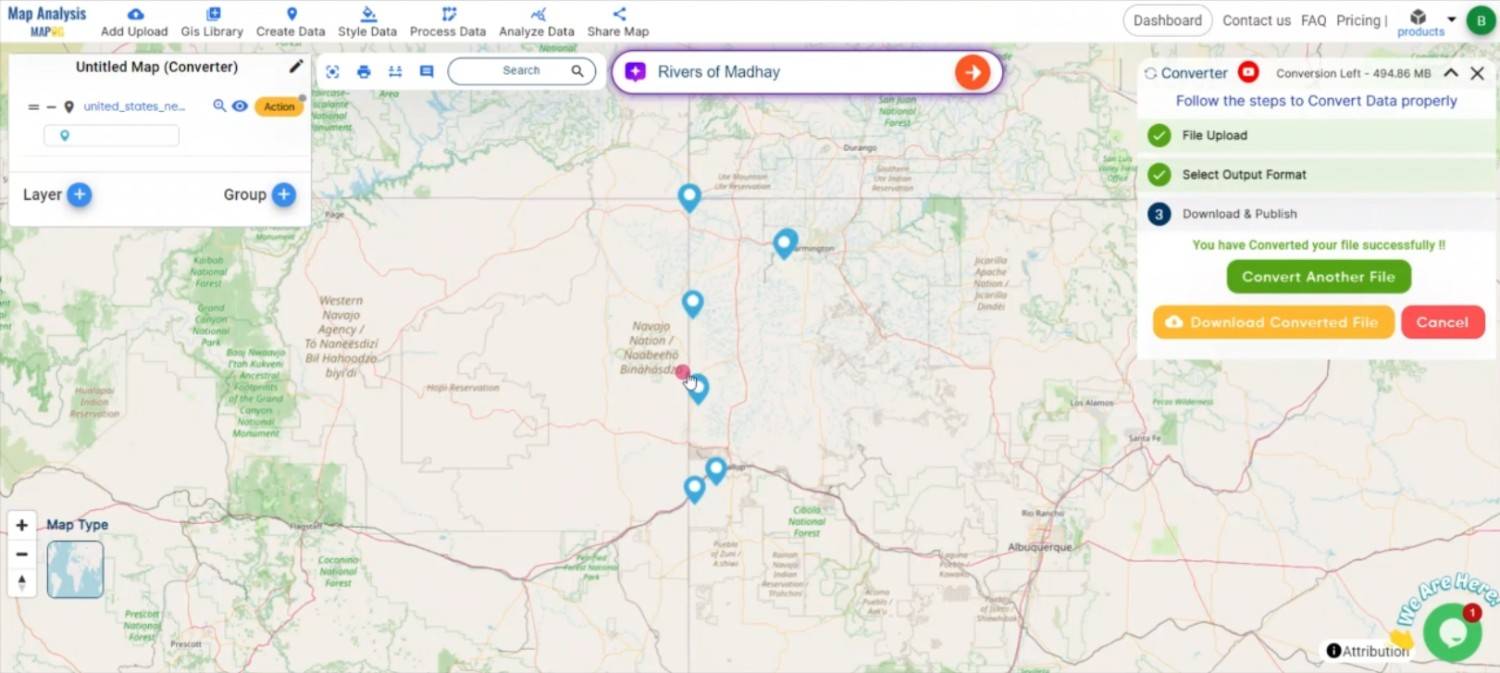
Finally, review your converted PDF data to ensure it looks right. Once satisfied, download the converted file. This step is crucial to verify that the conversion has been successful and the data integrity is maintained.
And there you have it! You’ve successfully used the Converter Tool in MAPOG Map Analysis to convert your GML Files to PDF. Now you can easily convert your data for all your analysis needs. This feature simplifies the process of handling different data formats, making your workflow more efficient and effective.
You can quickly download town and city data in formats like Shapefile, KML, GeoJSON, and more. Whether you’re a GIS professional, urban planner, or researcher, detailed data from countries like the US, France, and Japan will boost your projects.
Accurate and up-to-date town, villages and city data is important for projects like urban planning, infrastructure development, and demographic studies. In this article, we’ll show you how to download Cities and Towns data in multiple GIS formats using the MAPOG GISDATA platform—a powerful tool that makes finding and converting data super easy.
We offer a wide range of data formats to ensure compatibility for various projects. These formats include KML, SHP, CSV, GeoJSON, Tab, SQL, Tiff, GML, KMZ, GPKZ, SQLITE, Dxf, MIF, TOPOJSON, XLSX, GPX, ODS, MID, and GPS.
Steps to Download Cities, Towns & Villages Data
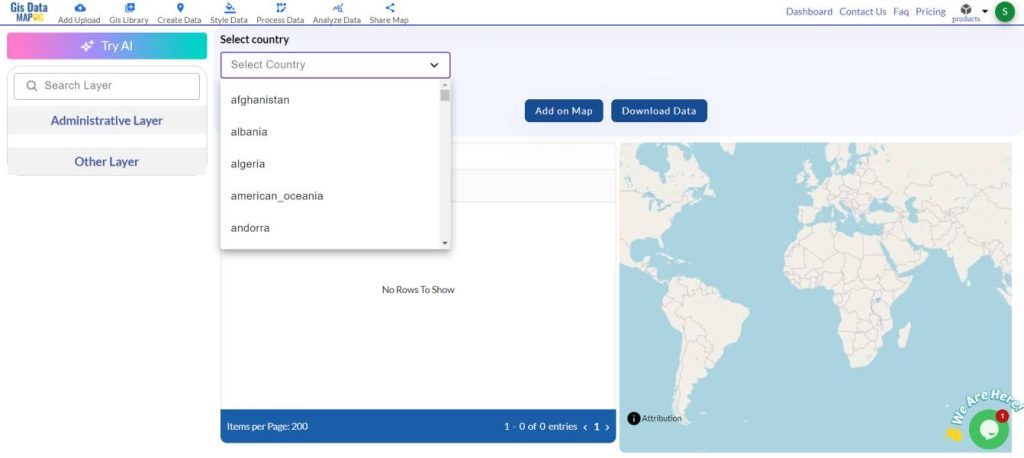
Step 1: Open MAPOG GISDATA and Search for the Country
Start by opening the MAPOG GISDATA platform. In the search bar, type the name of the country you need town and city data for, like the United States, France, or Japan. This will help you find the relevant urban data quickly.
Open MAPOG GISDATA and Search for the Country
Step 2: Use the AI Search Tool to Find USA Counties or States
MAPOG’s AI search tool is a great way to narrow your search. For example, if you’re looking for specific data within the USA, you can type something like “California counties” or “New York state.” The AI tool will find the relevant data for those areas, saving you time.
Use the AI Search Tool to Find USA Counties or States
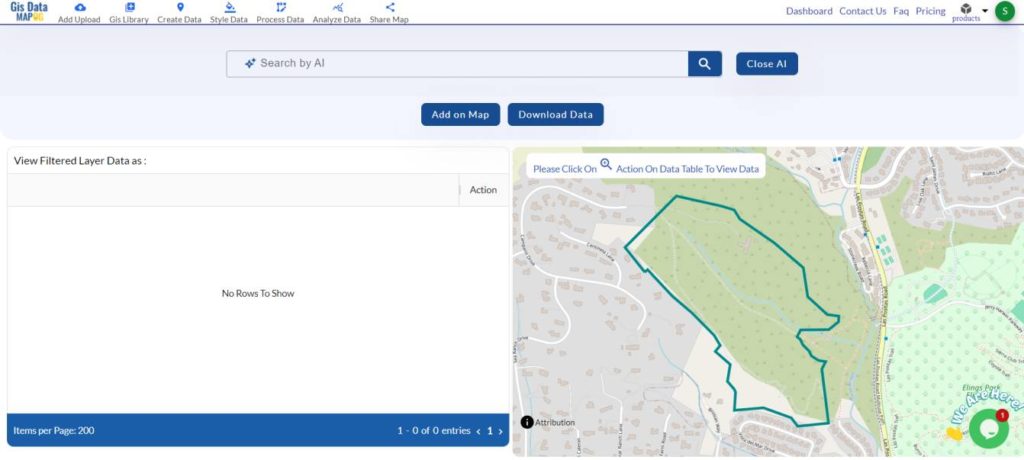
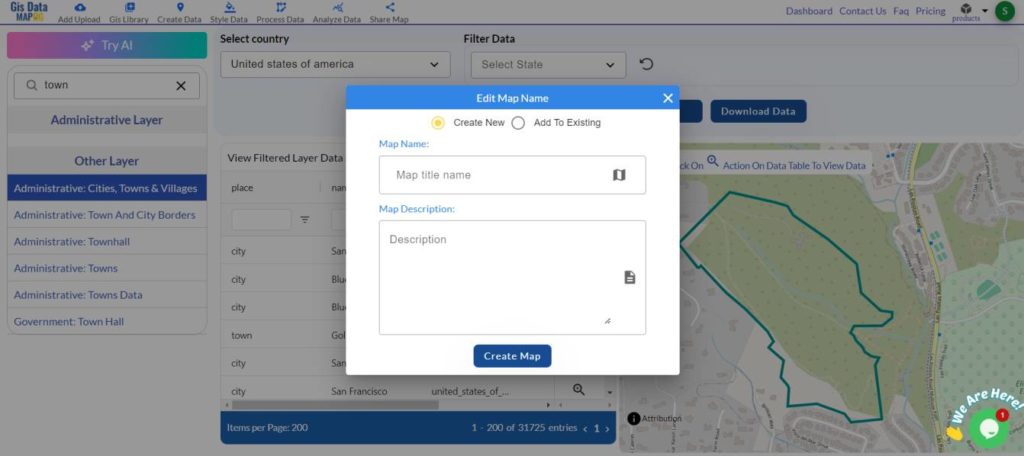
Step 3: Search for ‘Town and City Data’ and Filter the Layers
In the search bar, type “Town” or “City” to pull up urban data such as city boundaries or town limits. You can refine your search by using the “View Filtered Layer Data” option to zoom in on specific features. Click “Zoom to Action” to view the data in detail and ensure it fits your needs
Search for ‘Town and City Data’ and Filter the Layers
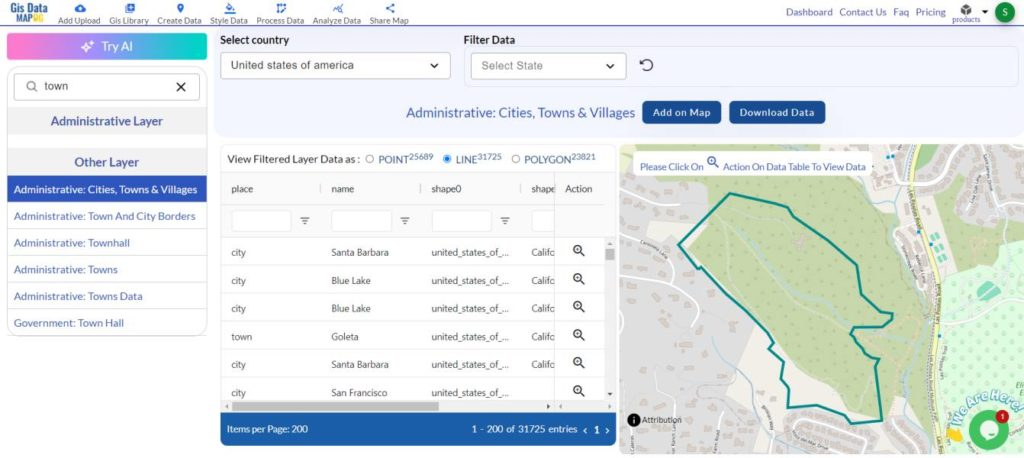
Step 4: Add the Data to the Map for Visual Analysis
Once you’ve selected the town or city data, click “Add to Map.” This will allow you to visualize the data directly on the map. You can zoom in and explore specific towns or cities in more detail.
Add the Data to the Map for Visual Analysis
Step 5: Download the Data
After reviewing the data, simply click “Download.” You can choose your preferred format—Shapefile, KML, GeoJSON, or any of the other available formats—and download the data for your project.
Download the Data
Conclusion
The MAPOG GISDATA platform makes accessing and downloading town and city data quick and easy. Whether you’re working on urban planning, infrastructure projects, or research, these simple steps will help you get the data you need in the format that works best for you. If you need assistance, feel free to contact us at support@mapog.com.
With MAPOG’s powerful tools, you can also upload vector and raster files, add WMS layers, import Excel or CSV data, and even convert different data formats to suit your needs.
Disclaimer: The GIS data provided for download in this article was originally sourced from OpenStreetMap (OSM) and modified to improve usability. The original data is licensed under the Open Database License (ODbL) by the OpenStreetMap contributors. Any use, redistribution, or modification of this data must comply with the ODbL license terms. For more information, please visit OpenStreetMap’s License Page.
Disclaimer : If you find any shapefile data of country provided is incorrect do contact us or comment below, so that we will correct the same in our system as well we will try to correct the same in openstreetmap.
GIS Data by MAPOG is a user-friendly platform that offers access to various GIS data formats like Shapefile, KML, and GeoJSON. It provides a user-friendly interface to download protected area data efficiently including administrative and geographic data sets, enabling detailed mapping and analysis of protected areas worldwide.
Understanding the Process
MAPOG simplifies the process of downloading protected area data using GIS Data by MAPOG, offering a step-by-step guide for over 200 countries and 900+ layers an extensive array of data formats, including Shapefile and KML, for various applications.
The platform supports multiple data formats, including KML, SHP, CSV, GeoJSON, Tab, SQL, Tiff, GML, KMZ, GPKZ, SQLITE, Dxf, MIF, TOPOJSON, XLSX, GPX, ODS, MID, and GPS, ensuring compatibility and accessibility for a range of GIS tools and analyses.
Note:
All data is available in GCS datum EPSG:4326 WGS84 CRS (Coordinate Reference System).
Users must log in to download data in their preferred format.
Step-by-step Process to Download Protected Area Data
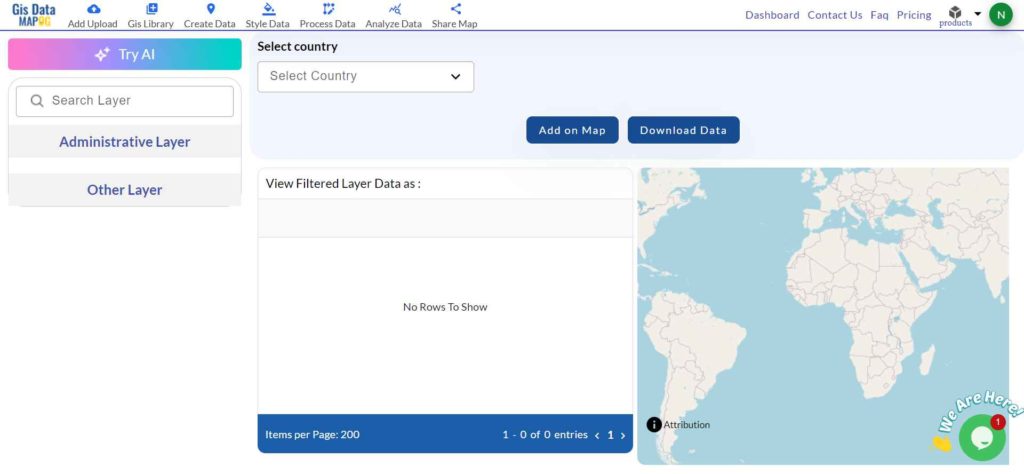
Step 1: Open GIS Data
First, log in to MAPOG with a valid email address. Once logged in, navigate to the GIS data section.
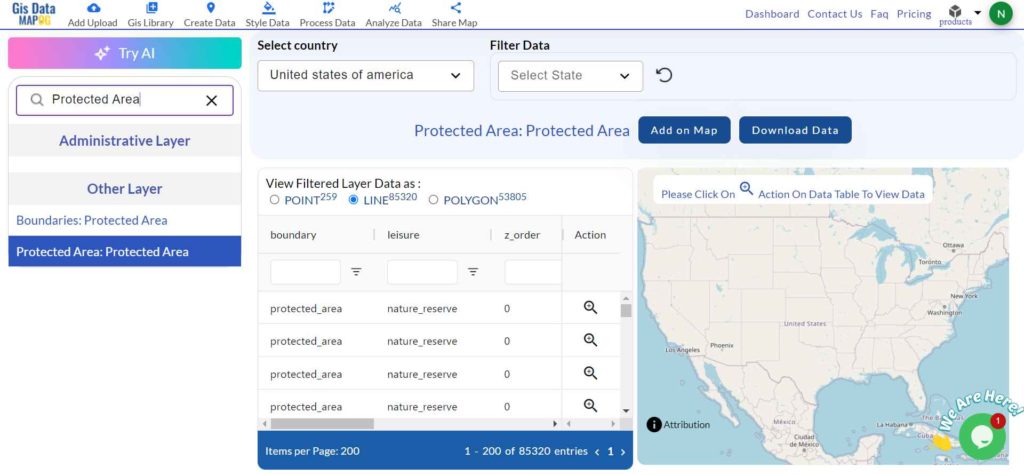
Step 2: Search for ‘Protected Area Data’
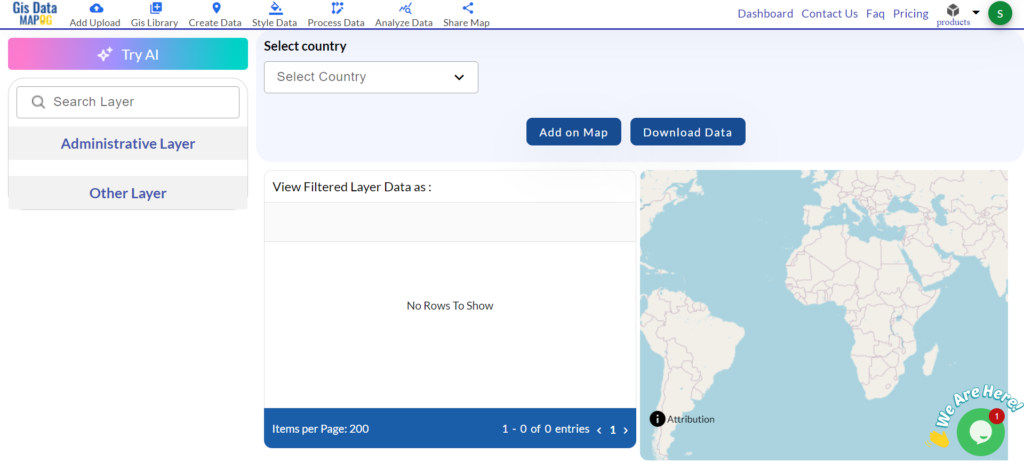
After accessing the GIS Data interface, select the desired country. Then, use the search layer option to locate your required data layer, such as “protected areas“. You can review the data attributes, including whether the data is formatted as a point or polygon.
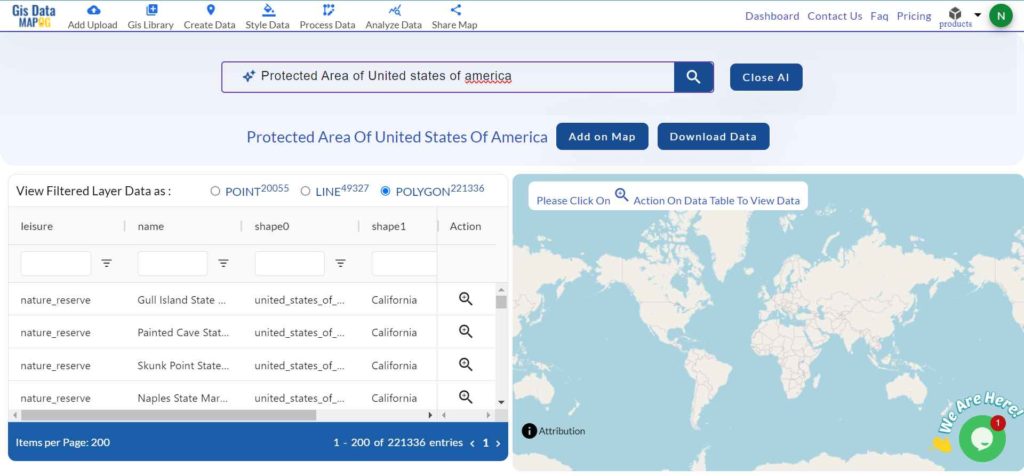
Additionally, try the AI tool, “Try AI,” located in the upper left corner, which simplifies the data search process. Just enter what data you need and from which area, and it will provide the relevant results.
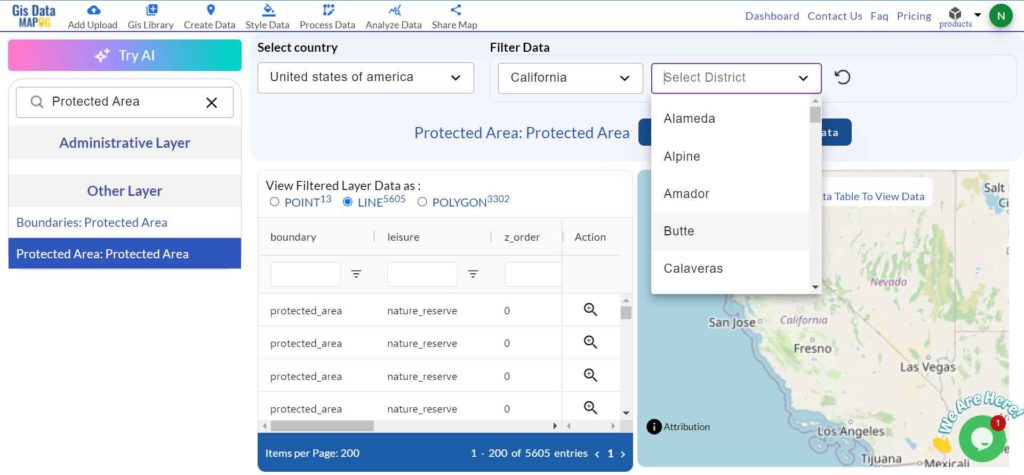
Step 4: Filter Data
Utilize the filter data option in GIS Data by MAPOG to refine your search based on specific states or districts. This feature allows users to delve deeper into country-wide datasets, focusing on granular details such as particular protected regions, enhancing data accuracy and relevance for analysis or mapping.
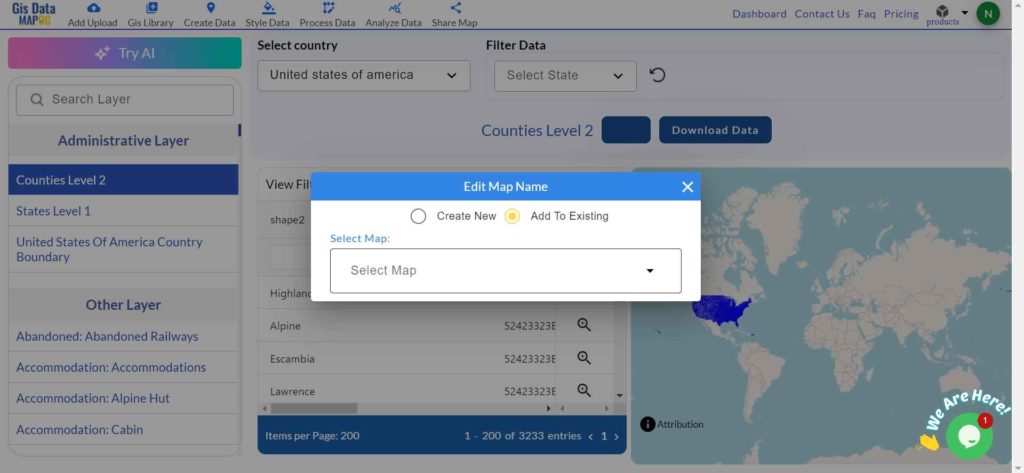
Step 5: Add on Map
With MAPOG’s GIS Data “Add on Map” feature, users can overlay the selected data onto a Map analysis interface, supporting deeper insights into spatial relationships and patterns. By clicking “Add on Map,” users can either add the dataset to a new map or integrate it into an existing one, enhancing their GIS projects.
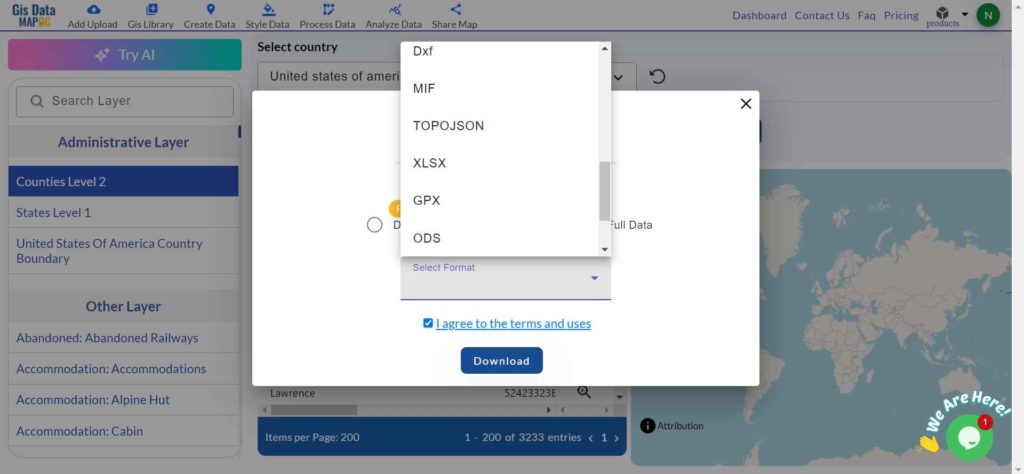
Step 5: Download Data
Click on the “Download Data” button. You will have two options: download sample data or the full dataset. Choose based on your needs. From the format selection options, pick the format you require—such as Shapefile, KML, GeoJSON, or one of the 15+ supported formats. Agree to the terms and conditions, then click the download button one last time to initiate the download.
Conclusion
MAPOG’s GIS Data allows users to download protected area data in multiple GIS formats, providing comprehensive and up-to-date geographic information for various applications like conservation planning, environmental management, and policy development, making it an invaluable tool for GIS professionals and enthusiasts.
Disclaimer : The GIS data provided for download in this article was initially sourced from OpenStreetMap (OSM) and further modified to enhance its usability. Please note that the original data is licensed under the Open Database License (ODbL) by the OpenStreetMap contributors. While modifications have been made to improve the data, any use, redistribution, or modification of this data must comply with the ODbL license terms. For more information on the ODbL, please visit OpenStreetMap’s License Page.
MAPOG is a powerful tool that helps you find and download tourism-related data. This data can be used to create maps, plan trips, and explore various locations. In this guide, we will show you how to download tourism data from MAPOG in multiple formats.
GIS Data is a type of data that helps you visualize and analyze geographical locations on a map. With MAPOG, you can access GIS data that includes tourism information, such as tourist spots, hotels, and transportation. This data can be downloaded in different formats to use in your mapping projects or research. MAPOG also allows you to search for specific layers and filter data by region or state, making it easy to find the exact tourism data you need.
Note:
All data provided by MAPOG is in the GCS datum EPSG:4326 WGS84 CRS (Coordinate Reference System).
To download data in shapefile format, you will need to log in to the platform.
Tourism data is essential for many reasons. It helps travelers plan their trips by identifying key attractions, routes, and accommodations. Businesses and planners can also use this data to analyze tourist trends and optimize services. With MAPOG GIS Data, you can download tourism information in various formats such as KML, SHP, CSV, GeoJSON, and more, allowing you to work with different programs for your project or analysis.
Step-by-Step Guide to Download Tourism Data
Step 1: Open GIS Data Log in to MAPOG with your email address. Once logged in, access the GIS Data tool from the top navigation menu. You can search for the forest data category or use the search bar to find the specific data you need, like tourism data for countries such as the USA, Canada, Brazil, and India.
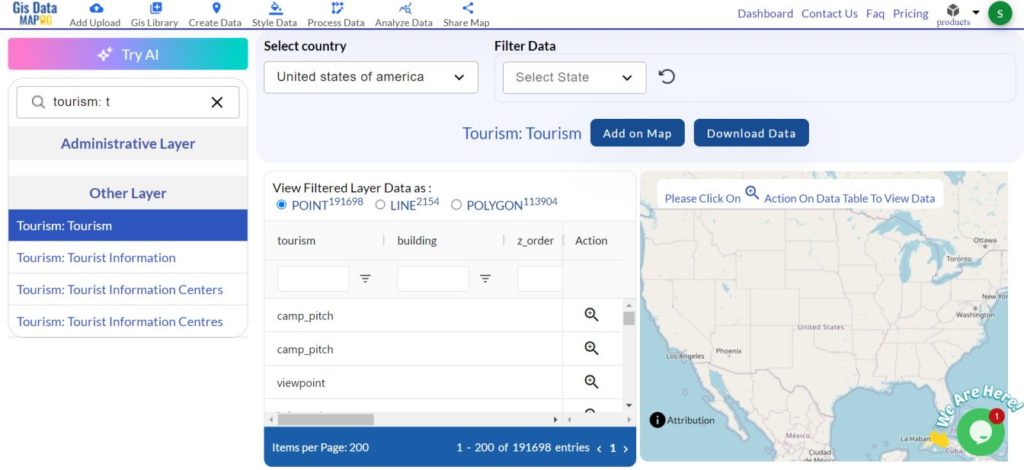
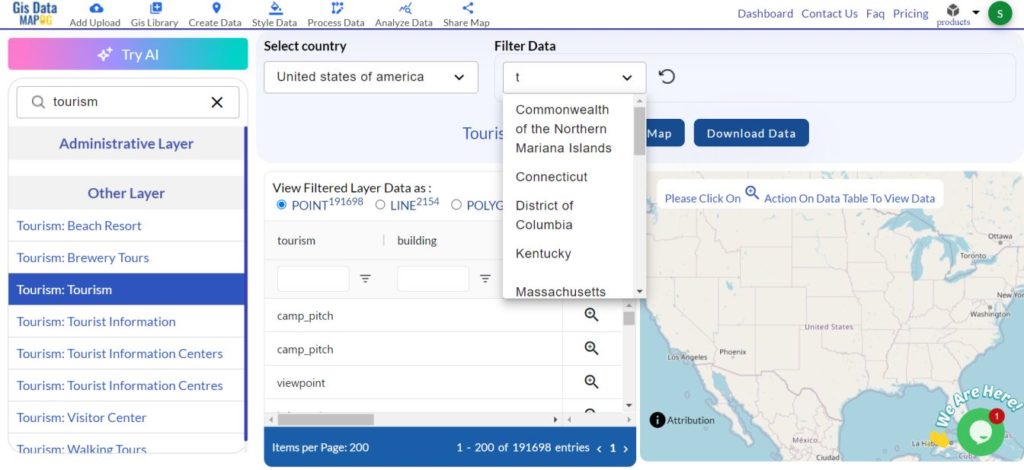
Step 2: Select the Country and Search ‘tourism Data’ Select your country of interest.
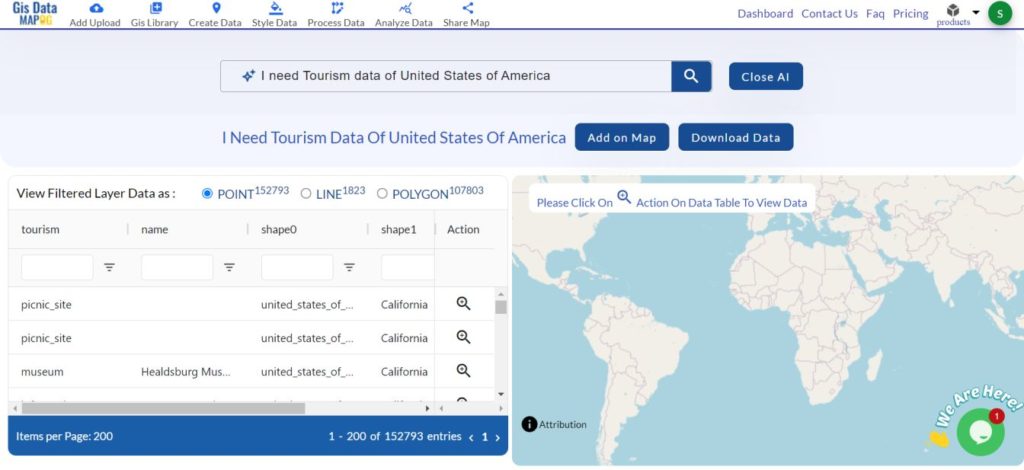
If you’re unsure which data to choose then the “Try AI” feature can offer smart suggestions to help you find the right information.
Step 3: Filter the Data Use the available filters to refine the data and You can select specific regions, types of tourism, or other criteria to get the exact information you need for your project.
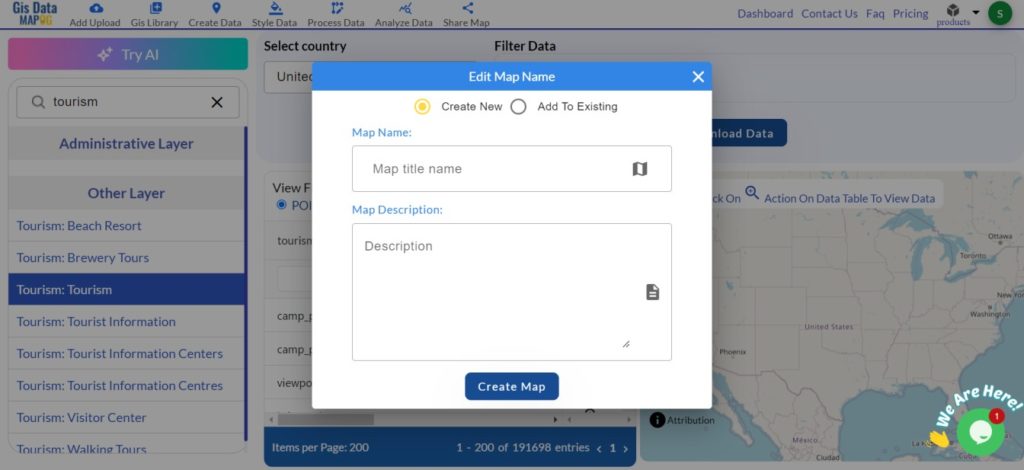
Step 4: Add to Map Once you’ve filtered the data, add it to your map. This will display the tourism locations, helping you visualize their distribution on the map.
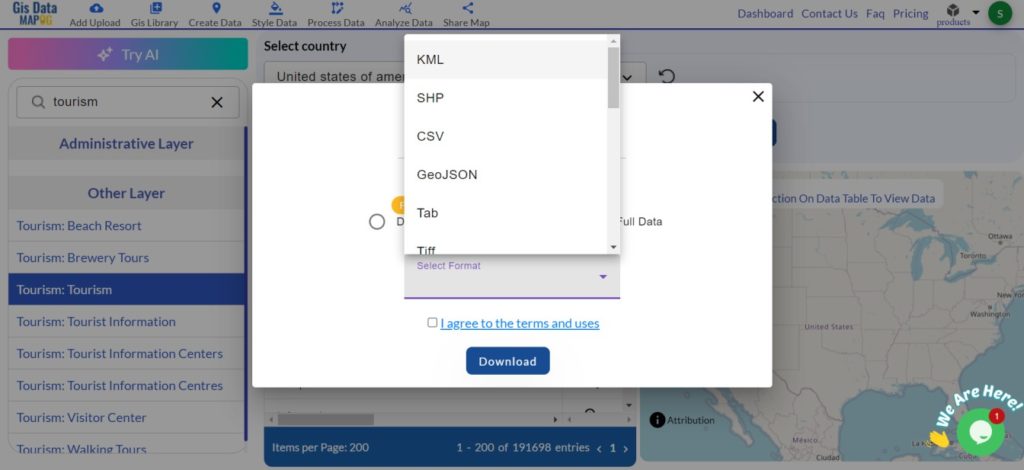
Step 5: Download the Data After reviewing the map, click the download button to save the data. You can choose from various file formats to suit your project requirements.
Tourism data in MAPOG includes both point and polygon features. Point data represents individual locations such as tourist attractions, while polygon data outlines areas like parks or historical sites. These features help create detailed maps for better trip planning or analysis.
For more information or assistance with downloading Forest data, please contact us at support@mapog.com.
Disclaimer:
The GIS data provided for download in this article was initially sourced from OpenStreetMap (OSM) and further modified to enhance its usability. Please note that the original data is licensed under the Open Database License (ODbL) by the OpenStreetMap contributors. While modifications have been made to improve the data, any use, redistribution, or modification of this data must comply with the ODbL license terms. For more information on the ODbL, please visit OpenStreetMap’s License Page.
A crucial element of the GIS process is file conversion, which ensures that geospatial data can be easily utilized across different applications. SHP (Shapefile) is a widely recognized format in GIS, representing GIS features. MIF is a widely used format in MIF GIS software for storing both geographic data and its associated attributes.
What is SHP File?
In GIS, a popular geographic vector data format is a SHP file (Shapefile). For spatial characteristics, it saves the attribute data—descriptive information—and geometry—points, lines, and polygons. SHP files are compatible with applications such as ArcGIS and QGIS, and are frequently used for mapping locations, boundaries, and other geographic data. In order to store associated data, they frequently come with extra files.
MAPOG MapAnalysis‘s Converter Tool provides an intuitive and user-friendly platform for converting data between various formats. Here’s a step-by-step guide on converting SHP files to MIF format using MAPOG.
Step-by-Step Guide to Converting SHP to MIF
Step 1: Upload the Data Begin by navigating to the Process Data section in MAPOG Map Analysis. Select the “Converter Tool” option. Before uploading your SHP file, ensure it is organized and ready for conversion.
Upload the Data
Step 2: Select the Format for Conversion Next, choose MIF as the output file format for the Conversion.
Select the Format
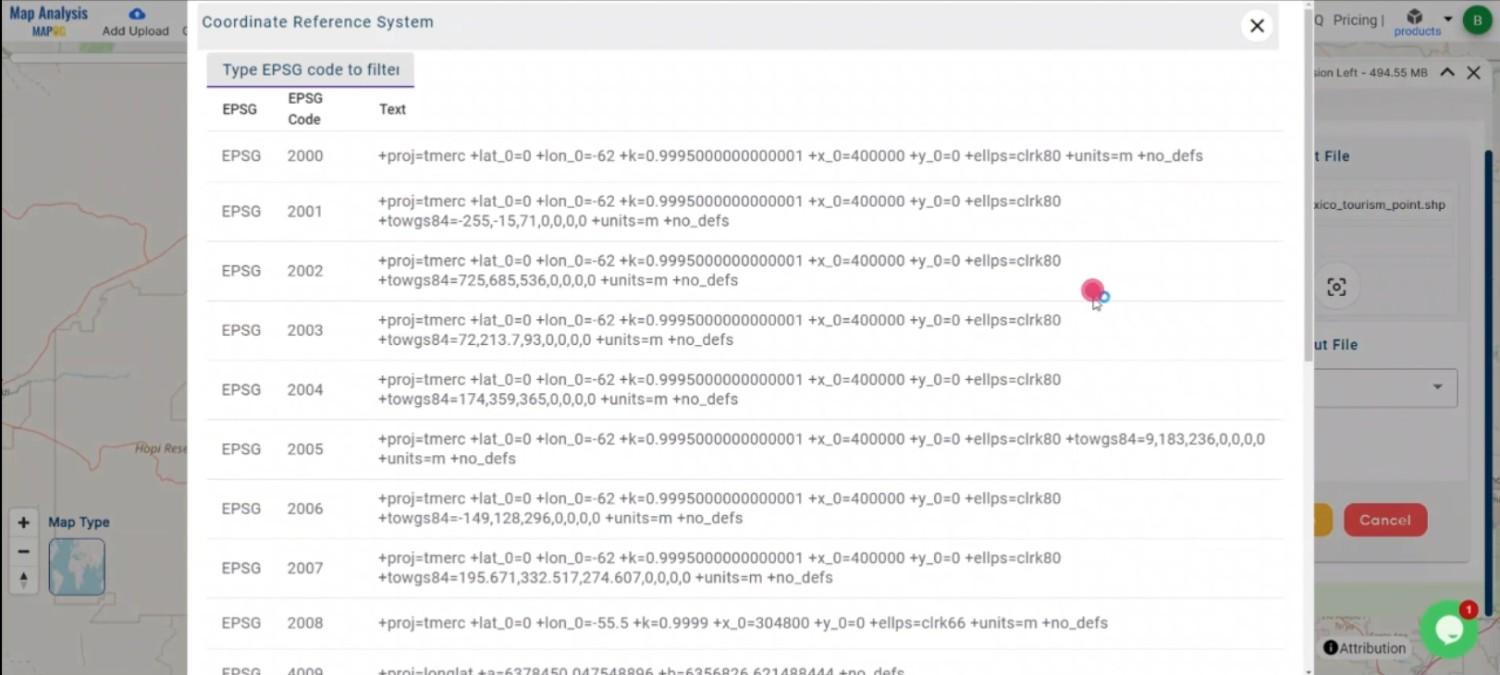
Step 3: Choose the Output Coordinate Reference System (CRS) If your data includes spatial information, select the appropriate CRS to ensure the accurate geographic representation in your MIF file.
Choose the Output CRS
Step 4: Execute the Conversion In this step, select the MIF format and set the CRS, initiate the conversion process.
Execute the Excursion
Step 5: Review and Download After the conversion is complete, review the output to ensure that the data was correctly converted. Finally, download the MIF file.
Review the Data
Conclusion:
The MAPOG Converter Tool simplifies the process of converting GIS data between different formats, making it an invaluable resource for GIS professionals. If you need to download any data file in SHP or in any other formats like GEOJSON, DXF. Visit GIS DATA, here we have 900+ data layers for 200+ countries.
Story by MAPOG is perfect for viewers who wants to bring their data to life through interactive and visually engaging maps. It allows you to tell powerful stories, blending maps with multimedia elements like images and text. Whether you’re showcasing a project, presenting research or guiding a tour.
Here are some other blogs you might be interested in:
File conversion is an essential step in the GIS process that guarantees the easy use of geographic data in various applications. A popular GIS format for displaying geographic features including is SHP (Shapefile).
What is SHP File?
In GIS, a popular geographic vector data format is a SHP file (Shapefile). For spatial characteristics, it saves the attribute data—descriptive information—and geometry—points, lines, and polygons. SHP files are compatible with applications such as ArcGIS and QGIS, and are frequently used for mapping locations, boundaries, and other geographic data. In order to store associated data, they frequently come with extra files.
MAPOG MapAnalysis‘s Converter Tool provides an intuitive and user-friendly platform for converting data between various formats. Here’s a step-by-step guide on converting SHP files to PDF format using MAPOG.
Step-by-Step Guide to Converting SHP to PDF
Step 1: Upload the Data Start by navigating to the “Process Data” section in MAPOG Map Analysis. Select the “Converter Tool” option. Before uploading your SHP file, ensure it is organized and ready for conversion.
Upload the Data
Step 2: Select the Format for Conversion Next, choose PDF as the output format. PDF is ideal for creating easy-to-share, printable maps that can be viewed on any device.
Select the Format
Step 3: Choose the Output CRS
In this step, select the format choose the Output CRS.
Choose the Output CRS
Step 4: Execute the Conversion After choosing the Output CRS and PDF formats. Your SHP file will be correctly converted to a PDF by the MAPOG Converter tool.
Execute the Conversion
Step 5: Review and Download In the last step, conversion is complete, review the output to ensure that the data and design were correctly rendered.
Review the Data
Conclusion:
For GIS specialists, the MAPOG Converter Tool is a priceless tool that makes converting GIS data between various formats easier. These instructions will help you quickly convert SHP files to PDF files so that your geospatial data is ready for sharing and presenting. If you need to download any data file in SHP or in any other formats like KML, DXF. Visit GIS DATA, here we have 900+ data layers for 200+ countries.
Story by MAPOG is an engaging tool designed to combine storytelling with mapping, perfect for creating dynamic visual narratives. Imagine weaving your data into an interactive story where images, and text come together to bring insights to life. Whether it’s about exploring cities, showcasing environmental changes or highlighting cultural landmarks.
Here are some other blogs you might be interested in:
File conversion is an essential step in the GIS process that ensures the easy use of GIS data in various applications. A popular GIS format for displaying geographic features including points, lines, and polygons is SHP. Working with MapInfo GIS software requires the use of MID.
What is SHP File?
In GIS, a popular geographic vector data format is a SHP file (Shapefile). For spatial characteristics, it saves the attribute data—descriptive information—and geometry—points, lines, and polygons. SHP files are compatible with applications such as ArcGIS and QGIS, and are frequently used for mapping locations, boundaries, and other geographic data. In order to store associated data, they frequently come with extra files.
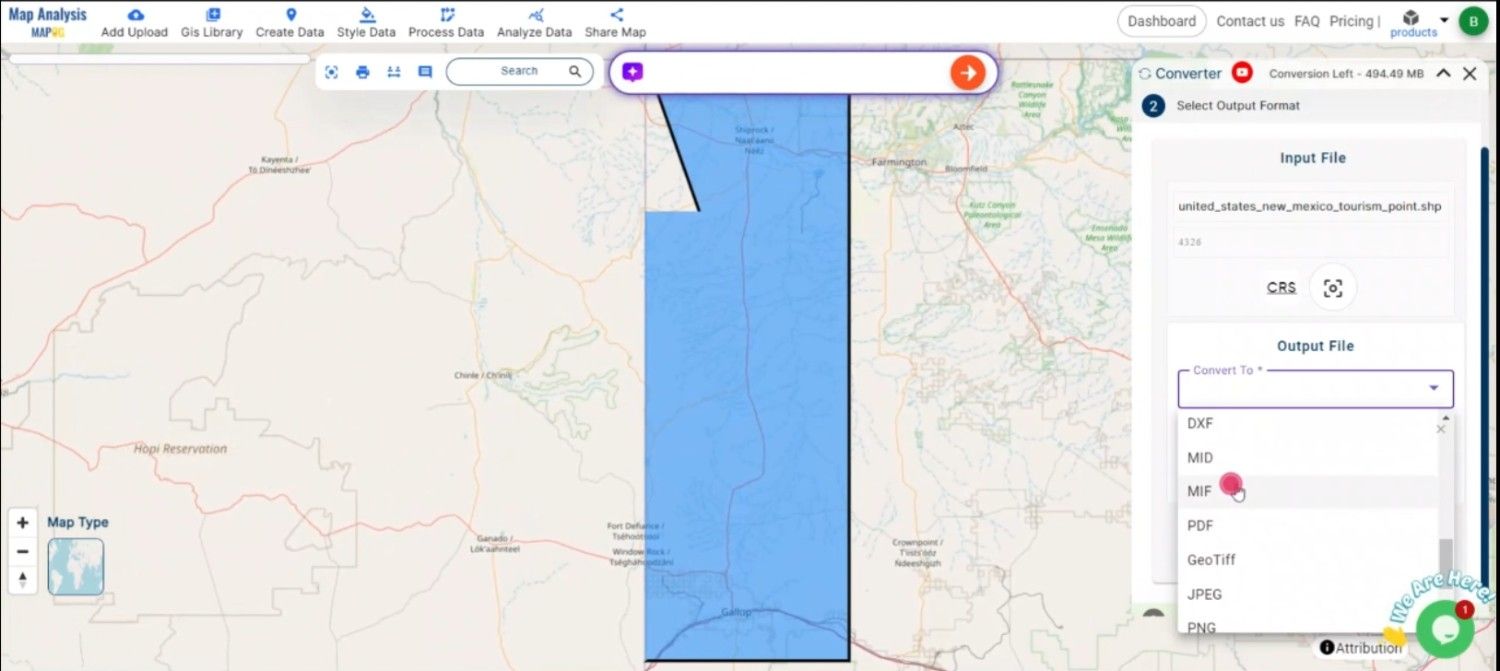
MAPOG MapAnalysis‘s Converter Tool offers a user-friendly platform for converting data between various formats. Its intuitive interface ensures users can complete the conversion process efficiently. Here’s a step-by-step guide on converting SHP files to MID format using MAPOG.
Step-by-Step Guide to Converting SHP to MID
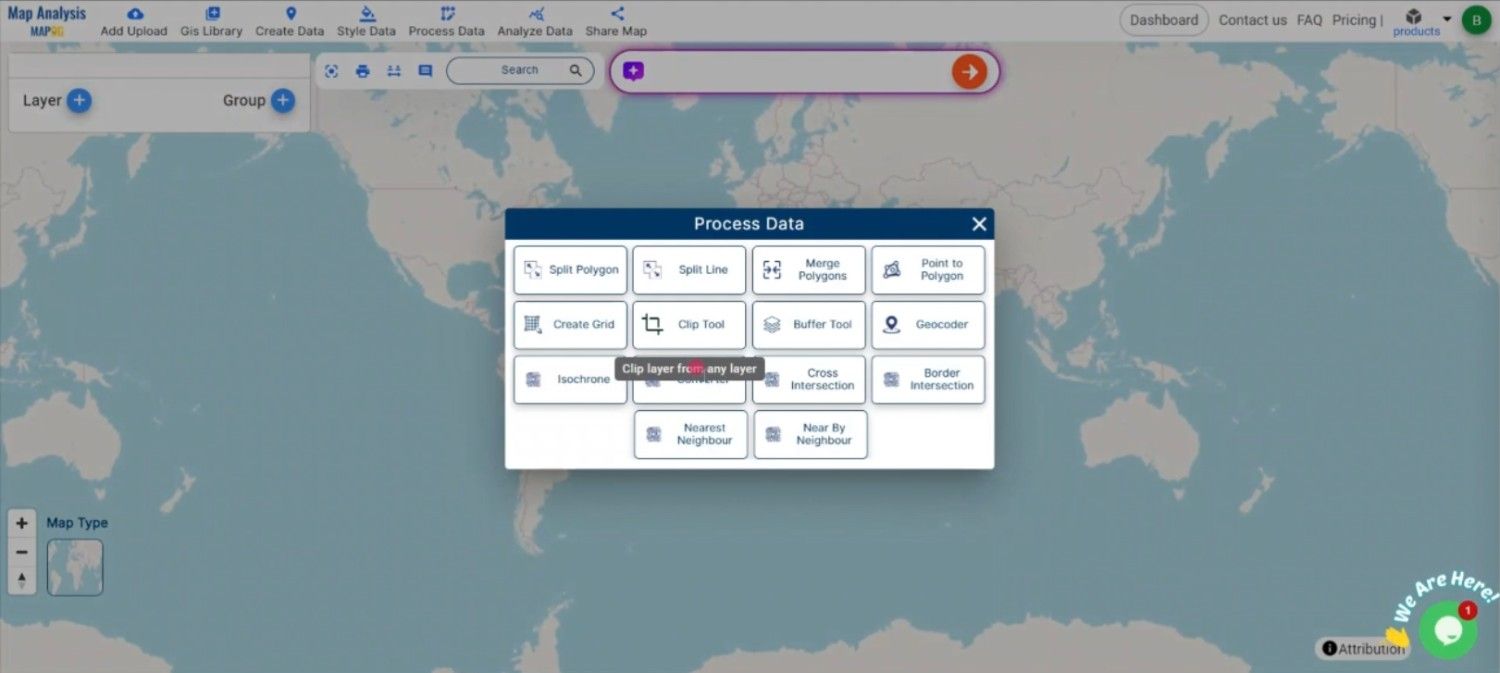
Step 1: Upload the Data Start by navigating to the “Process Data” section in MAPOG MapAnalysis. Select the “Converter Tool” option. Before uploading your SHP file, ensure it is organized and ready for conversion.
Upload the Data
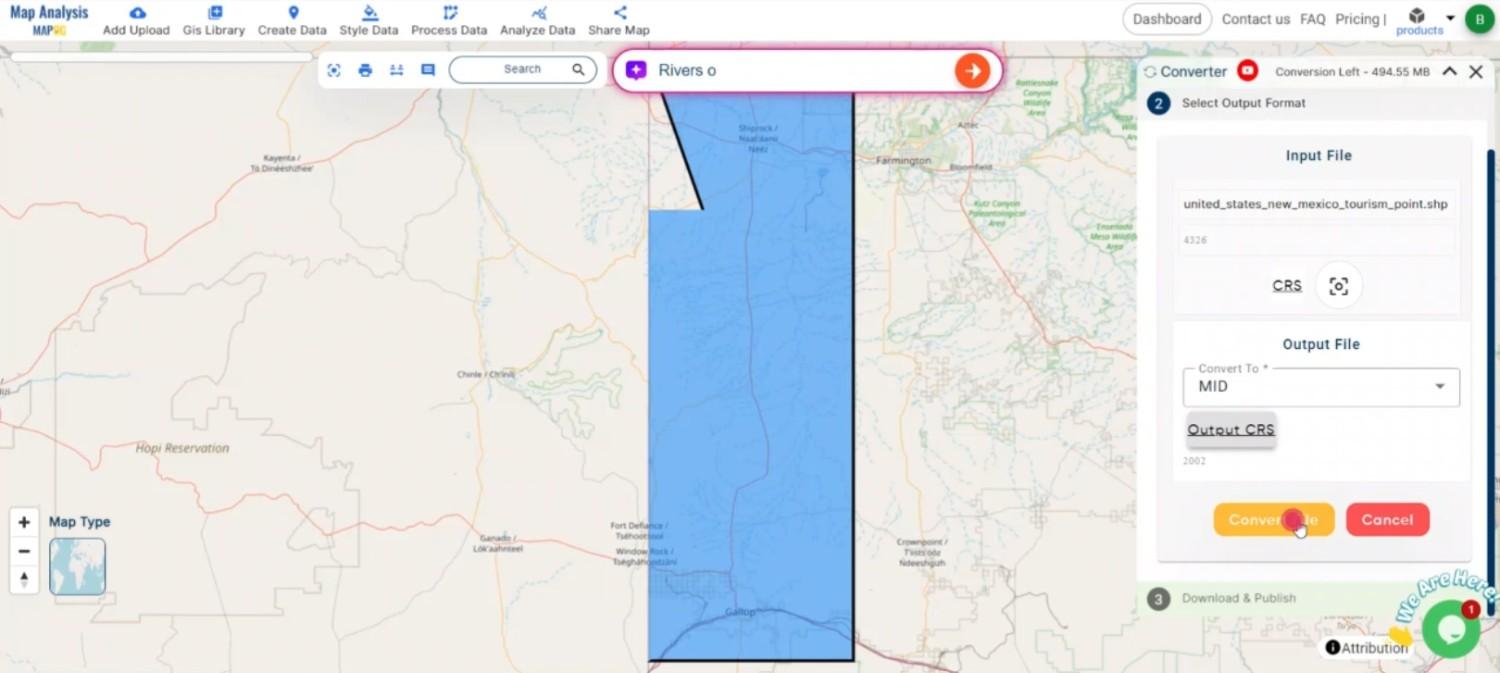
Step 2: Select the Format for Conversion Next, choose MID as the output format. MID is ideal for storing attribute data associated with geographic features, making it suitable for MapInfo applications.
Select the Format for Conversion
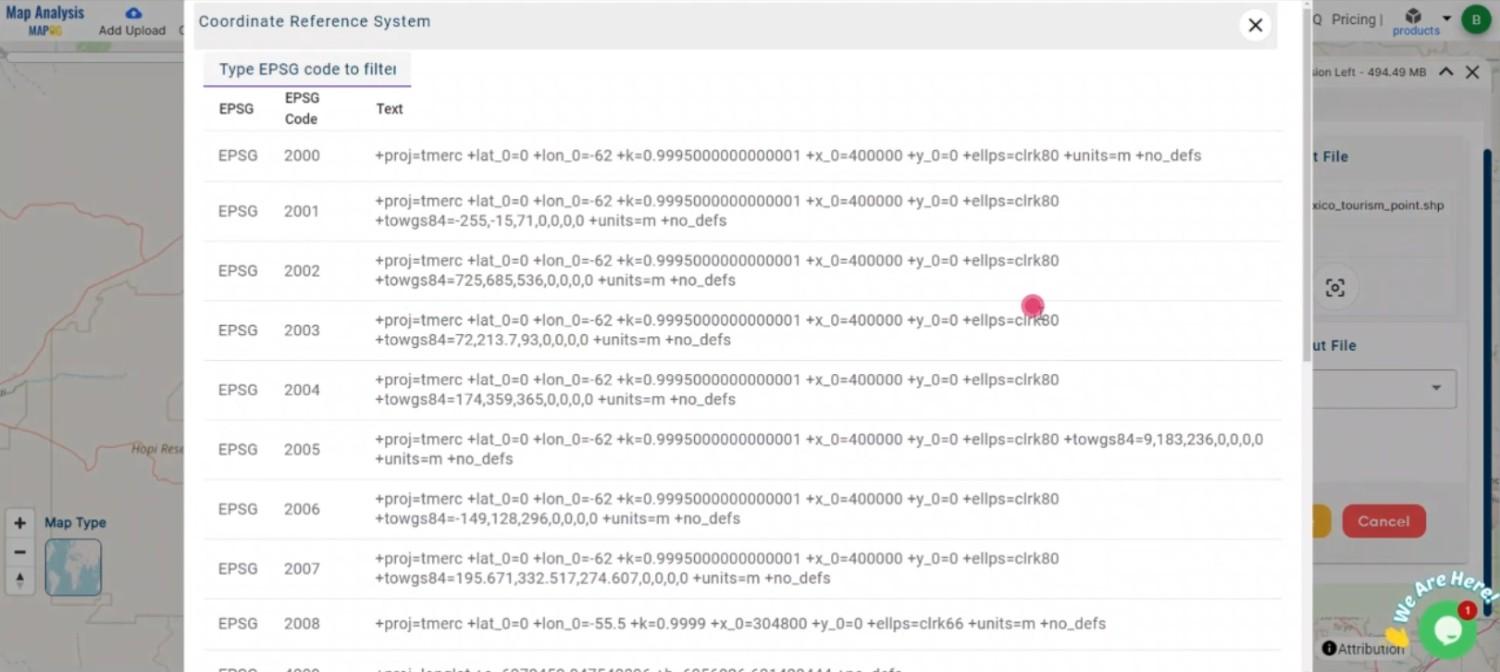
Step 3: Choose the Output Coordinate Reference System (CRS) If your data includes spatial information, select the appropriate CRS to ensure accurate geographic positioning in your MID file.
Choose the Output CRS
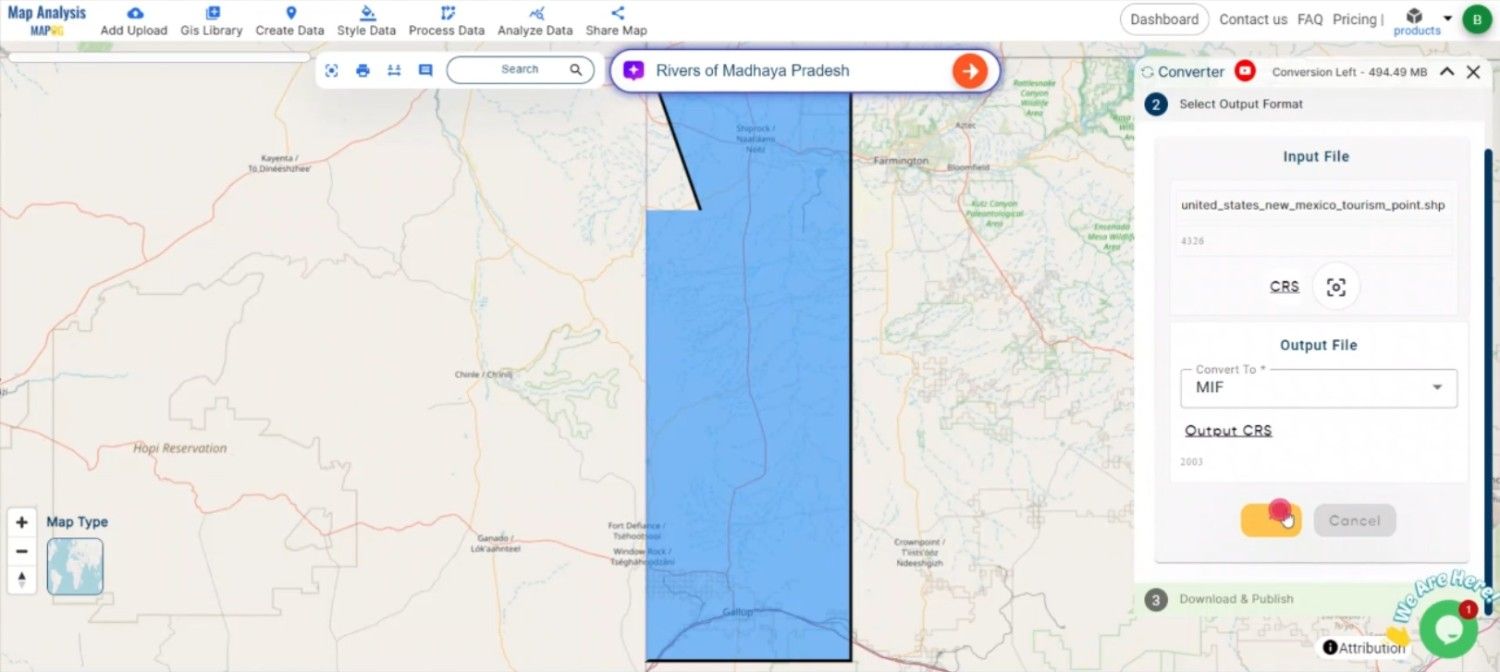
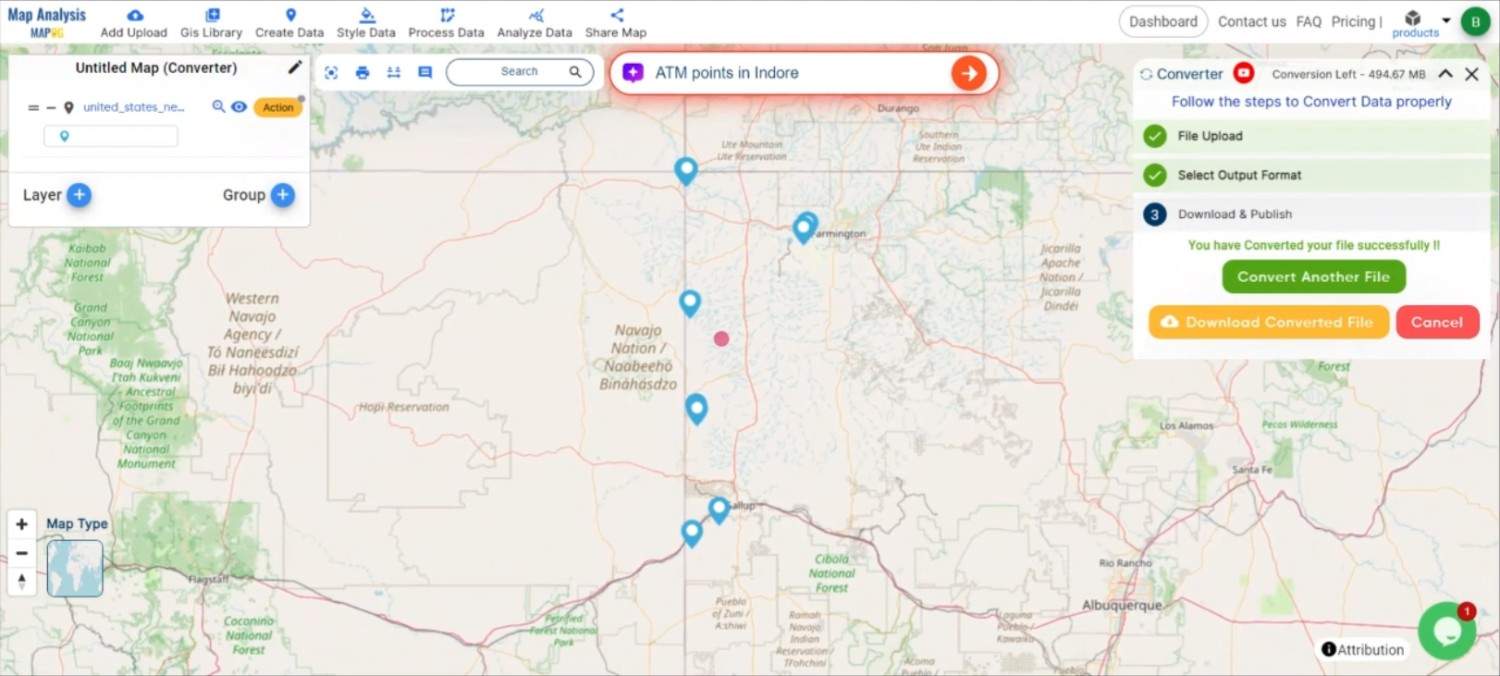
Step 4: Execute the Conversion Once you’ve selected the MID format and set the CRS, initiate the conversion process. The MAPOG tool will accurately convert your SHP file into MID format, ensuring that both geographic and attribute data are preserved.
Execute the Conversion
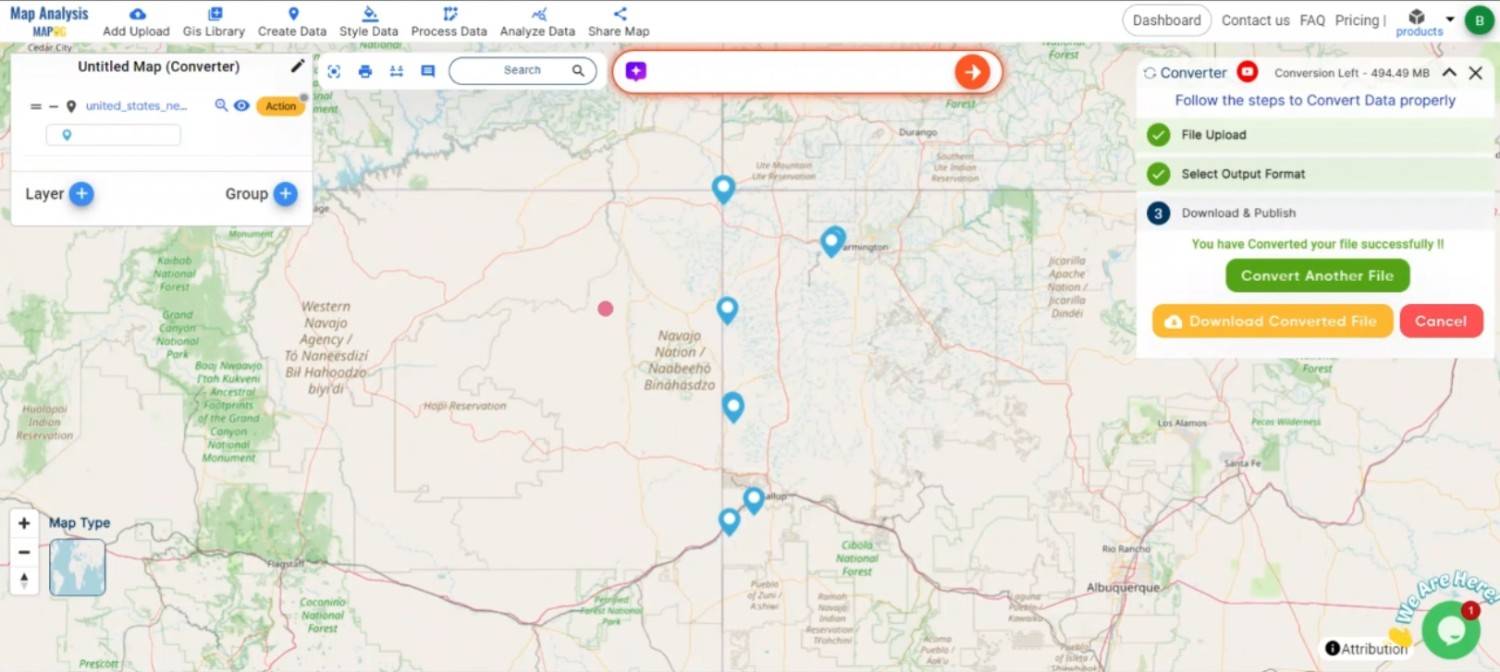
Step 5: Review and Download After the conversion is complete, review the output to confirm the data was correctly converted. Finally, download the MID file, which is now ready to be used within MapInfo GIS applications.
Review the Data
Conclusion:
The MAPOG Converter Tool simplifies the process of converting GIS data between different formats, making it an essential resource for GIS professionals. By following these steps, you can easily convert SHP files to MID format, ensuring your spatial and attribute data are well-prepared for use in MapInfo systems. If you need to download any data file in SHP or in any other formats like GML, TOPOJSON. Visit GIS DATA, here we have 900+ data layers for 200+ countries.
For those who wish to create lively and attractive maps that graphically involve Story by MAPOG is ideal. By utilizing maps with multimedia elements like text and photographs, it helps you to create amazing tales. Making shared material is simple with Story by MAPOG, whether you’re taking a tour, presenting research, or promoting a project.
Here are some other blogs you might be interested in:
An essential step in the GIS process is file conversion, which makes it possible to use geospatial data on multiple systems with ease. A popular GIS format for displaying geographic elements including points, lines, and polygons is called Shapefile (SHP).
What is SHP File?
In GIS, a popular geographic vector data format is a SHP file (Shapefile). For spatial characteristics, it saves the attribute data—descriptive information—and geometry—points, lines, and polygons. SHP files are compatible with applications such as ArcGIS and QGIS, and are frequently used for mapping locations, boundaries, and other geographic data. In order to store associated data, they frequently come with extra files.
MAPOG MapAnalysis‘s Converter Tool offers an easy-to-use platform for converting GIS data between different formats. Its intuitive interface ensures that users can efficiently carry out the conversion process. Here’s a step-by-step guide to converting SHP files to DXF format using MAPOG.
Step-by-Step Guide to Converting SHP to DXF
Step 1: Upload the Data Begin by navigating to the “Process Data” section in MAPOG Map Analysis. Select the “Converter Tool” option. Before uploading your SHP file, ensure that it is organized and ready for conversion.
Upload the Data
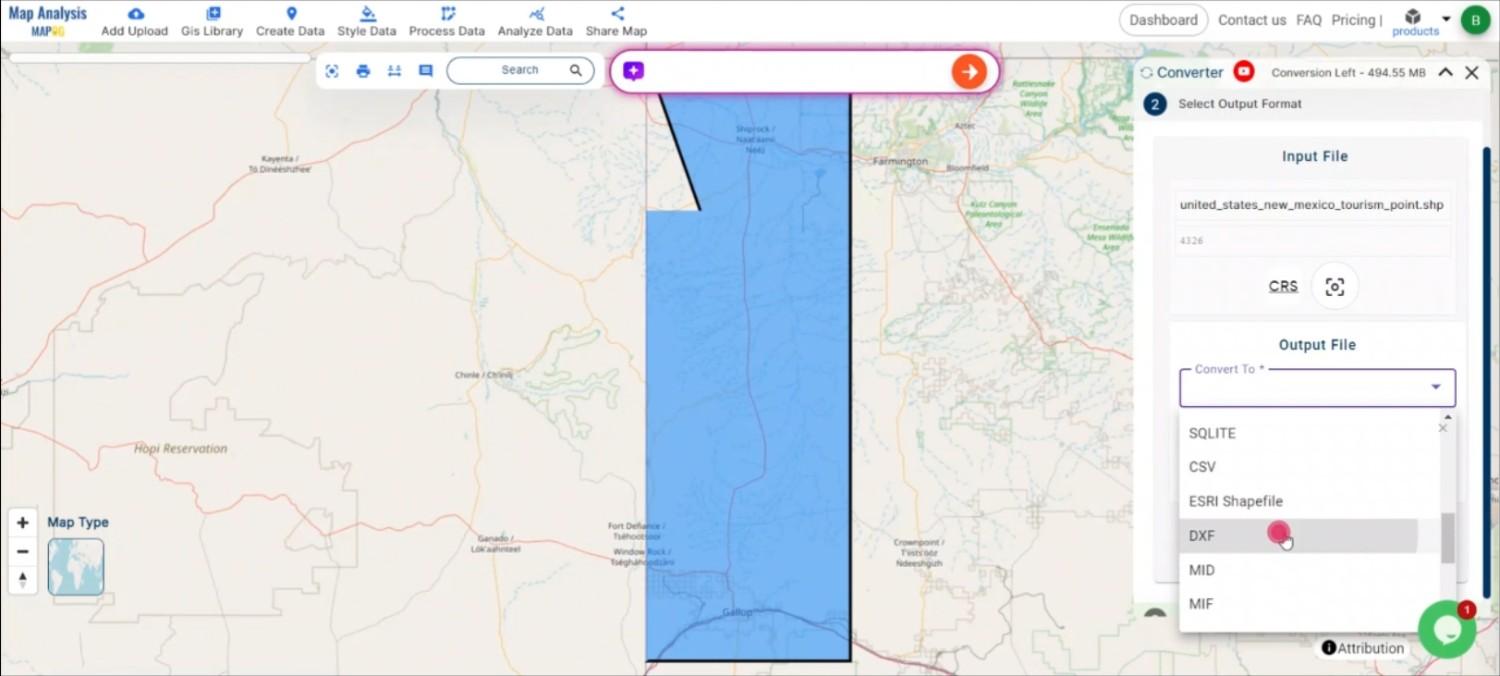
Step 2: Select the Format for Conversion Next, choose DXF as the output format. DXF is ideal for importing GIS data into CAD applications, making it a preferred format for engineers, architects, and designers.
Select the Format
Step 3: Choose the Output Coordinate Reference System (CRS) Select the appropriate CRS to maintain the spatial accuracy of your data in the DXF file. This step is crucial to ensure that the geographic features are correctly positioned in GIS Projects.
Choose the Output CRS
Step 4: Execute the Conversion Once you’ve selected the DXF format and chosen the appropriate CRS, initiate the conversion process. The MAPOG tool will accurately convert your SHP file into the DXF format.
Execute the Conversion
Step 5: Review and Download After the conversion is complete, review the output to confirm that the data was correctly converted. Finally, download the DXF file, which is now ready to be integrated into your GIS projects for further analysis.
Review the Data
Conclusion:
The MAPOG Converter Tool simplifies the process of converting GIS data between different formats, making it an essential resource for professionals working at the intersection of GIS. By following these steps, you can easily convert SHP files to DXF format. If you need to download any data file in SHP or in any other formats like KML, TOPOJSON. Visit GIS DATA, here we have 900+ data layers for 200+ countries.
Story by MAPOG is ideal for users who want to bring their data to life through interactive and visually engaging maps. It allows you to tell powerful stories, blending maps with multimedia elements like images and text. Whether you’re presenting research or guiding a tour.
Here are some other blogs you might be interested in:
For accurate data application and analysis, GIS data must be converted between its many formats, which are usually present. While GML (Geography Markup Language) is an XML-based format used to represent geographical information, CSV is a standard text format used to store. It is possible to include basic data into complex GIS applications by converting CSV to GML.
What is CSV File?
Data is stored in tabular form in a simple text file called a CSV file. Just like in a spreadsheet, data may be easily organized and shared because each line denotes a row and the numbers within each row are separated by commas.
The MAPOG MapAnalysis Converter Tool offers an easy-to-use interface for converting data between different GIS formats, including CSV to GML. Below is a step-by-step guide on how to use this tool for your conversion needs.
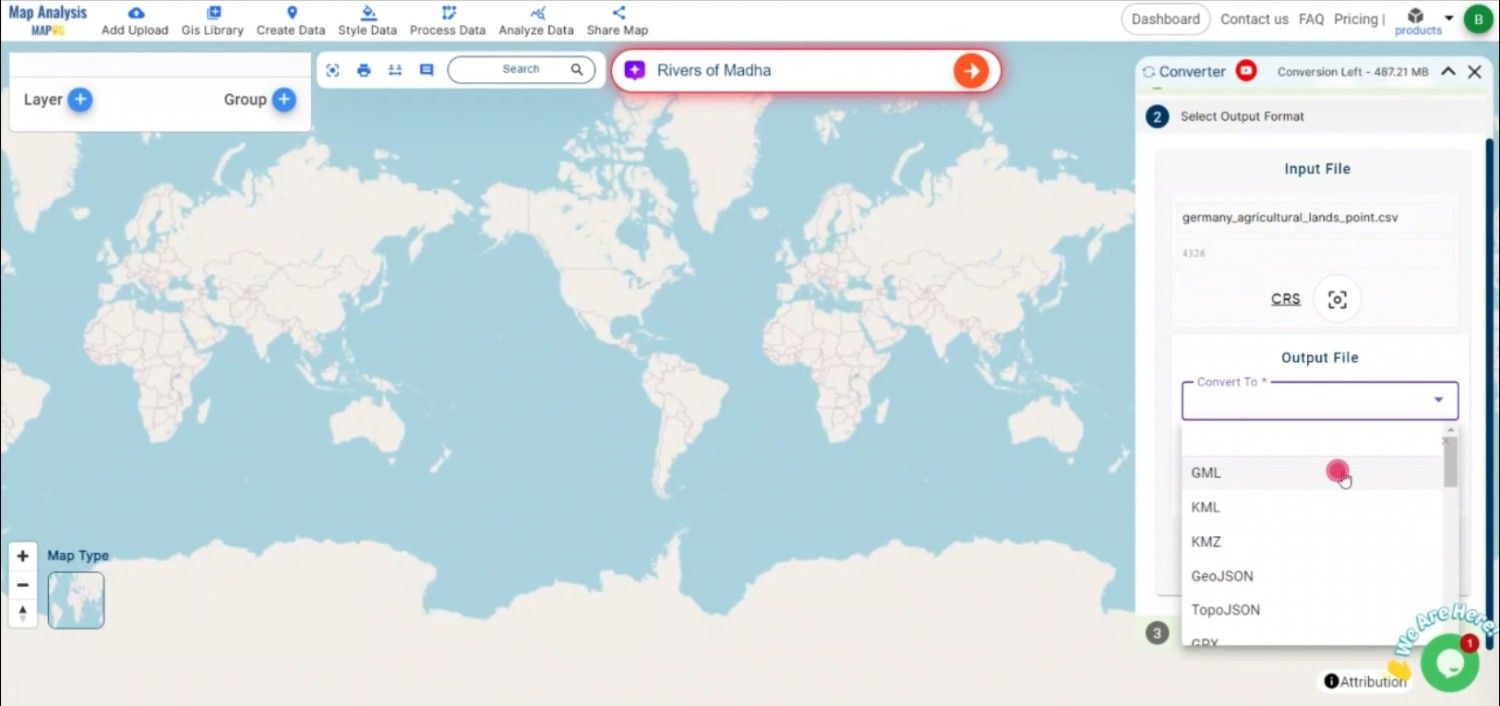
Step-by-Step Guide to Converting CSV to GML
Step 1: Upload Your CSV Data
Begin by navigating to the “Process Data” section within MAPOG MapAnalysis. Select the “Converter Tool” option. Before uploading your CSV file, ensure it is properly formatted with columns representing the necessary attributes and coordinates.
Upload the Data
Step 2: Select GML as the Output Format
Choose GML from the list of available output formats. GML is ideal for encoding and sharing geospatial data across different systems and platforms, preserving the structure and relationships of the geographical features.
Select GML as Format
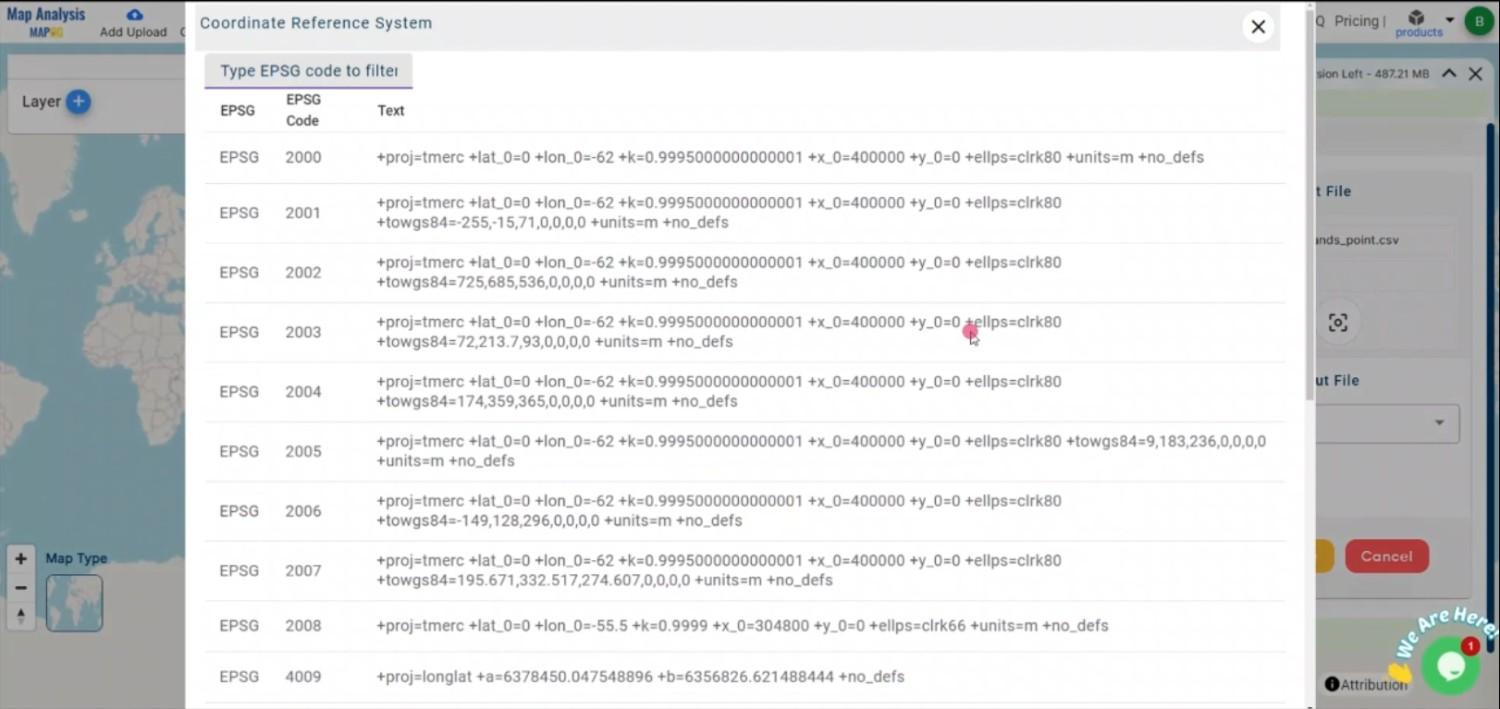
Step 3: Choose the Output CRS
In this step, you choose the appropriate Output CRS. Selecting one can be helpful if your data contains spatial information that needs to be preserved for further geographic analysis.
Choose the Output CRS
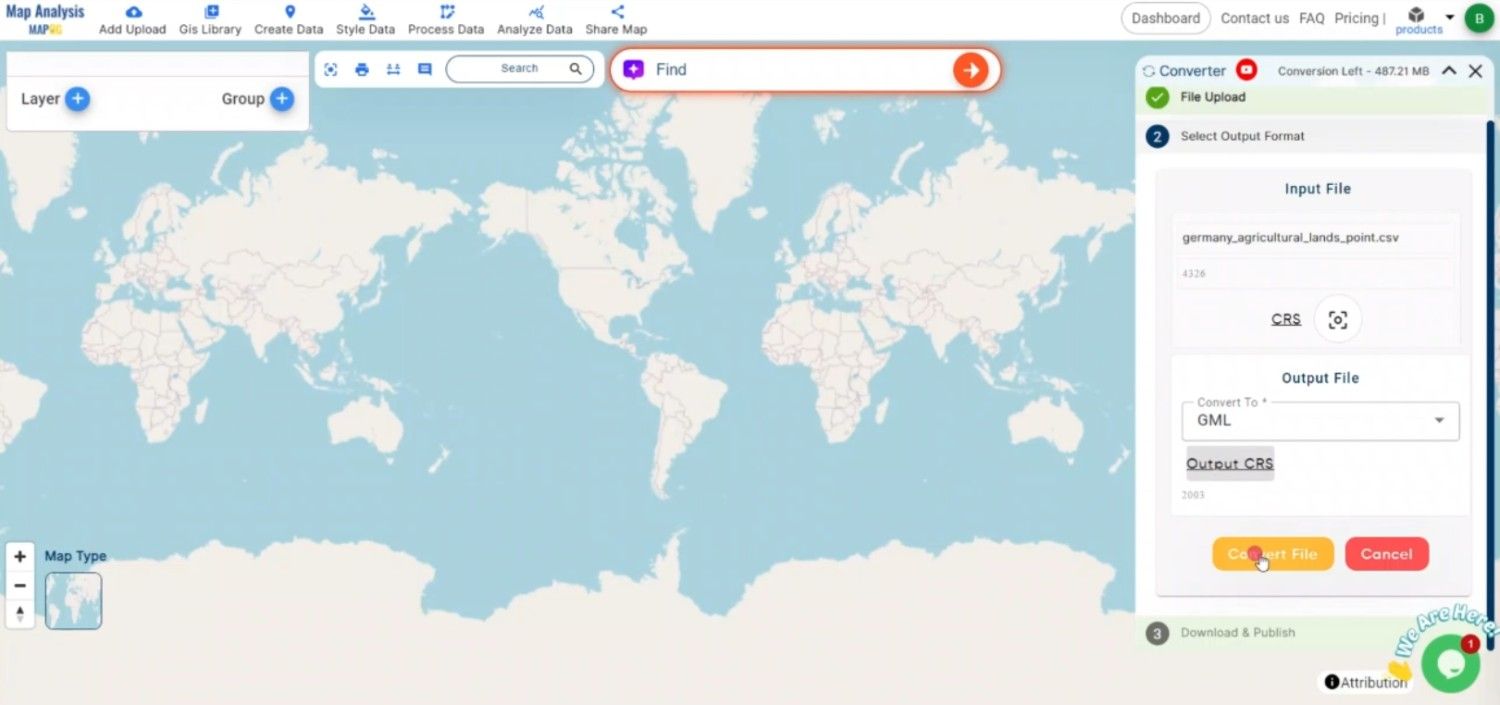
Step 4: Execute the Conversion
After setting the input parameters and choosing GML as the output format, click the “Convert” button. The MAPOG Converter Tool will process the CSV file and generate a GML file that accurately reflects the geographic data.
Execute the Conversion
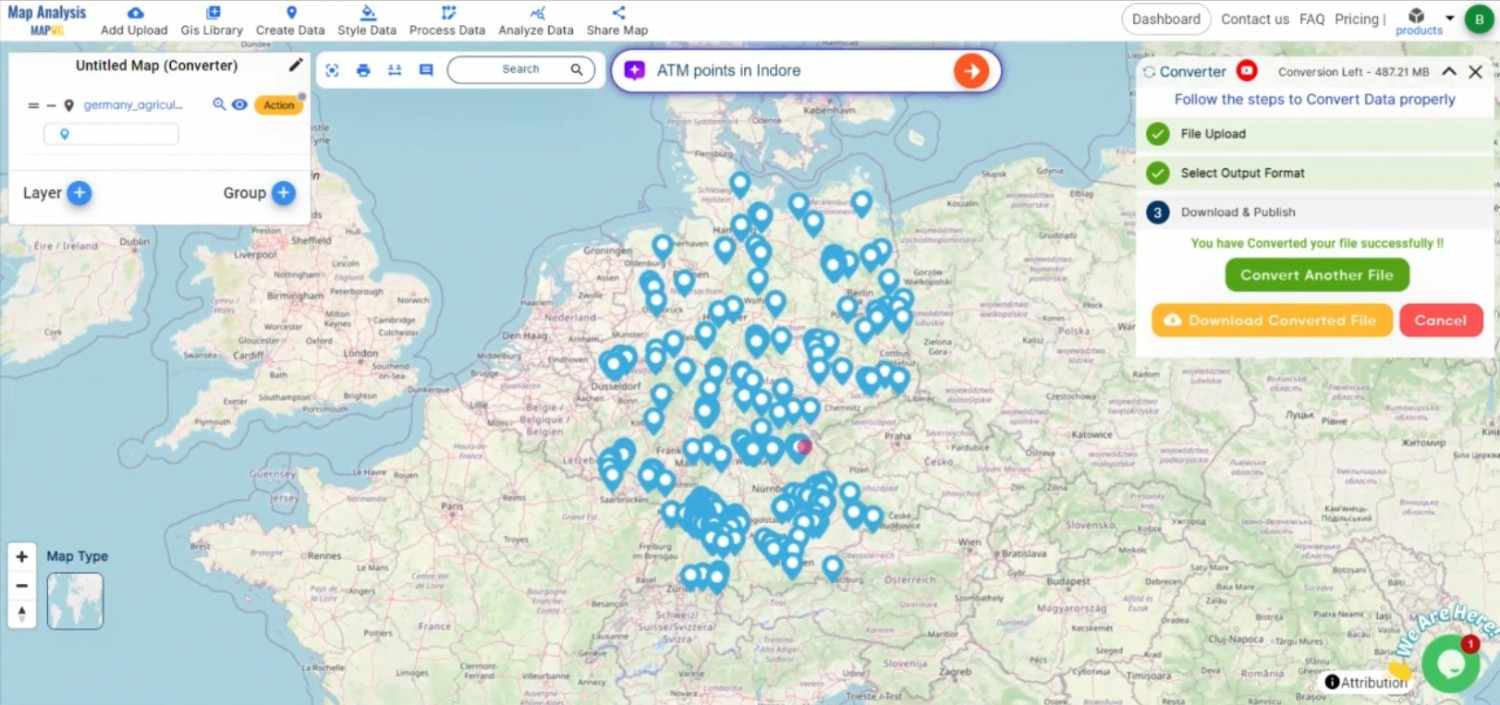
Step 5: Review and Download the GML File
Once the conversion is complete, review the GML file to ensure that the data has been correctly transformed. After confirming the accuracy, download the GML file, which is now ready for use in geospatial applications or further processing.
Review the Data
Conclusion:
The MAPOG Converter Tool is a valuable resource for GIS professionals and data analysts, simplifying the conversion of data between various geospatial formats. By following these steps, you can efficiently convert CSV files to GML format, enabling seamless integration of tabular data into geospatial systems.
Story by MAPOG is an engaging tool that brings geographical data to life through interactive maps and narratives. Imagine combining detailed maps with photos, videos, and text to tell captivating stories about places, events, or trends. It’s perfect for educators, travel enthusiasts, or anyone who wants to make their data-driven stories interactive and visually compelling.
Here are some other blogs you might be interested in:
In Geographic Information Systems (GIS), converting data from one format to another is crucial for ensuring that geospatial data is compatible across different platforms. Converting CSV to KML allows you to visualize and share your data in a geospatial context.
What is CSV File?
A CSV file (Comma-Separated Values) is a simple text file that stores data in a table format. Each line represents a row, and the values in each row are separated by commas, making it easy to organize and share information like a spreadsheet.
The MAPOG MapAnalysis Converter Tool is designed to make data conversion between various formats seamless and user-friendly. Below is a guide on how to convert CSV files to KML format using MAPOG.
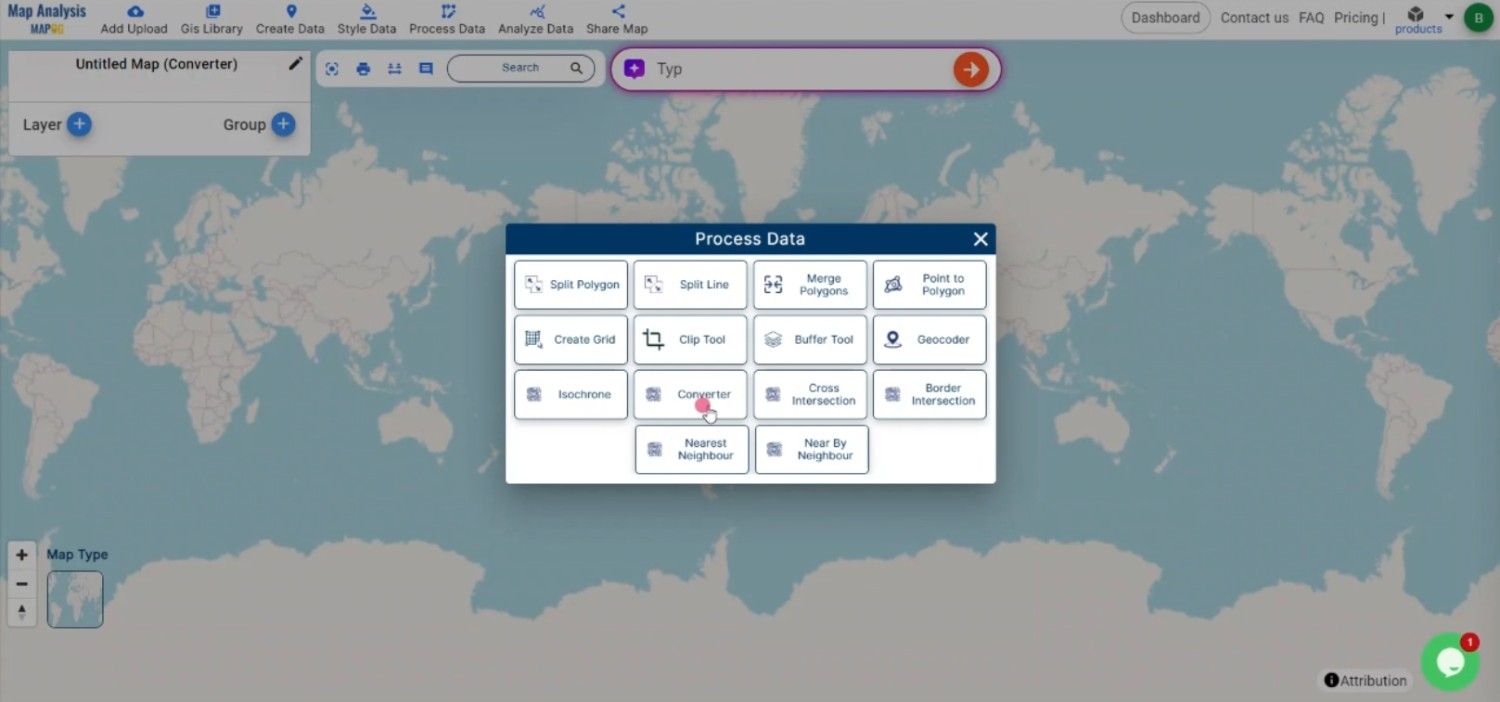
Step-by-Step Guide to Converting CSV to KML
Step 1: Upload Your CSV Data
First, go to the “Process Data” section in MAPOG MapAnalysis and select the “Converter Tool” option. Make sure your CSV file is properly organized, with columns representing the necessary attributes such as coordinates (latitude and longitude) and any additional data fields.
Upload the Data
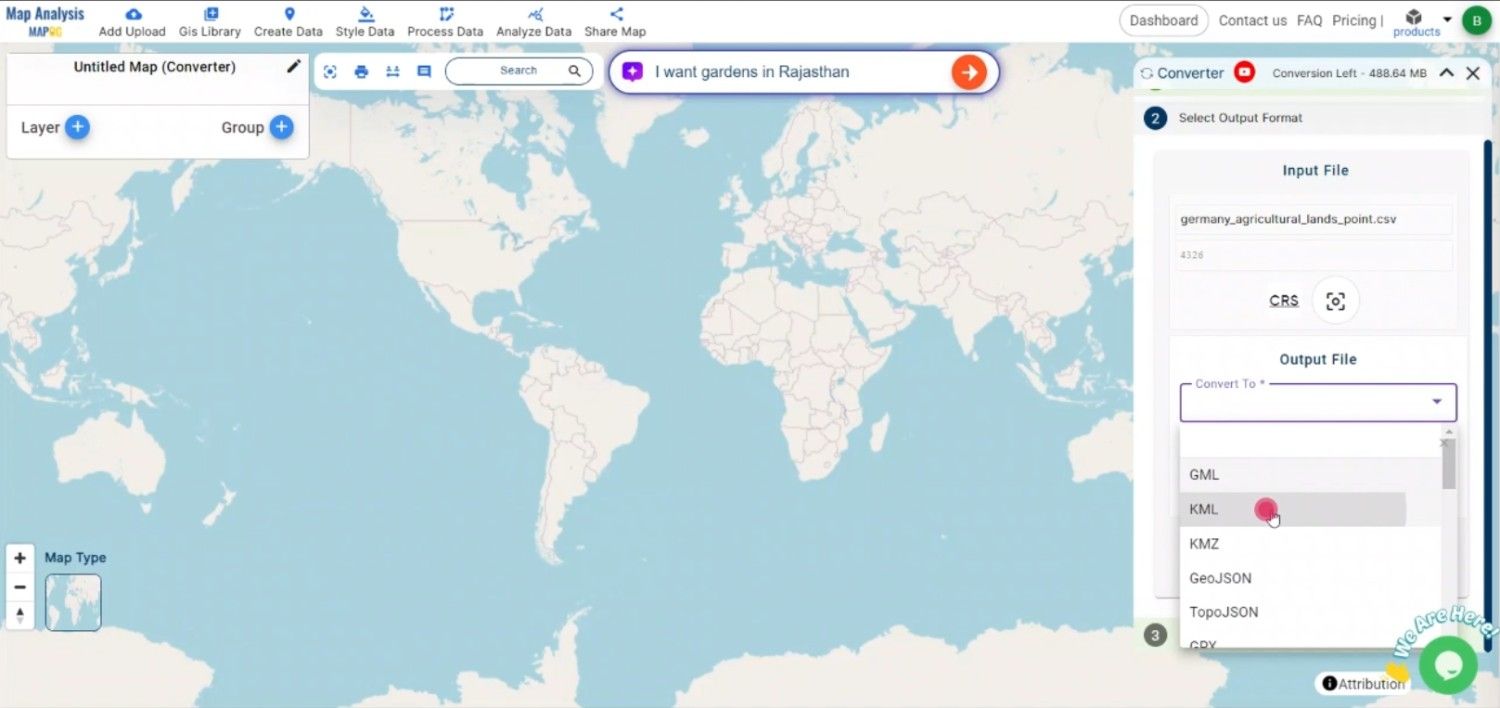
Step 2: Choose KML as the Output Format
From the list of available formats, select KML as the output. KML is ideal for visualizing geographic data on platforms like Google Earth, where it can be easily shared and viewed.
Choose the KML Format
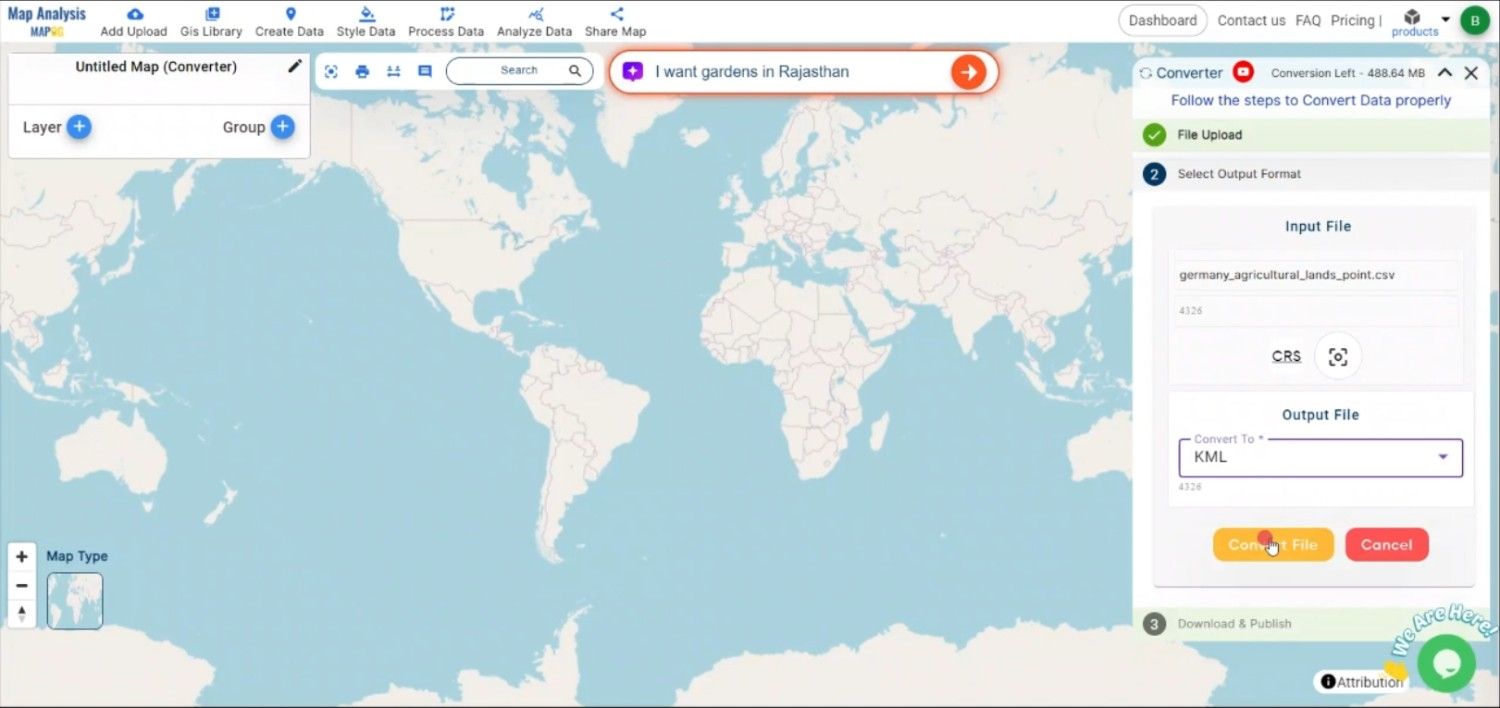
Step 3: Execute the Conversion
Once you’ve configured the necessary settings, initiate the conversion by clicking the “Convert” button. The MAPOG tool will process the CSV file and generate a KML file that includes all the geographic data mapped accurately.
Execute the Conversion
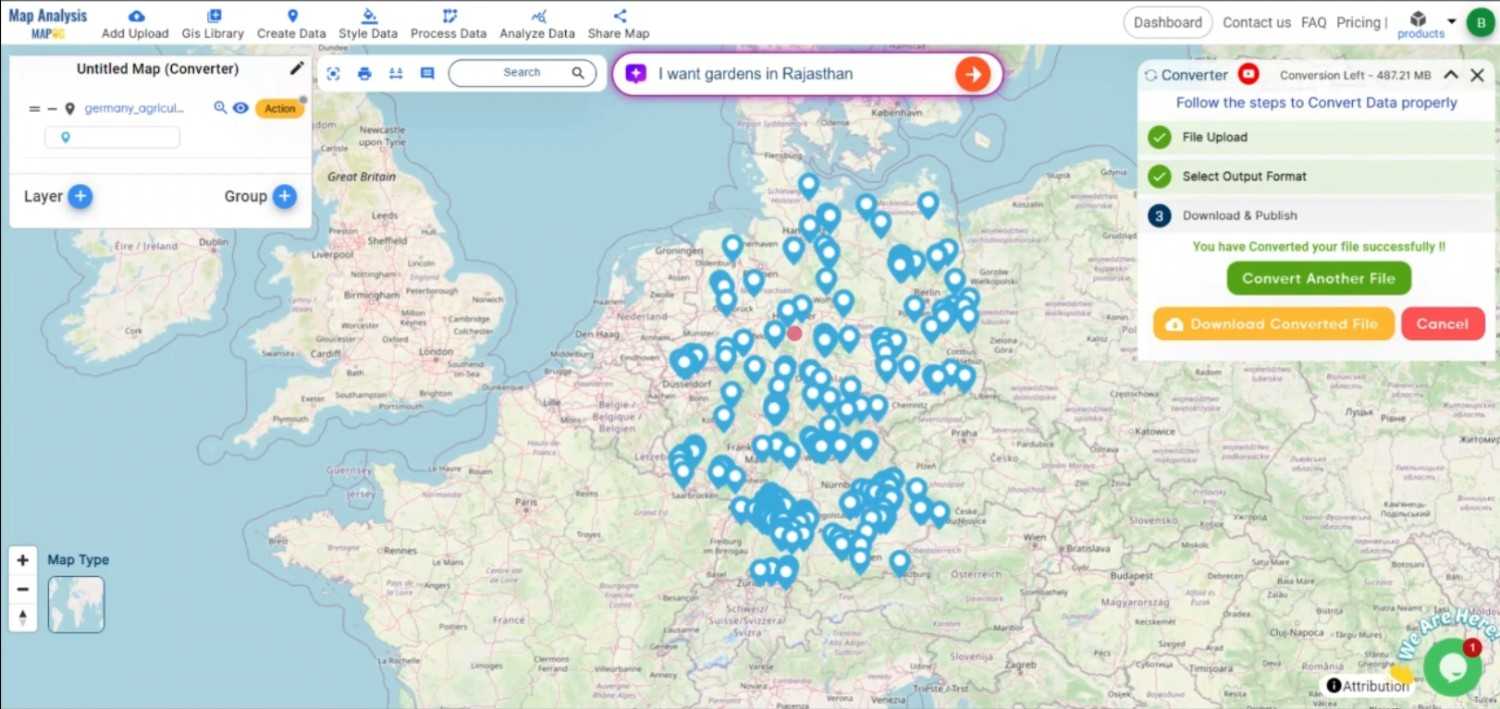
Step 4: Review and Download the KML File
After the conversion is complete, review the KML file to ensure all data has been correctly transformed. Once satisfied, download the KML file. It is now ready to be used in Google Earth, Google Maps, or any other platform that supports KML.
Review the Data
Conclusion:
The MAPOG Converter Tool is an essential resource for GIS professionals and enthusiasts, simplifying the process of converting data into various geospatial formats. By following these steps, you can efficiently convert CSV files to KML format, making your data ready for visualization and sharing on popular mapping platforms. If you need to download any data file in CSV or in any other formats like KML, SHP. visit GIS DATA. Here we have 900+ data layers for 200+ countries.
Story by MAPOG is an engaging tool that brings geographical data to life through interactive maps and narratives. Imagine combining detailed maps with photos, videos, and text to tell captivating stories about places, events, or trends. Whether you’re showcasing beautiful landscapes, tracking environmental changes, or exploring cultural sites, Story by MAPOG makes it easy to guide viewers through a visual journey. It’s perfect for educators, travel enthusiasts, or anyone who wants to make their data-driven stories interactive and visually compelling.
Here are some other blogs you might be interested in:
We use cookies to ensure that we give you the best experience on our website. If you continue to use this site we will assume that you are happy with it.Ok