File conversion is an essential step in the GIS process that guarantees the easy use of geographic data in various applications. Database-driven geospatial applications benefit from improved data organization and performance with the conversion of SHP to SQLITE.
What is SHP File?
In GIS, a popular geographic vector data format is a SHP file (Shapefile). For spatial characteristics, it saves the attribute data—descriptive information—and geometry—points, lines, and polygons. SHP files are compatible with applications such as ArcGIS and QGIS, and are frequently used for mapping locations, boundaries, and other geographic data. In order to store associated data, they frequently come with extra files.
Key Concept for Conversion SHP to SQLITE:
MAPOG MapAnalysis‘s Converter Tool provides a user-friendly platform for converting data between various formats. Its intuitive interface ensures users can complete the conversion process with ease. Here’s a step-by-step guide on converting SHP files to SQLITE format using MAPOG.
Step-by-Step Guide to Converting SHP to SQLITE
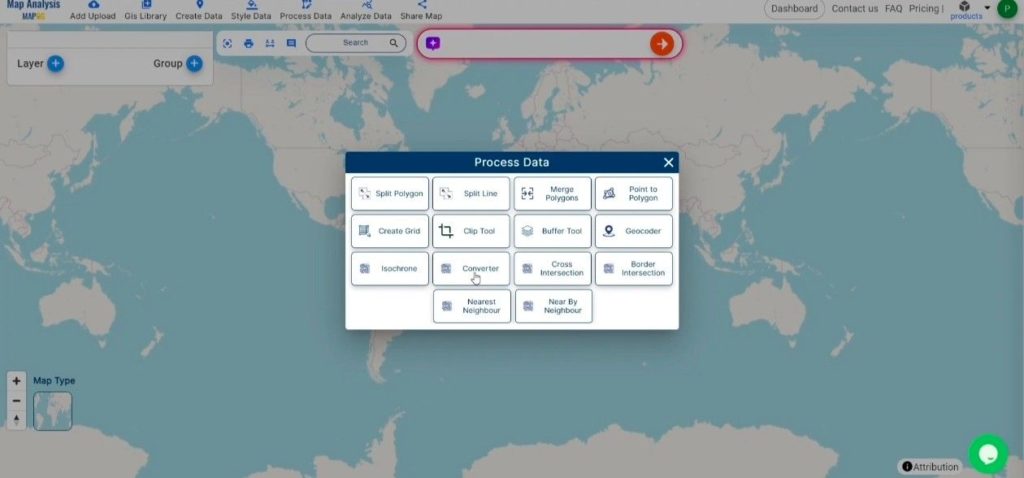
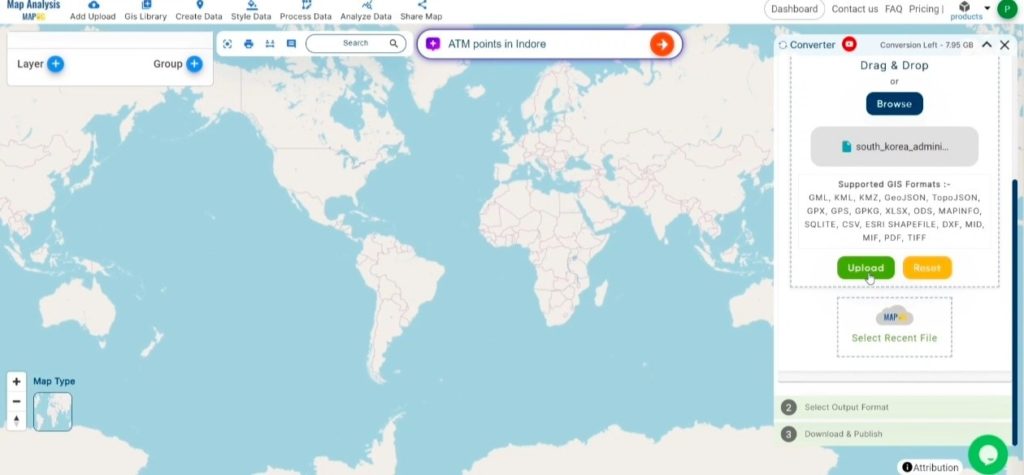
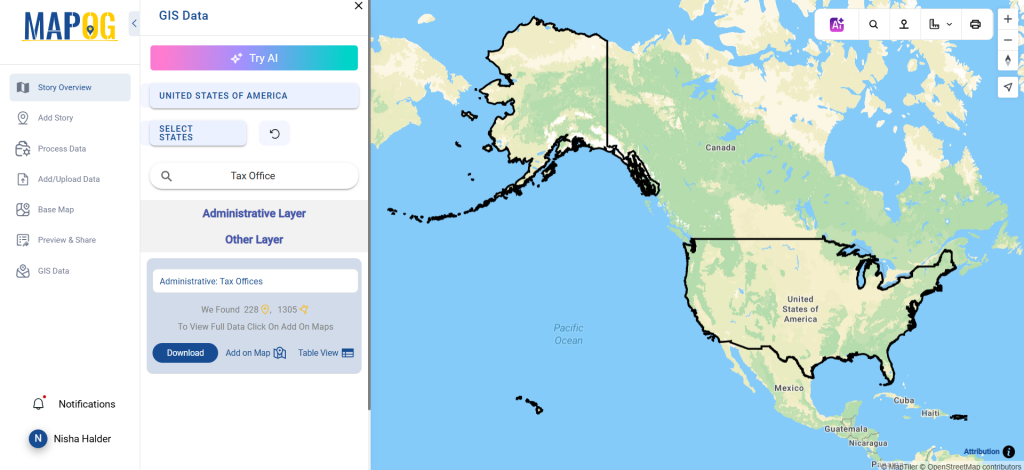
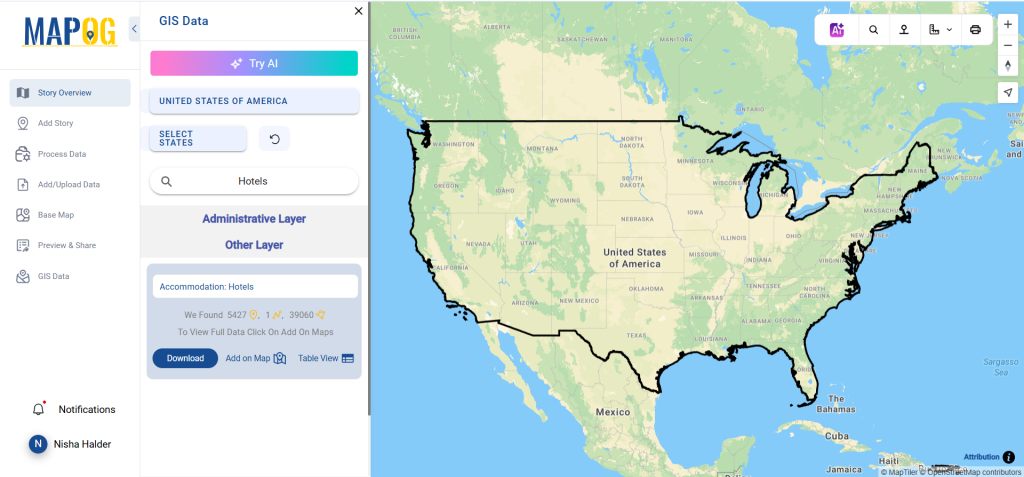
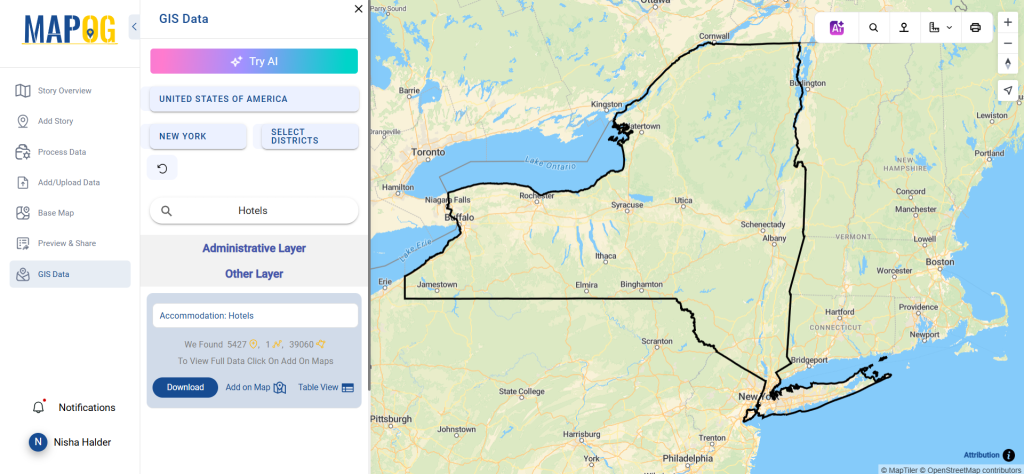
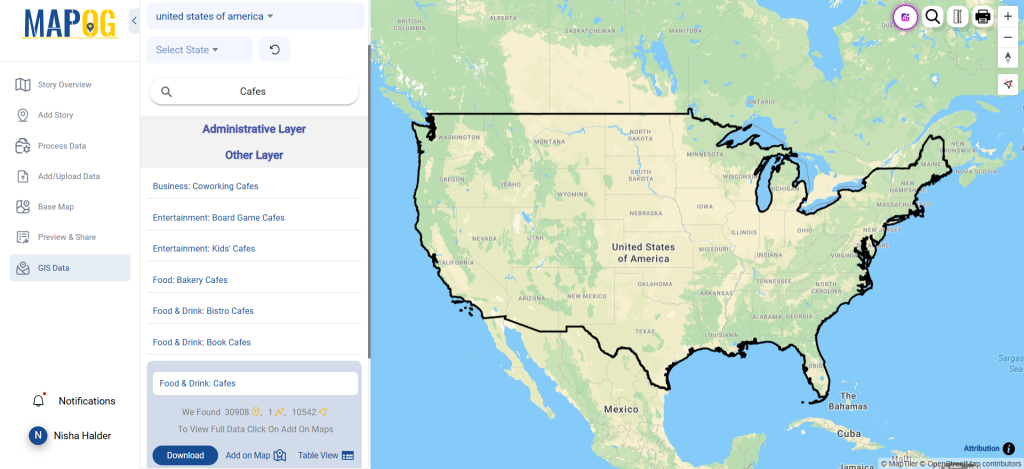
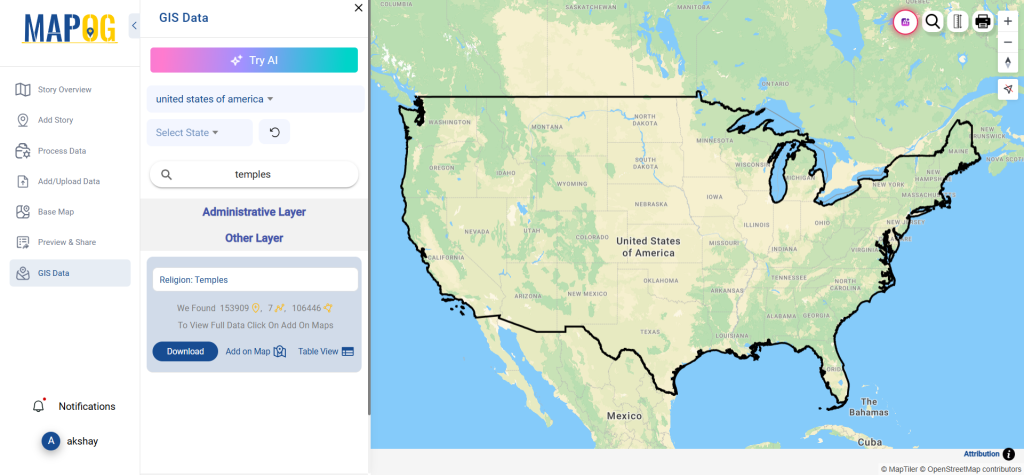
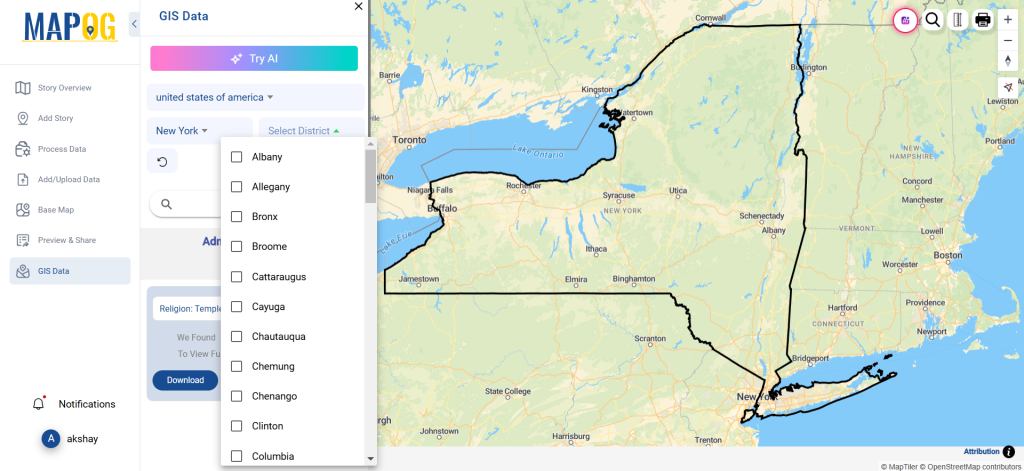
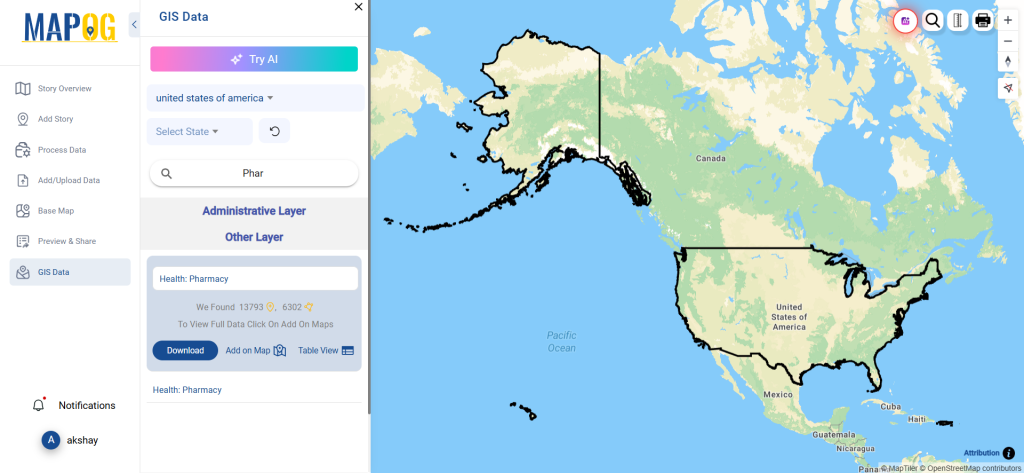
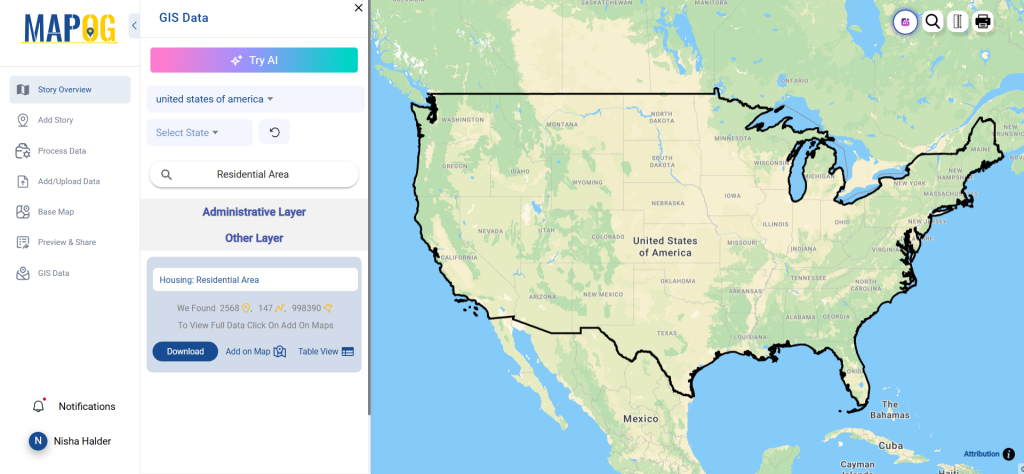
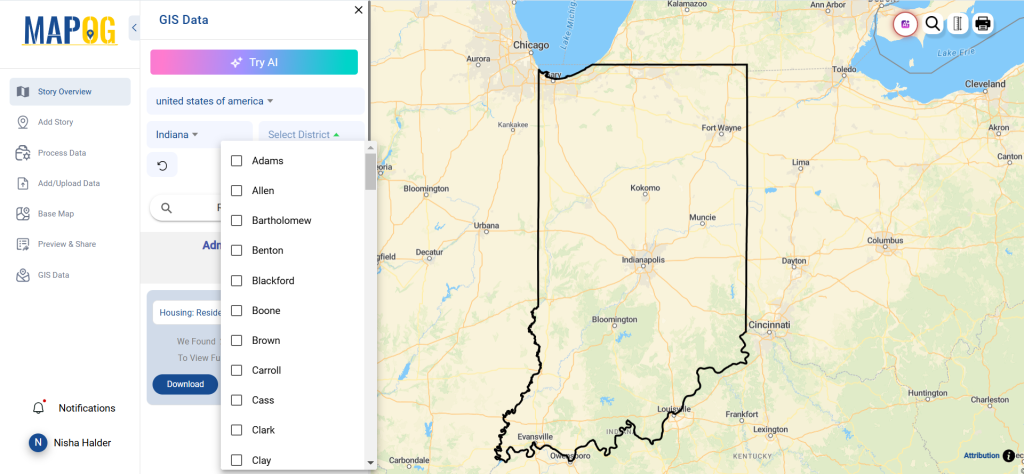
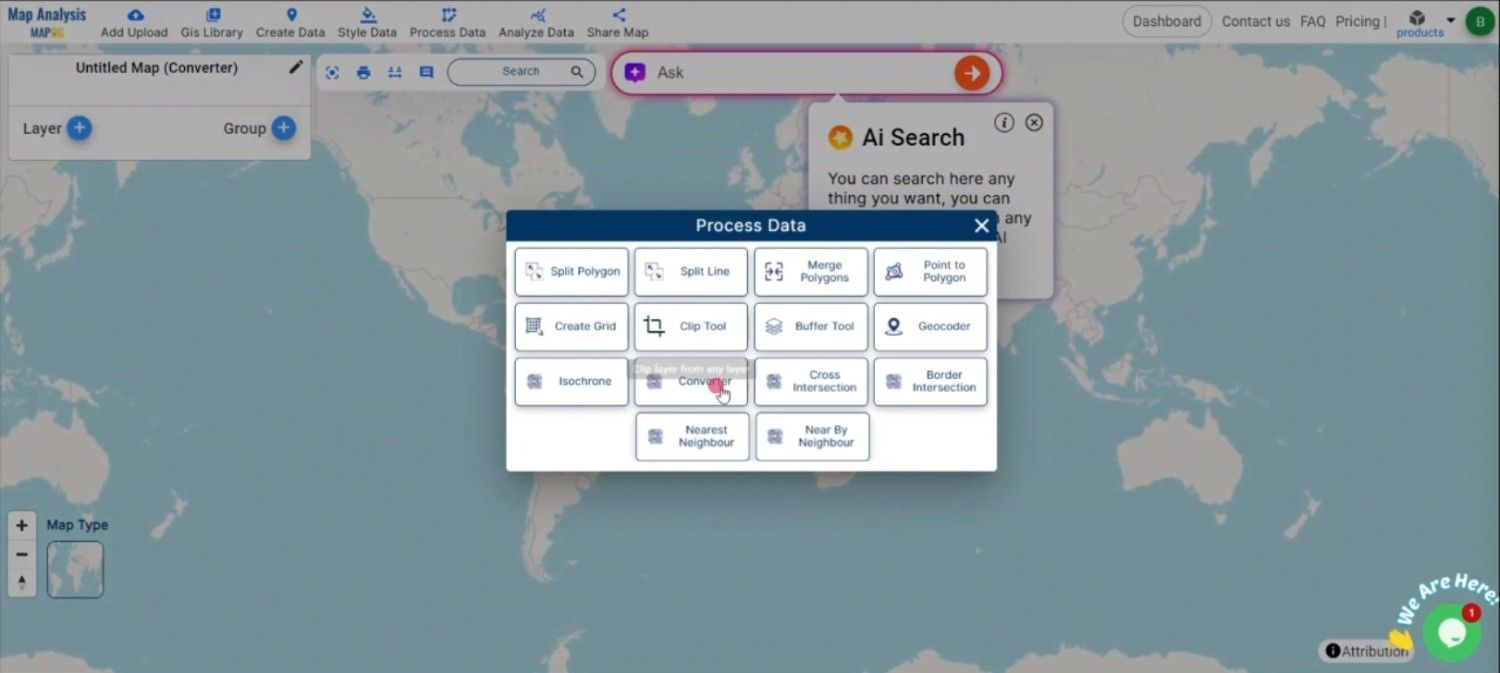
Step 1: Upload the Data
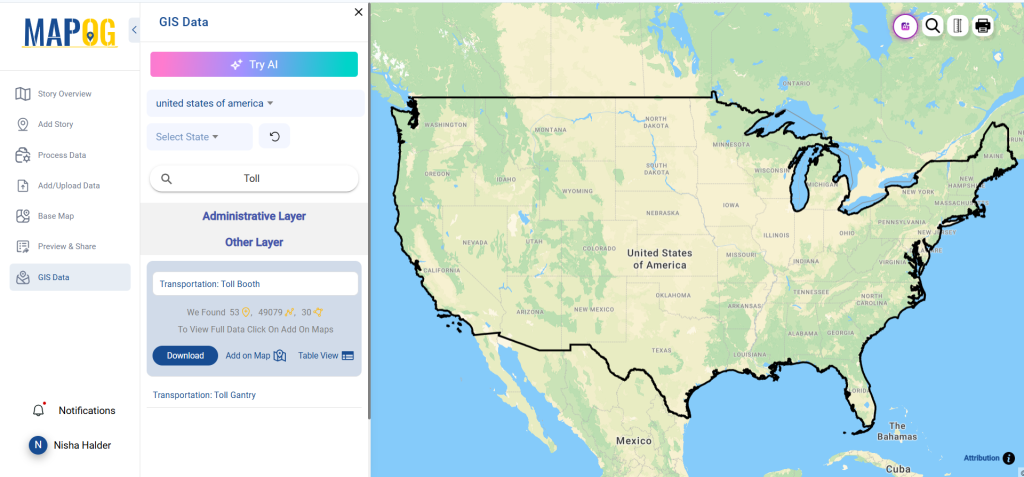
Begin by navigating to the “Process Data” section in MAPOG MapAnalysis. Select the “Converter Tool” option. Before uploading your SHP file, ensure that it is organized and ready for conversion.
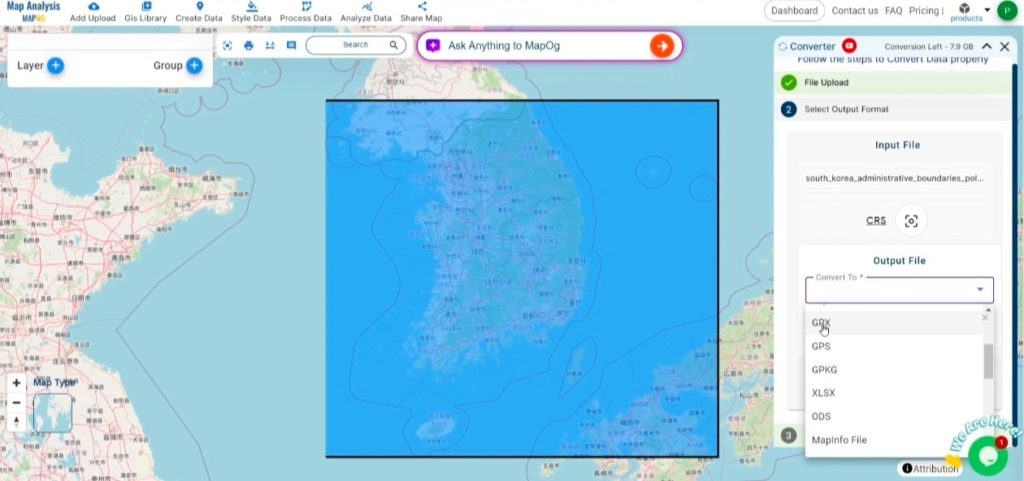
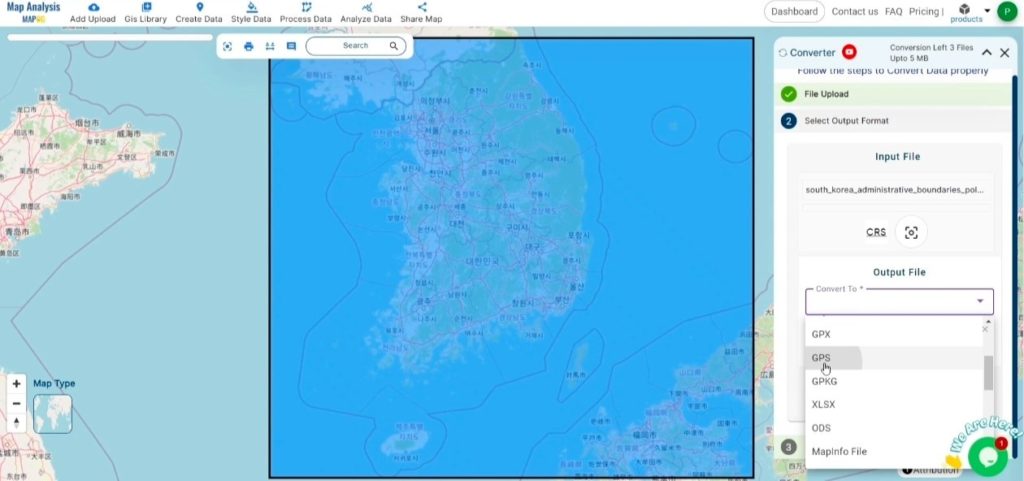
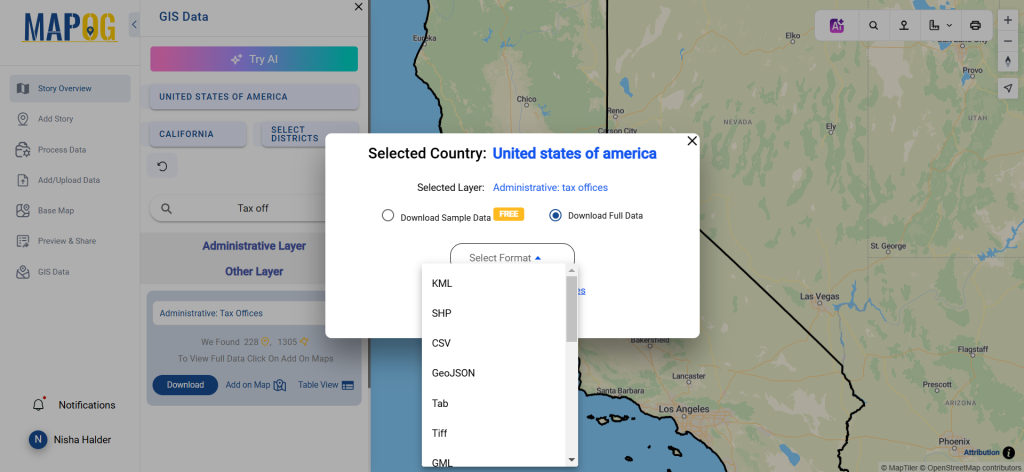
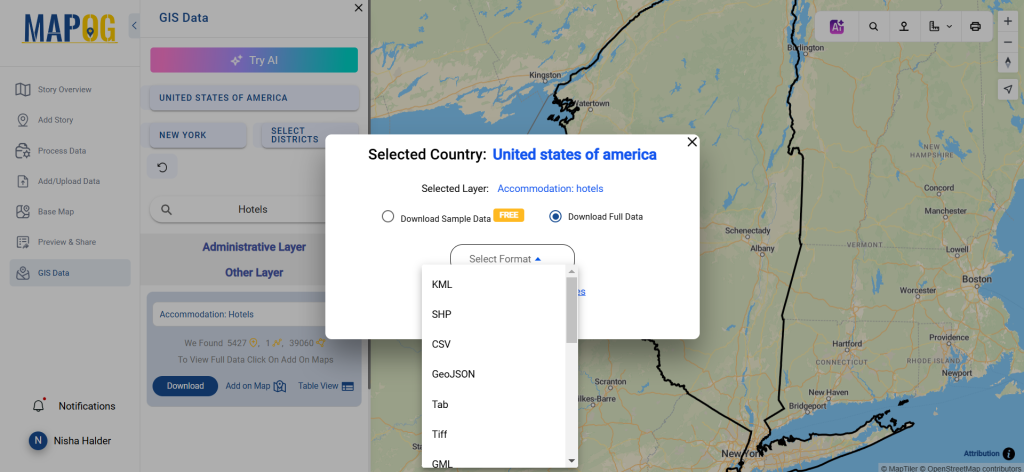
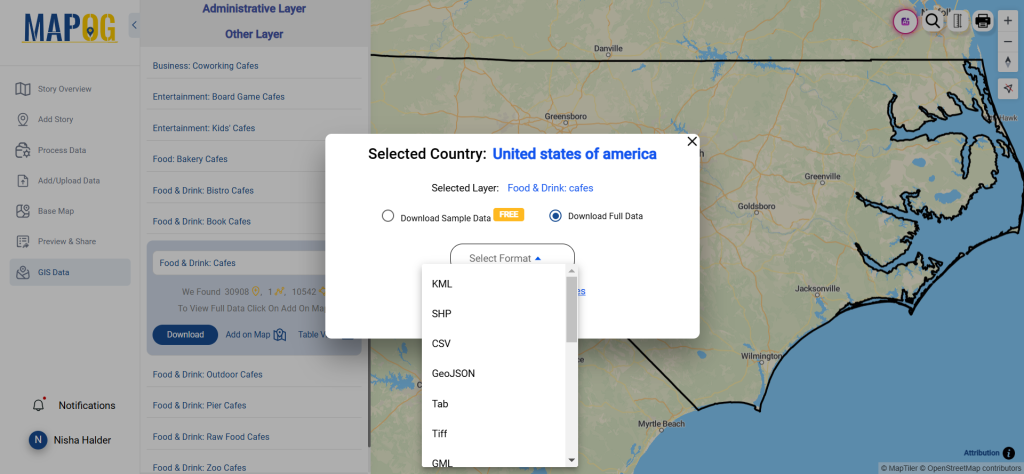
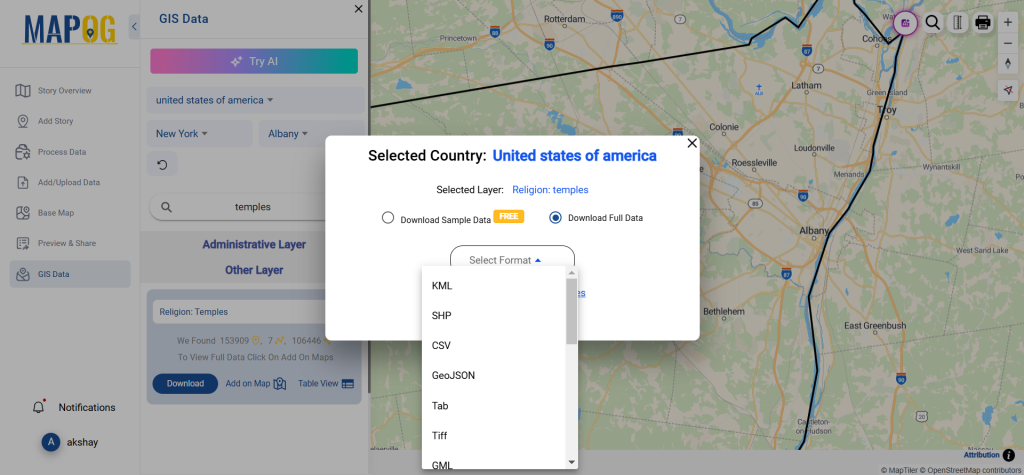
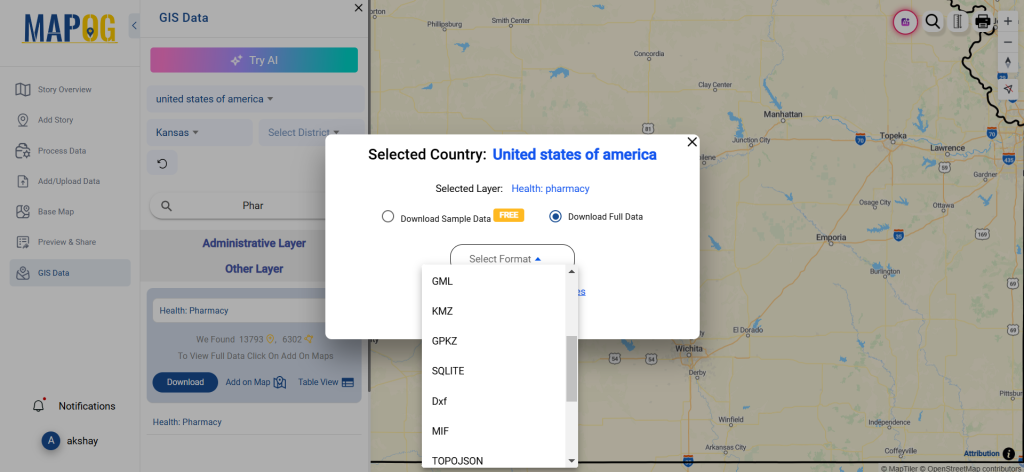
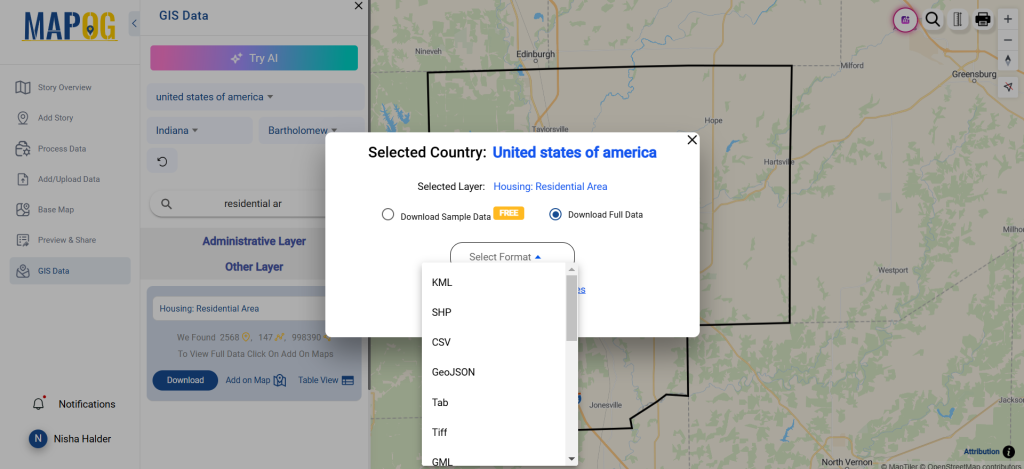
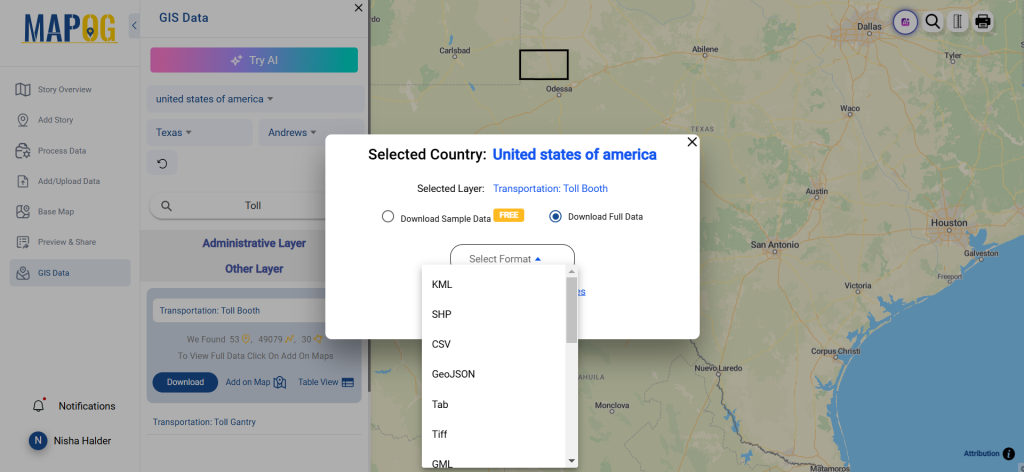
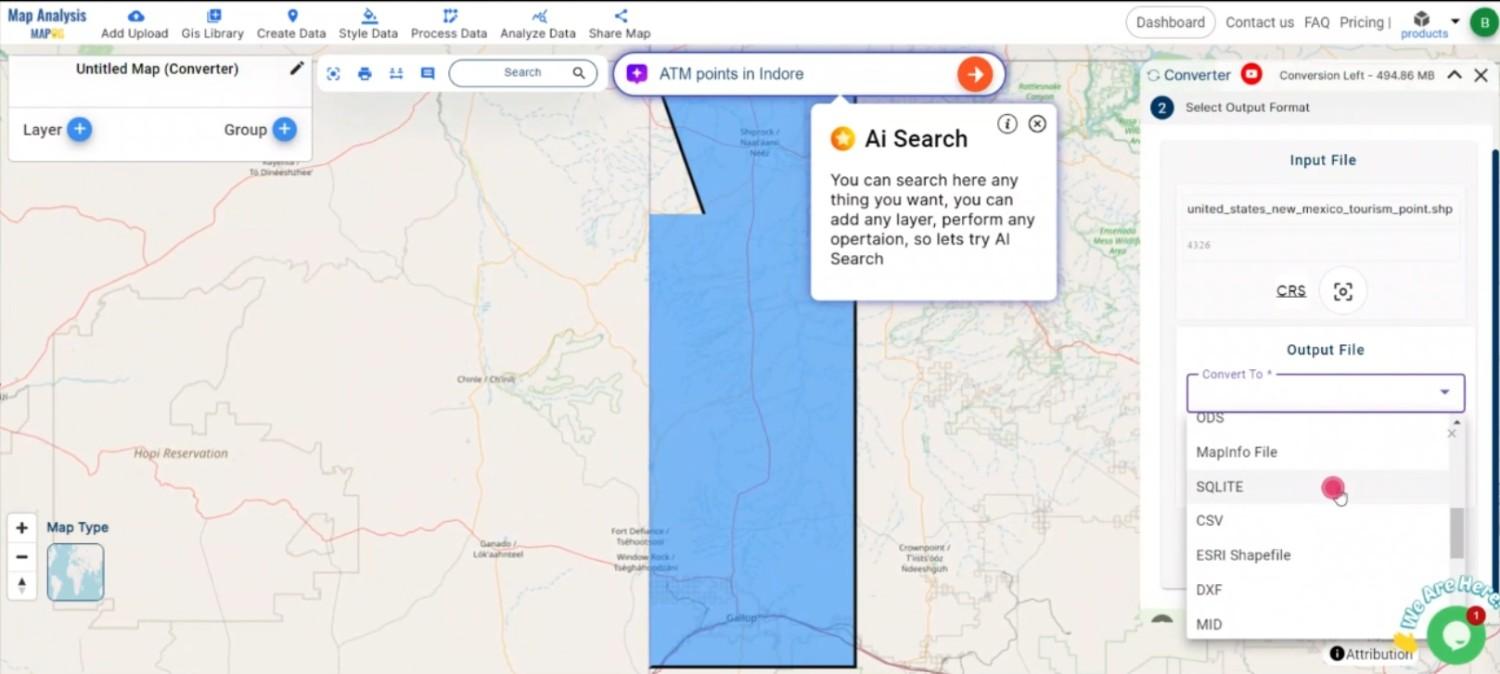
Step 2: Select the Format for Conversion
Next, choose SQLITE as the output format. SQLITE is ideal for managing geospatial databases due to its efficient storage capacity, making it suitable for large-scale GIS applications.
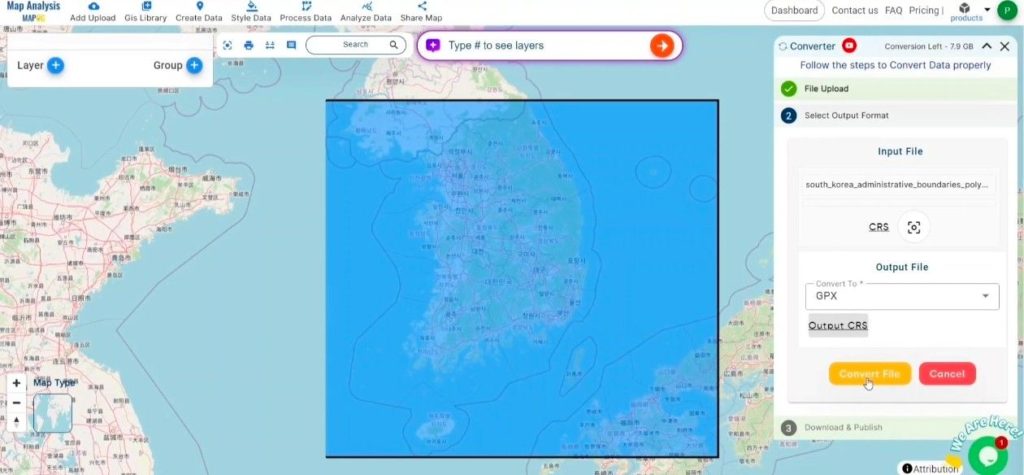
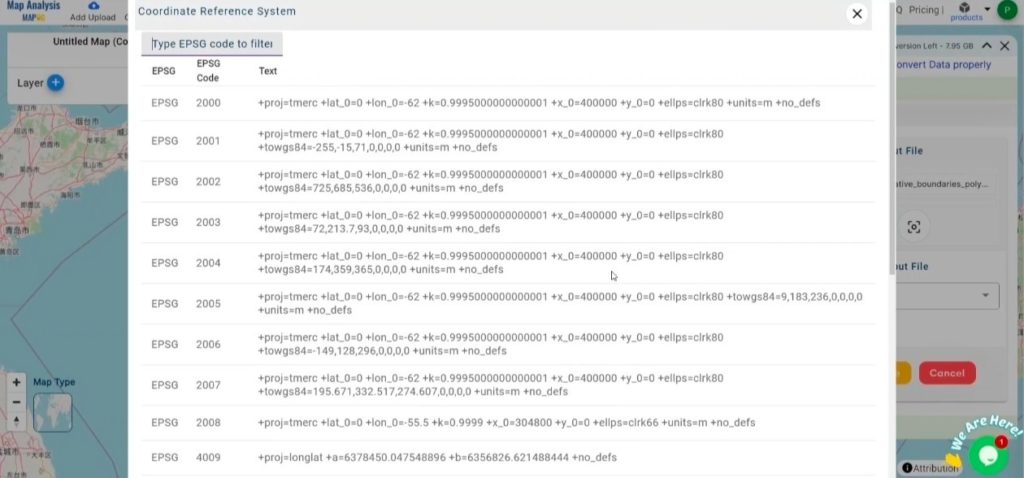
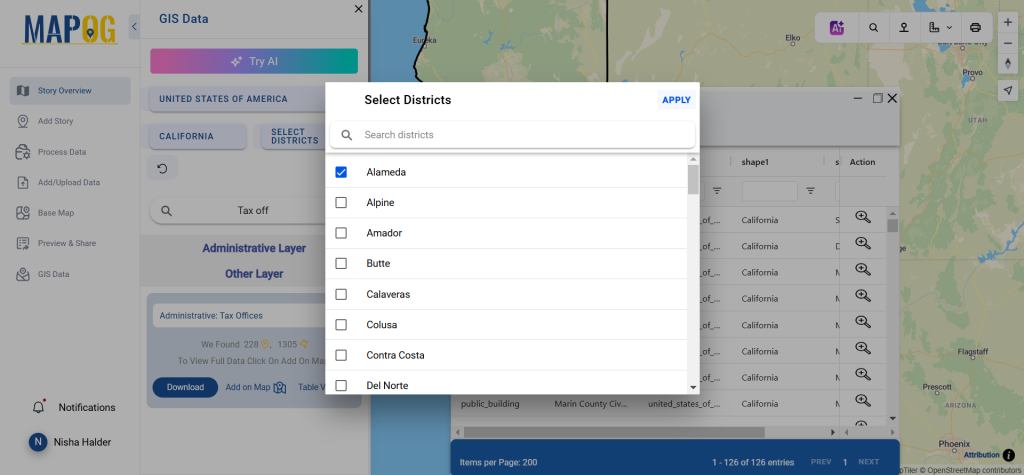
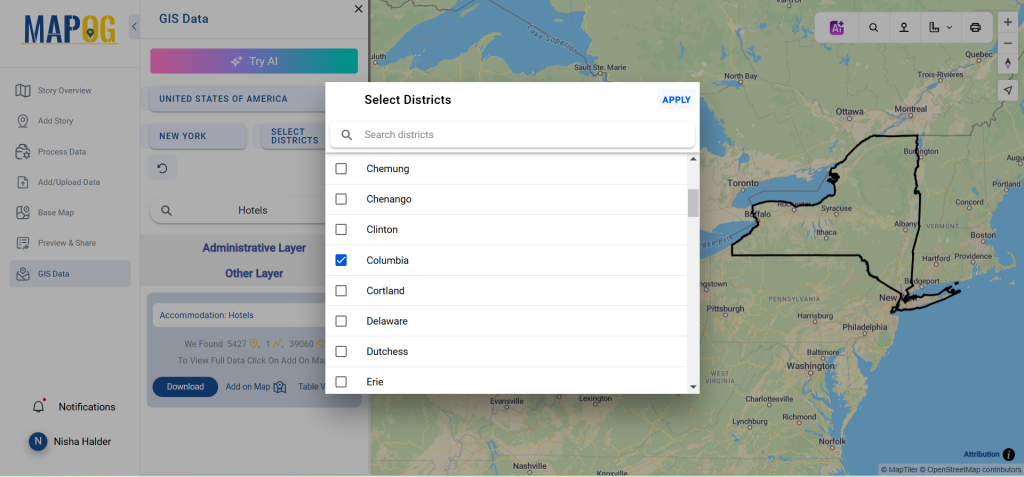
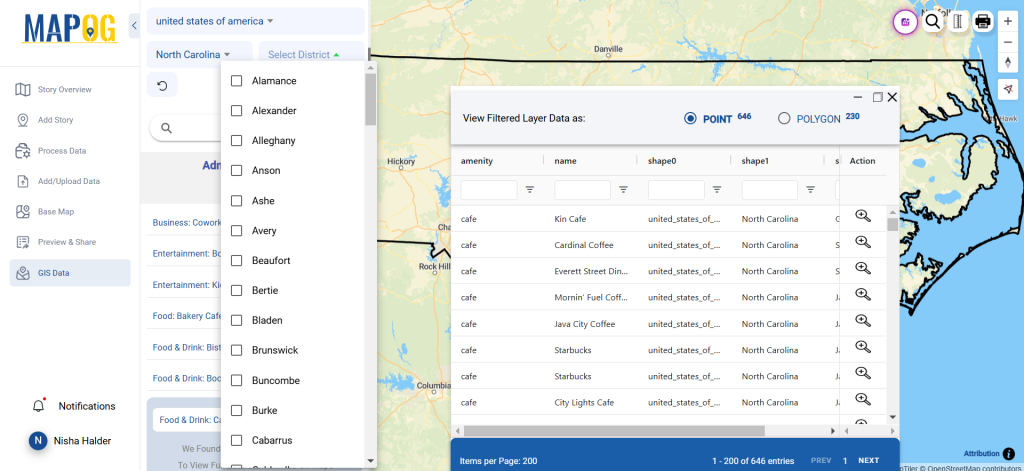
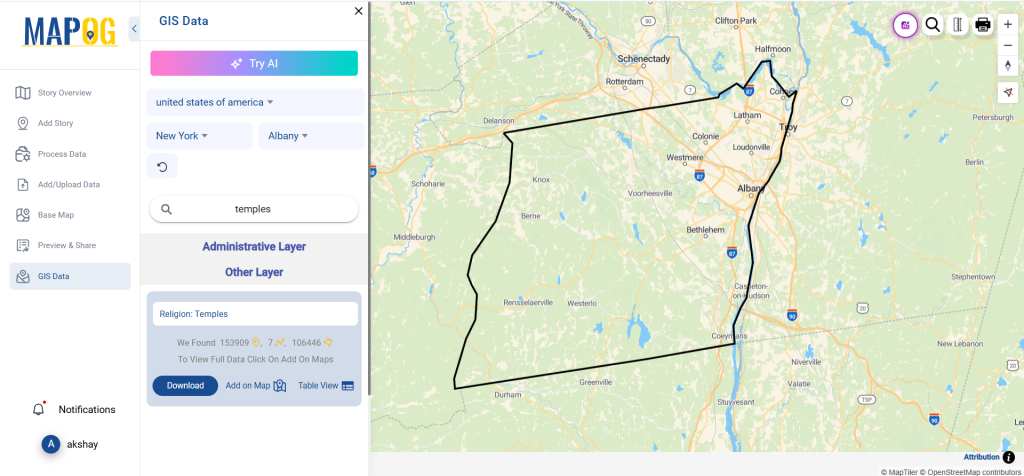
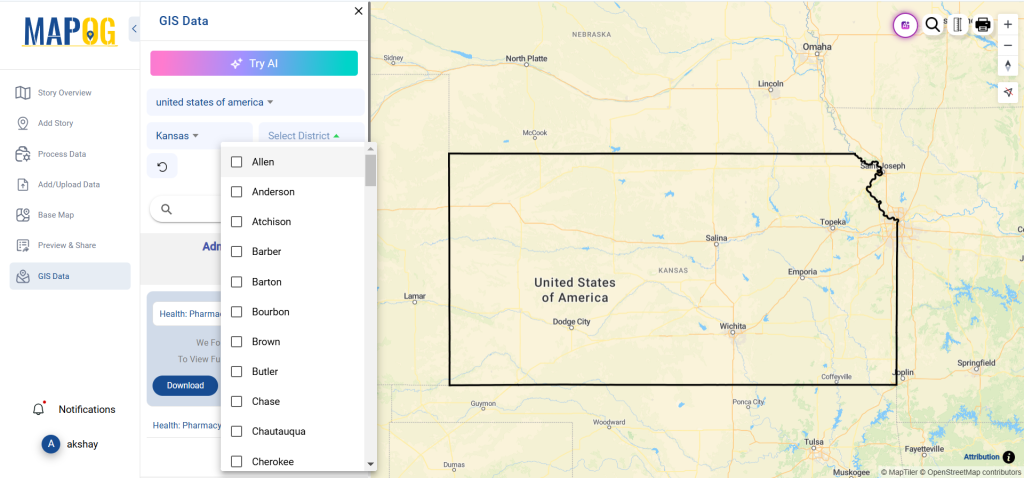
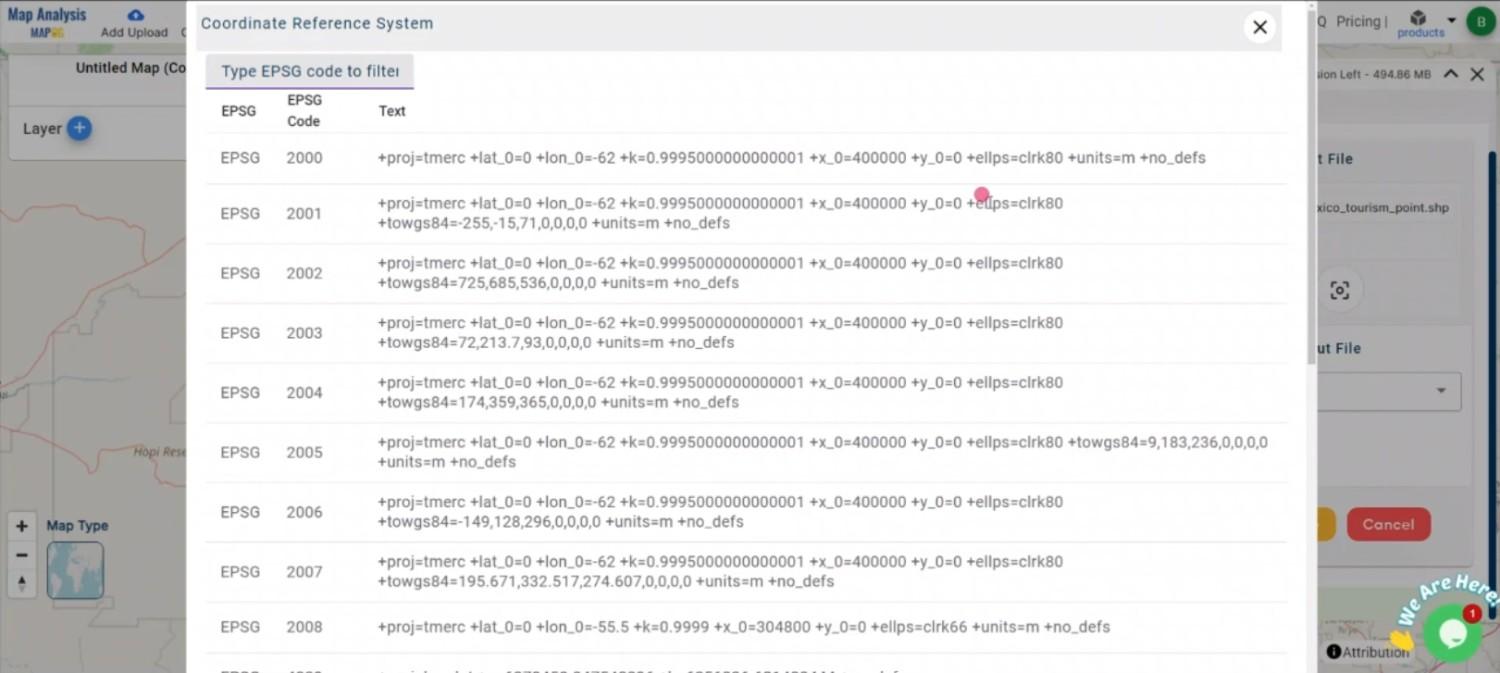
Step 3: Choose the Output Coordinate Reference System (CRS)
Select the appropriate CRS if your data contains spatial information. This step ensures the geographic features in your SQLITE database are accurately positioned.
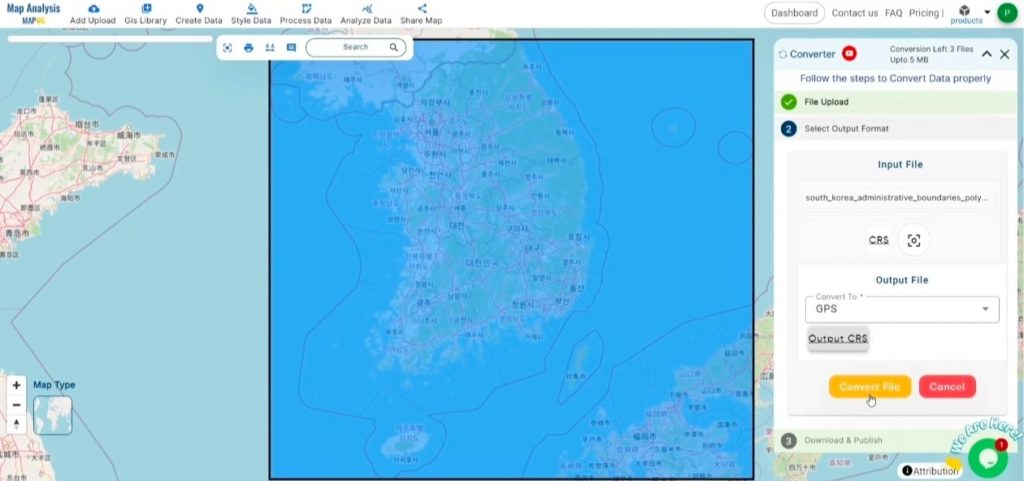
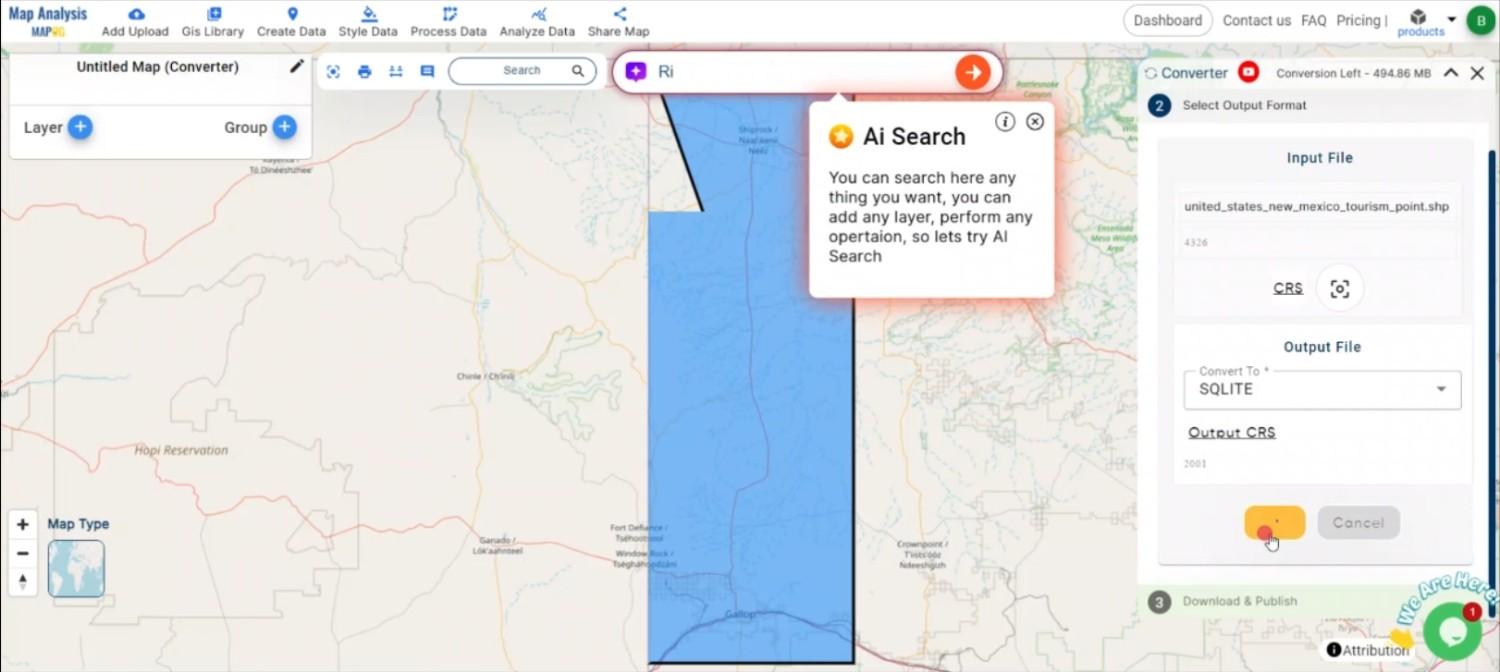
Step 4: Execute the Conversion
Once you’ve selected the SQLITE format and the desired CRS, initiate the conversion process. The MAPOG tool will quickly and accurately convert your SHP file into an SQLITE database.
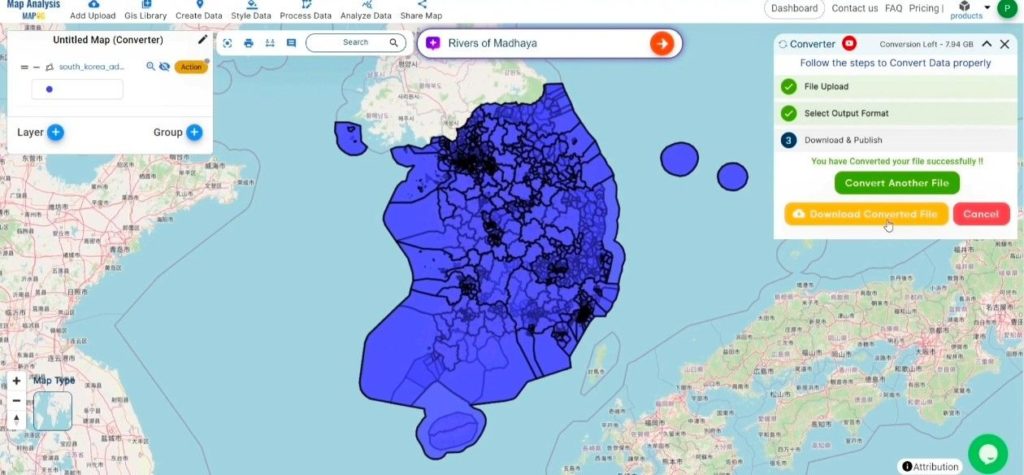
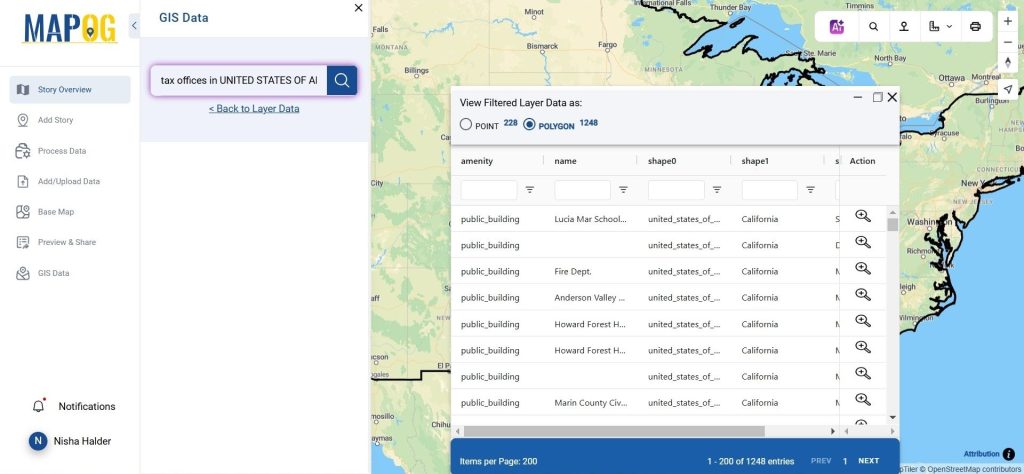
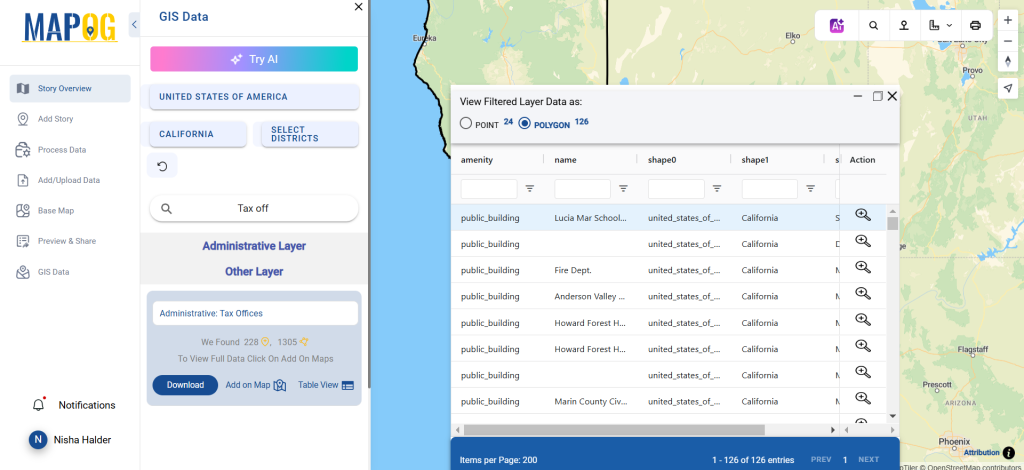
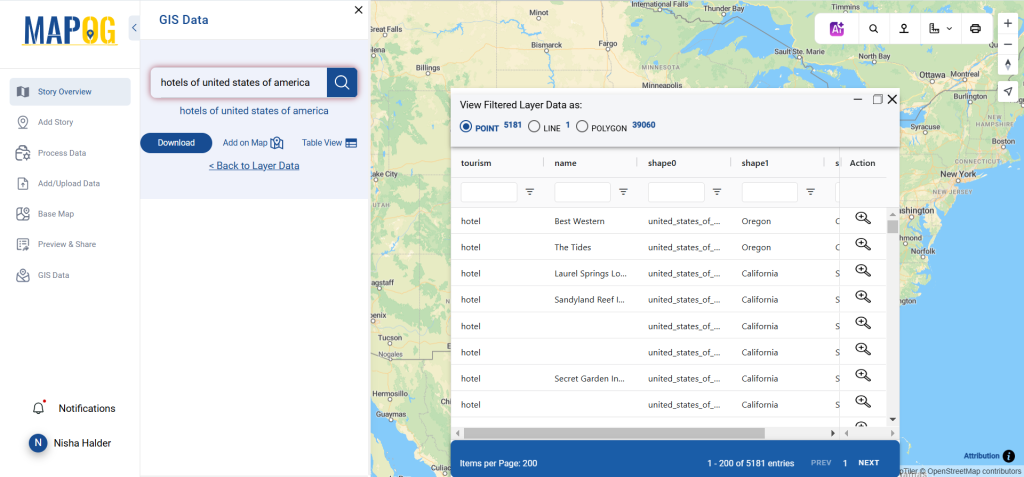
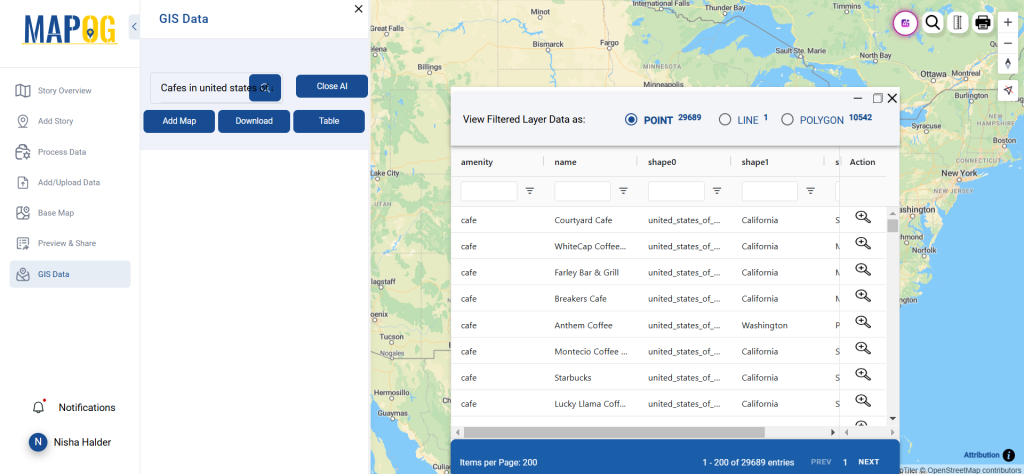
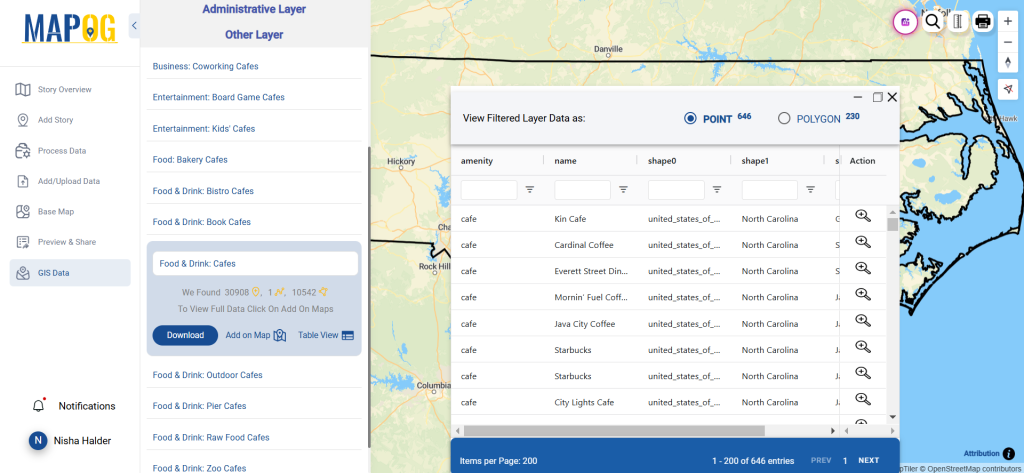
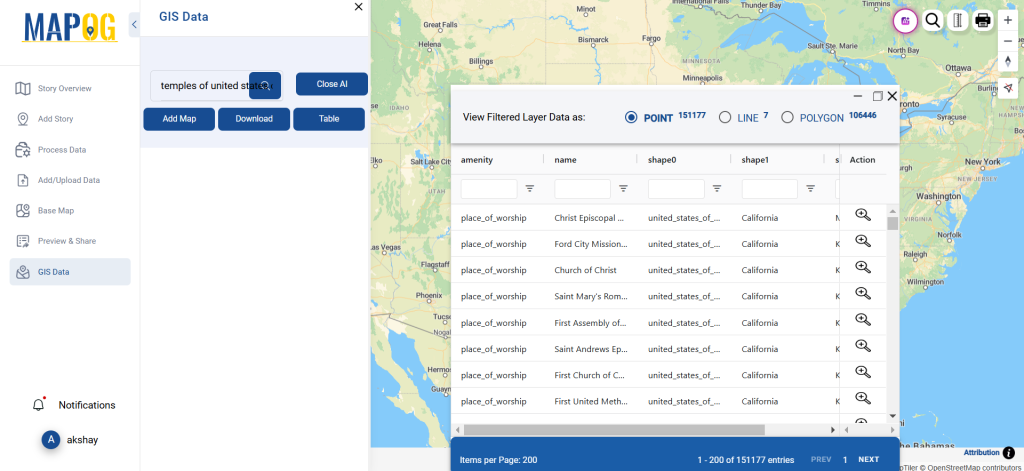
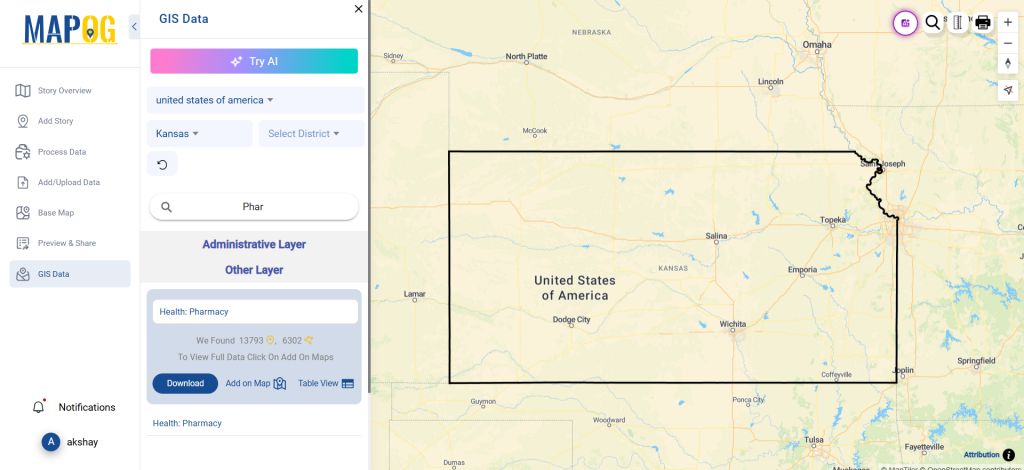
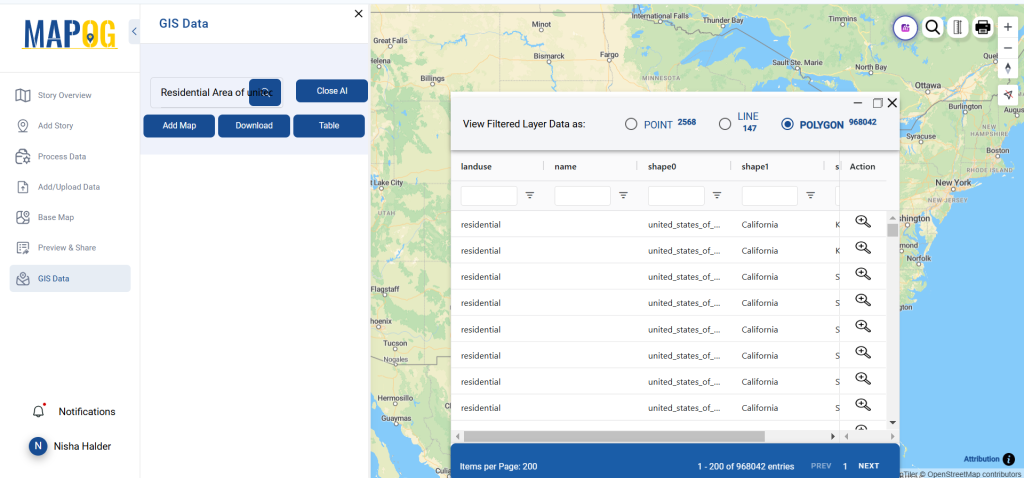
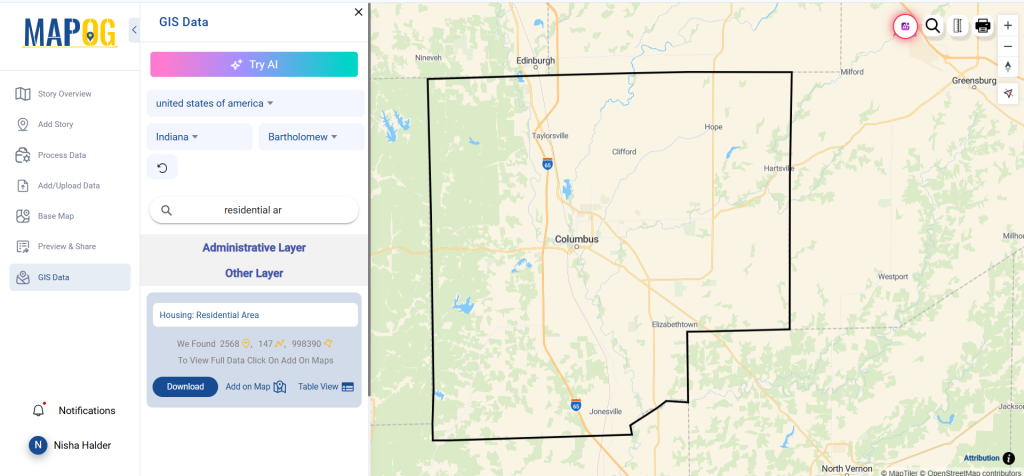
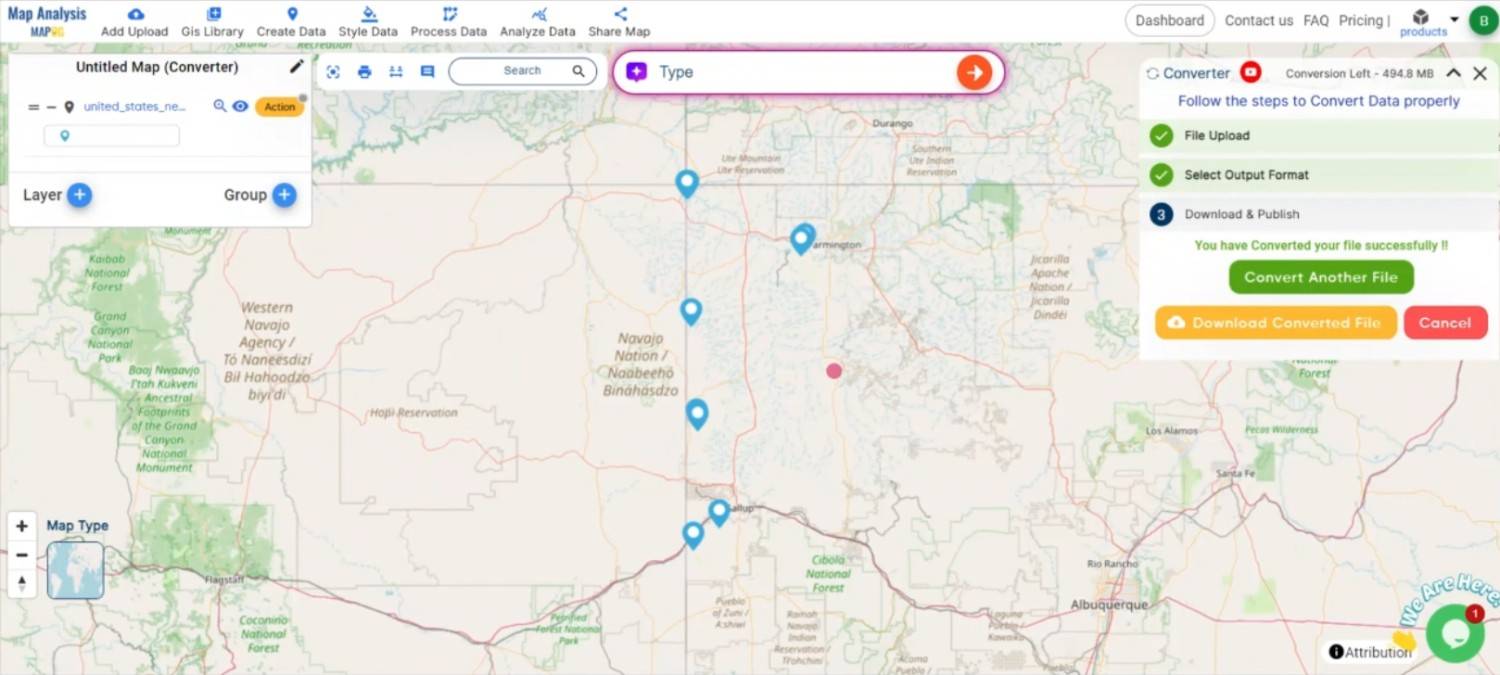
Step 5: Review and Download
After the conversion is complete, review the output to confirm the data was correctly converted. Finally, download the SQLITE file, which is now ready to be integrated into database-driven GIS systems for advanced analysis and management.
Conclusion:
The MAPOG Converter Tool streamlines the process of converting GIS data between different formats, making it a valuable resource for GIS professionals. By following these steps, you can easily convert SHP files to SQLITE format, ensuring your data is well-prepared for storage in GIS data. If you need to download any data file in SHP or in any other formats like TOPJSON, GEOJSON, KML. Visit GIS DATA, here we have 900+ data layers for 200+ countries.
Feature Tool:
Story by MAPOG:
Story by MAPOG is ideal for users who wish to put their data to life via interactive and attractive maps. It helps you to make memorable tales by combining maps with multimedia elements such as photos and text.
Here are some other blogs you might be interested in:
- Convert KML to GML Online
- Convert KML to GPKG Online
- Convert Online Gis data : KML to PDF file
- Converting KML to GeoTIFF , Online Gis Data Converter
- Converting KMZ to SHP : Online GIS Data Conversion
- Converting TopoJSON to SHP Online : GIS Data Converter
- Converting GeoJSON to CSV with MAPOG
- Converting KMZ to KML with MAPOG
- Converting GML to KML with MAPOG
- Convert KMZ to TopoJSON Online
- Converting KMZ to GeoJSON Online
- Convert KML to GeoJSON file online
- Convert KML to TopoJSON Online
- GeoJSON to GeoTIFF – Vector to Raster Conversion
- KML to GeoTIFF – Vector to Raster Conversion
- SHP to GPX / GPS
- Convert Geojson to MIF MapInfo file
- GeoJSON to Shapefile
- Convert GML to CSV
- Convert KMZ to GPX