Blog

Create Category Map in GIS – IGIS Map Converter Tool

Category map in GIS is the most common and simple type of GIS Map. Category map in GIS can be created very easily with the help of MapOG Converter Tool. The Category map in GIS help us visualize and identify the category of the location. Categorization is an essential requirement for the map users to analyze and understand the data easily.

Create Category Map in GIS  – IGIS Map Converter Tool

Styling a Category map in GIS allows you to give different features and styles based on values in the attribute data in a specific layer. As a result user can easily analyze and understand the data. Likewise with the help of styling the attribute data in a layer, user can categories specific locations and data in minutes.

To create GIS Category Map with IGIS Map Tool you need to follow some steps as follows:

Create Category Map in GIS - IGIS Map Tool

  • Upload dataset and create a new map project Or Open your existing map project.

Create Category Map in GIS - IGIS Map Tool

  • Once the map is open click on the “Style Layer” option on top of the map layer.

Create Category Map in GIS - IGIS Map Tool

  • Select a layer that you want to create GIS Category map with.

Create Category Map in GIS - IGIS Map Tool

  • Now click on the Category map section to create GIS Category map.
Create Category Map in GIS - IGIS Map Tool
Create Category Map in GIS – IGIS Map Tool
  • The column dropdown in the Category section contains every column present in the data attribute table. Select the column that you want to categorize. By default each different value in the column will be given its own color.
  • Only the first 50 columns will be styled because columns have the limit of not more than 50 unique values. As it can not style more than 50 values.
  • You can set the opacity for the colors to filled in the fill section. Each category will be assigned a color at random from the color bar and  you can also change the default color in the fill section.
  • You can also set the line width, opacity & color of the stroke or outline section.

Finally this is how you can Create Category Map in GIS with IGIS Map Converter Tool. This type of visualization is useful for classifying expertise and insight into a whole new map on the basis of location or dataset in the attribute table.

Category Map in GIS – Uses

Business analysis, Risk management and classified mapping are the main uses of Category map. It can be very helpful because of the its ability to allow us visualize the category of the data attribute table.  It also provides a deeper understanding of the commercial and operational data associated with a particular dataset.

Category Map mainly serves in following industries:

Let’s take a example. US Government took a survey in Florida (USA) for reviewing the unemployed population of different areas to compare the number of unemployed people in one area to the number of people in another area in Florida.  By creating Category map they helped in the visual analysis of the unemployed population in different areas of Florida.

Category Map in GIS categorizes the unemployed population in different areas of Florida with the help of MapOG Converter Tool.

Create Category Map in GIS - IGIS Map Tool
Create Category Map in GIS – IGIS Map Tool

(#this is a sample data)

It seems like this post can help you in development and Create Category map in GIS with IGIS Map Converter Tool. If you find any problem in creating one such example do let us know by commenting below.

Basics of Cartography: Map, Map Projection

Cartography is a science which deals with the study and drawing of maps. Simply, we can say it is related to mapmaking methods. Cartography is made of two words ‘Carto’ means map or chart and graphy means ‘to draw’ or ‘to write’. Here in this article we will understand Basics of Cartography: Map, Map Projection.

Create beautiful Maps without writing a Code

Cartography in GIS

Cartography is related to representation while GIS is concerned with the analysis of spatial data. Sometimes, maps becomes more popular than their makers.

What is Map?

A visual depiction of all or part of an area on a flat plane is termed as MAP. Simply, we can say art of representing the surface of sphere or three dimensional into two dimensional body.

Types of Map Projection:

A map projection is the method to represent the spherical surface or object like that in two dimensional plane or flat surface. So therefore, there are both distortion and projection.

There are three major types of Projections:

The name of the projection is the shape that the image is projected onto.

  1. Cylindrical Projection
  2. Conical Projection
  3. Planar Projection


  1. Cylindrical Projection –Basics of Cartography: Map, Map Projection

  • It is also known as Mercator Projection. One can imagine that a paper to be wrapped as a cylindrical around the globe, tangent to it along the equator.
  • In this projection size and shape of land near poles are highly distorted.
  • Area near the equator is lightly distorted.
  • Direction provided in this cylindrical map projection is accurate.
  • Cylindrical Map Projection is important for navigation.


  1. Conical Projection –

Basics of Cartography: Map, Map ProjectionIn a conic projection area of the Earth is projected on to the cone. Simply we can say when we place a cone on the Earth and unwrap it, then the result of the projection is termed as conic projection. It is tangent to the Earth along a line of latitude.


  1. Planar Projection –

Basics of Cartography: Map, Map ProjectionPlanar projection also known as azimuthal projection. In this projection a flat sheet of paper is tangent to Earth at one point. Point of contact may be any point on Earth surface; most importantly north and south poles are used for GIS database. Selection of point of contact depends on the reasons why we need projection or what type of function we want to do with the projection.

Even more Check : Formula to find bearing or heading angle between two points

See the Video for more clarification –


Hence, in this article we have covered Map projection. Hope this article filled the void by providing basics of Cartography.

Furthermore, you can sign up for free tutorials.

Subscribe to us on Youtube Channel Info GIS MAP


Leaflet.js – Point, Polyline, Polygon, Rectangle, Circle – Basic Shapes

In this tutorial we are focusing on the Leafletjs basic shapes used for mapping. Leaflet.js can add various shapes such as circles, polygons, rectangles, polylines, points or markers etc. here, we will discuss how to use the shapes provided by Google Maps. If you are not familiar with Leaflet.js, you can visit our another blog Leaflet js – Getting Started – create Map Application. Also if you already have geojson files, you can load the geojson files with leafletjs as a map.

Marker or Point

To draw point overlay on a map using leaflet javascript library, follow the steps below-

      • Create a Map object by passing a <div> element (String or object) and map options (optional).
      • Create a Layer object by passing the URL of the desired tile.
      • Add the layer object to the map using the addLayer() method of the Map class.
      • Create a latlangs variable for the point to draw point or marker, as shown below.
Var point = [38.9188702,-77.0708398];
      • Create a point or marker using the L.marker(). To draw the marker, pass the location as variable.

        L.marker([38.9188702,-77.0708398]).addTo(newMap);
        

        Polyline

To draw polyline overlay on a map using Leaflet JavaScript library, follow the steps given below −

      • Create a Map object by passing a <div> element (String or object) and map options (optional).
      • Create a Layer object by passing the URL of the desired tile.
      • Add the layer object to the map using the addLayer() method of the Map class.
      • Create a latlangs variable to hold the points to draw polyline, as shown below.

        var latlngs = [ [38.91,-77.07], [37.77, -79.43], [39.04, -85.2]];
      • Create a polyline using the L.polyline(). To draw the polyline, pass the locations as variable and an option to specify the color of the lines.

        var polyline = L.polyline(latlngs, {color: 'red'});
      • Add the polyline to the map using the addTo() method of the Polyline class.

        Polygon

To draw a polygon overlay on a map using Leaflet JavaScript library, follow the steps given below −

      • Create a Map object by passing a <div> element (String or object) and map options (optional).
      • Create a Layer object by passing the URL of the desired tile.
        Add the layer object to the map using the addLayer() method of the Map class.
      • Create a latlangs variable to hold the points to draw the polygon.

        var latlngs = [
           [17.385044, 78.486671],
           [16.506174, 80.648015],
           [17.686816, 83.218482]
        ];
      • Create a polygon using the L.polygon(). Pass the locations/points as variable to draw the polygon, and an option to specify the color of the polygon.

        var polygon = L.polygon(latlngs, {color: 'red'});
      • Add the polygon to the map using the addTo() method of the Polygon class.

shape-polygon

Rectangle

To draw a Rectangle overlay on a map using Leaflet JavaScript library, follow the steps given below –

      • Create a Map object by passing a <div> element (String or object) and map options (optional).
      • Create a Layer object by passing the URL of the desired tile.
        Add the layer object to the map using the addLayer() method of the Map class.
      • Create a latlangs variable to hold the points to draw a rectangle on the map.

        var latlngs = [[18.739046, 80.505755], [15.892787, 77.236081]];
      • Create a rectangle using the L.rectangle() function. Pass the locations/points as a variable to draw a rectangle and rectangle Options to specify the color and weight of the rectangle.
var rectOptions = {color: 'Red', weight: 1}
var rectangle = L.rectangle(latlngs, rectOptions);
      • Add the rectangle to the map using the addTo() method of the rectangle class.

        rectangle.addTo(map);

shape-rect

Circle

To draw a circle overlay on a map using Leaflet JavaScript library follow the steps given below.

      • Create a Map object by passing a <div> element (String or object) and map options (optional).
      • Create a Layer object by passing the URL of the desired tile.
        Add the layer object to the map using the addLayer() method of the Map class.
      • Create a latlangs variable to hold the center of the circle as shown below.

        var circleCenter = [40.72, -74.00];
      • Create a variable circleOptions to specify values to the options color, fillColor and, fillOpacity as shown below.

        var circleOptions = {
           color: 'red',
           fillColor: '#f03',
           fillOpacity: 0
        }
      • Create a circle using L.circle(). Pass the center of the circle, radius, and the circle options to this function.

        var circle = L.circle(circleCenter, 50000, circleOptions);
        
        
      • Add the above-created circle to the map using the addTo() method of the Polyline class.

        circle.addTo(map);

shape-circle

This article contains the basic shapes created and used in the leaflet js scripting library. If you have any questions related to leaflet.js, please let us know in the comment section.

Convert KML to GeoJSON

Have you extracted and downloaded KML file from Google Earth or Google map and want to render it with libraries supporting GeoJSON file format? Are you tired of downloading the same data in different formats? Using Map Tool you can easily convert – KML to GeoJSON. You can also do other GIS Data Conversion using this tool.

KML is a file format used to display geographic data in an Earth browser such as Google Earth. You can create KML files to pinpoint locations, add image overlays, and expose rich data in new ways. KML is an international standard maintained by the Open Geospatial Consortium, Inc. (OGC).

GeoJSON is an open standard format designed for representing simple geographical features, along with their non-spatial attributes. It is based on the JSON format.

Online Converter Tool from KML To GeoJSON

MAPOG Converter Tool

MapOG converter is an incredible tool for conversion of data. It will translate KML data which is widely used in software like Google Earth, Fusion Tables, Maps and GPS devices and convert them by one click to GeoJSON (JSON) format which is widely used in software like MongoDB, Geoserver, CartoWeb and Feature Server. It Convert GIS / CAD files online without using complex and Enterprise Software like ArcGIS, QGIS, AutoCAD etc. IGIS Map converter is much easier to use than any other conversion software or tool. 

Along with conversion from KML to GeoJson, you can also check following conversions like KML to Shp, KML to KMZ, KMZ to KML, KML to DXF, KML to Topojson, KML to GML etc.

IGISMAP to Convert KML to GeoJSON

For KML to GeoJSON conversion, go to MapOG Converter Tool, after logging in with your registered email and password. If you are a new user, click the Sign Up button in the Login popup and register to IGISMAP by filling the details.

IGISMAP
IGISMAP

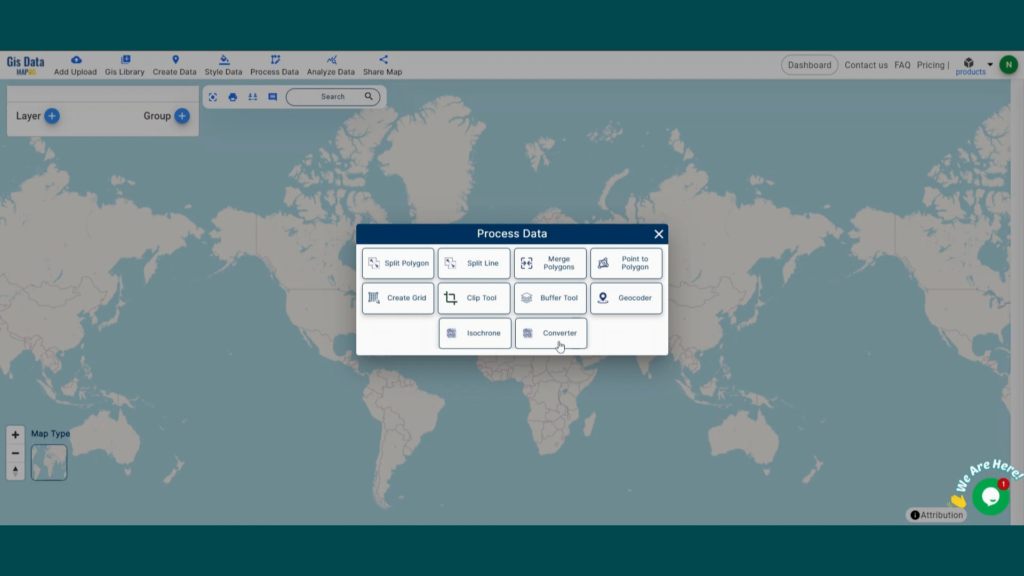
There are four main steps for using GIS Converter:

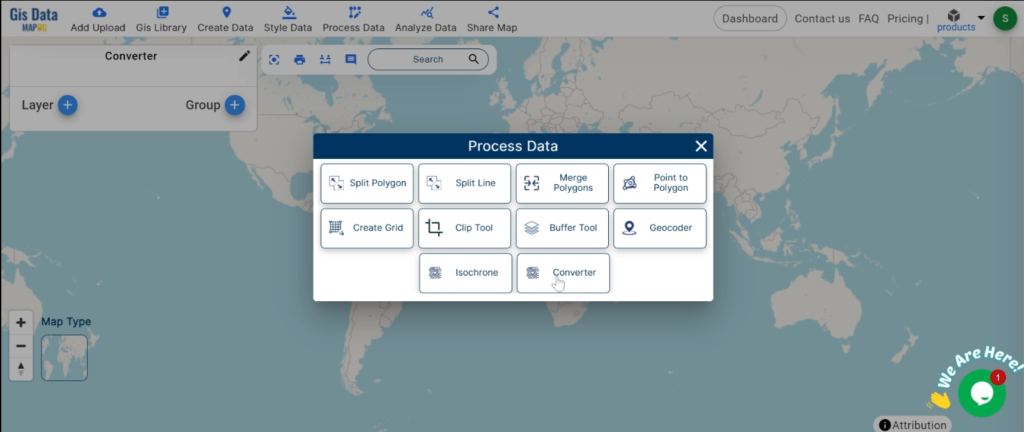
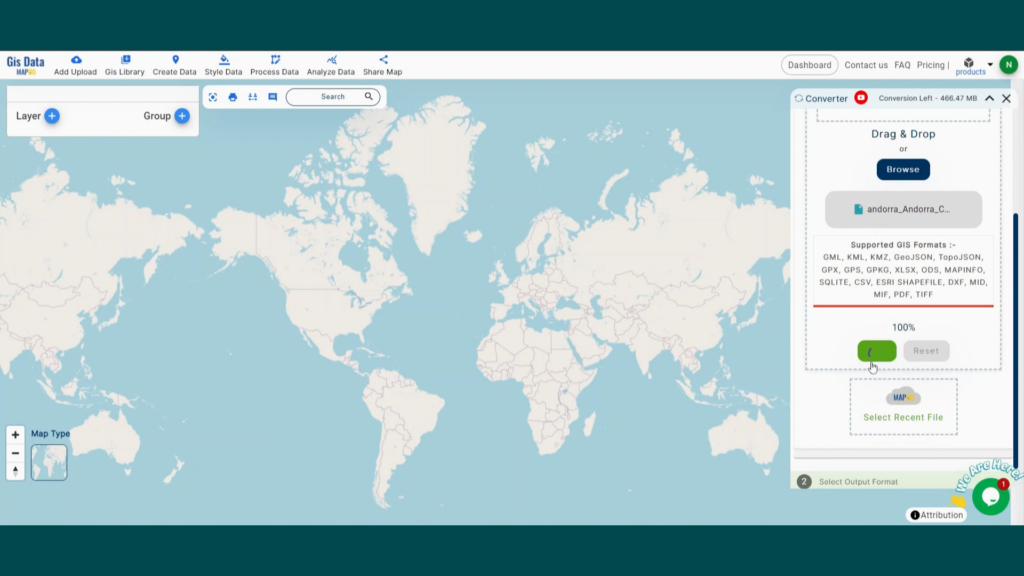
  • Click on Tool Converter
  • Upload the data
  • Choose the format to which it should be converted
  • Download the converted file

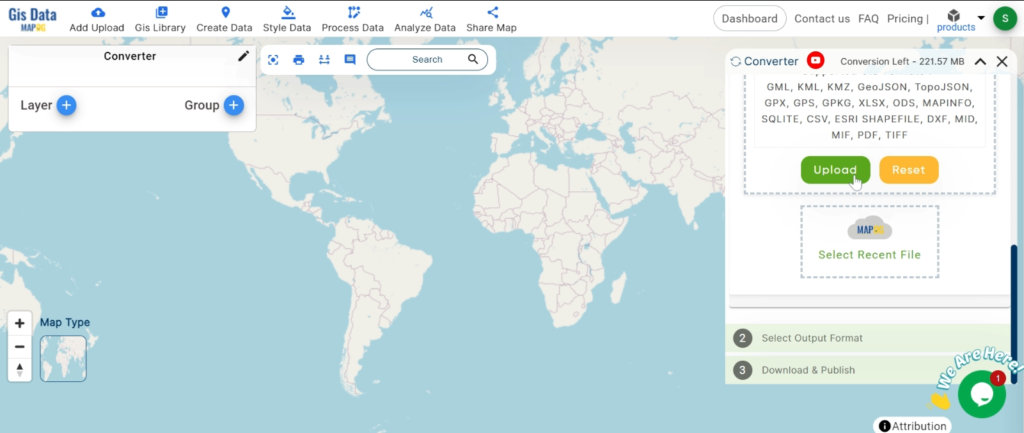
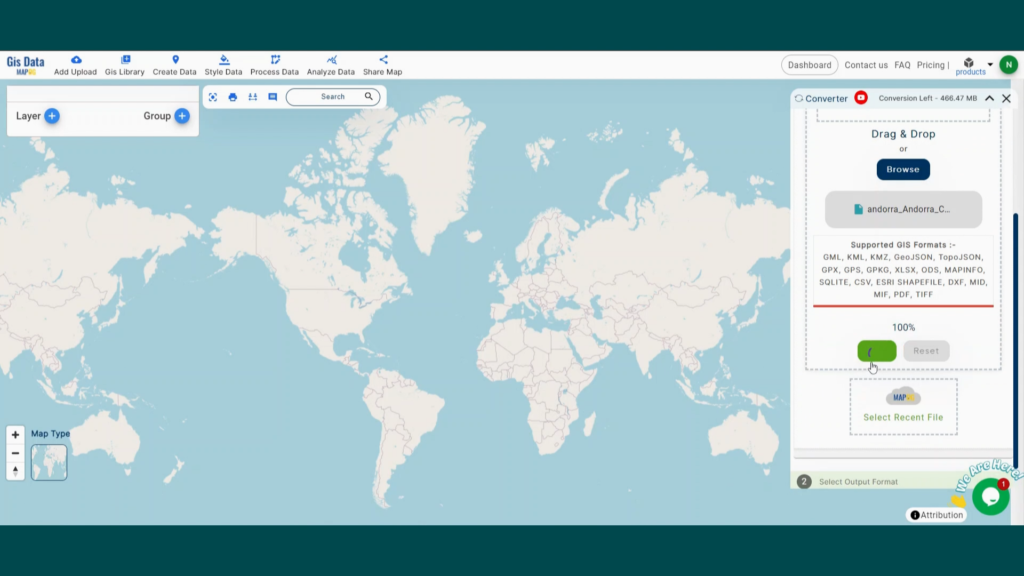
Step one is to upload your KML file which you want to convert. You can upload your file from system or select from the Recent Files.

Upload KML
Upload KML

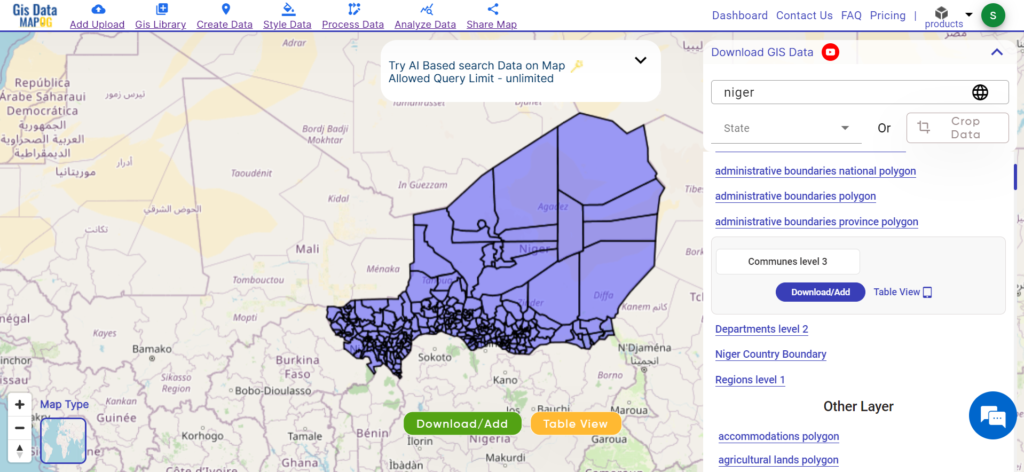
Here we using the KML file of Turkey national boundary.

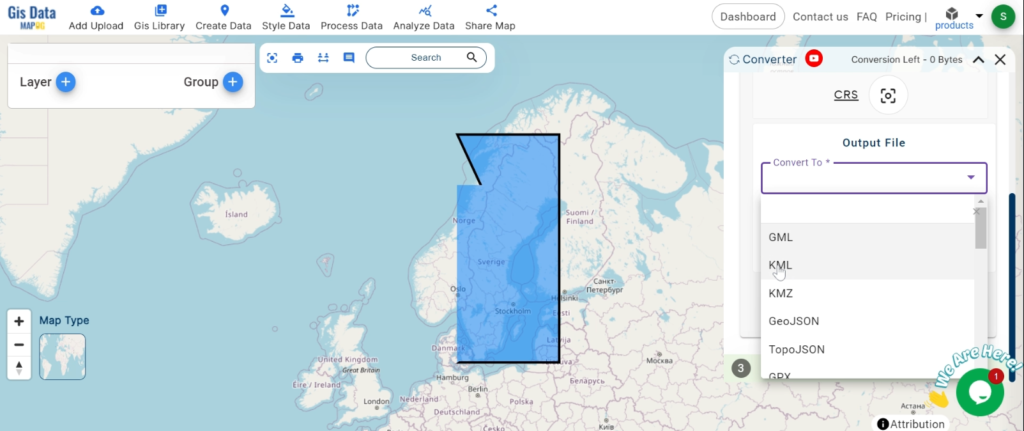
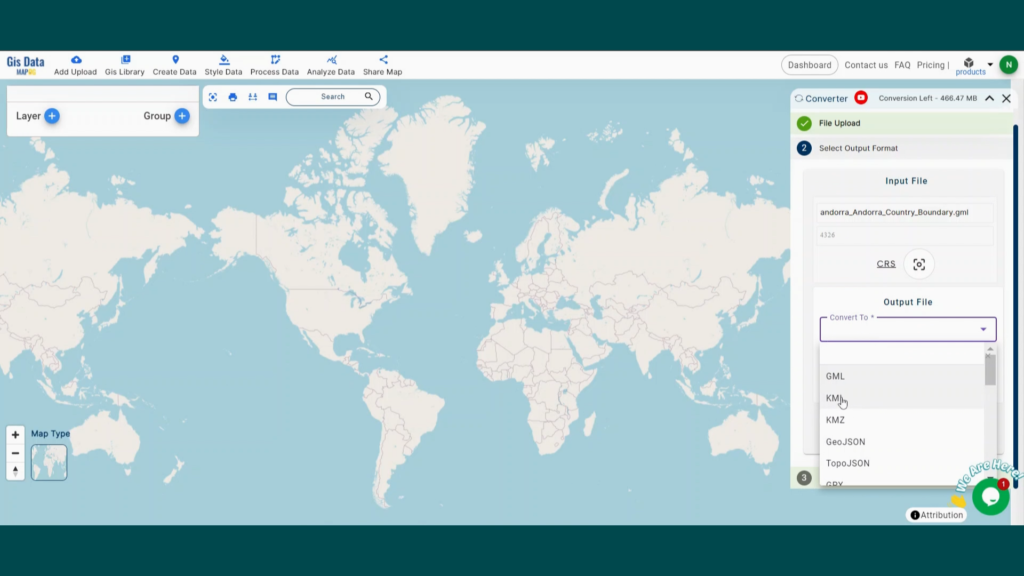
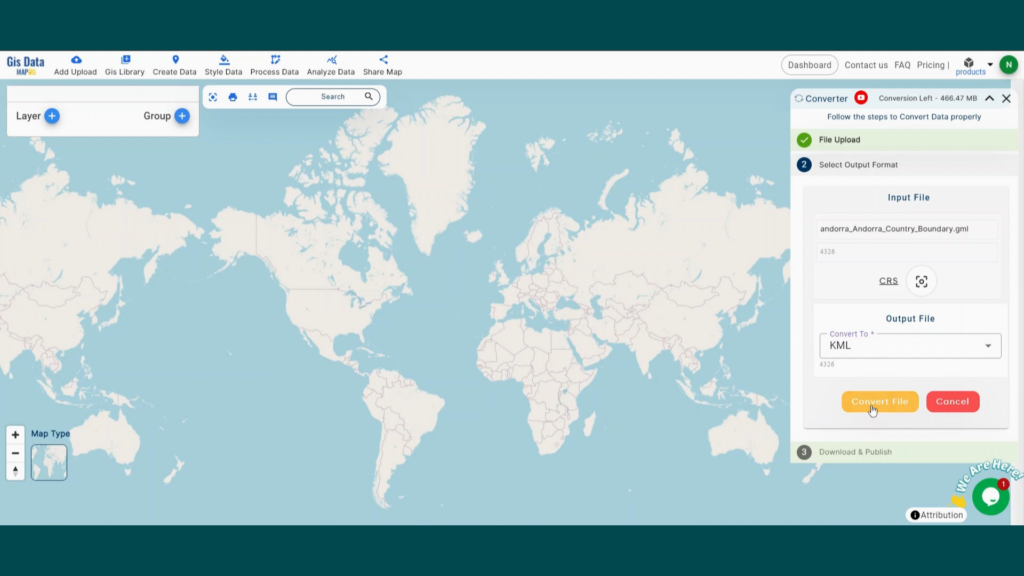
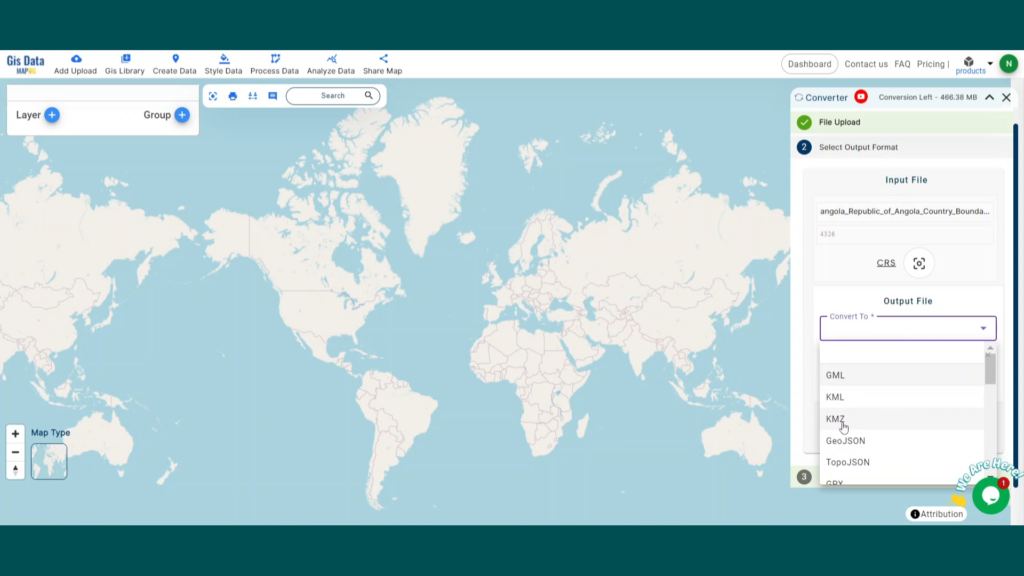
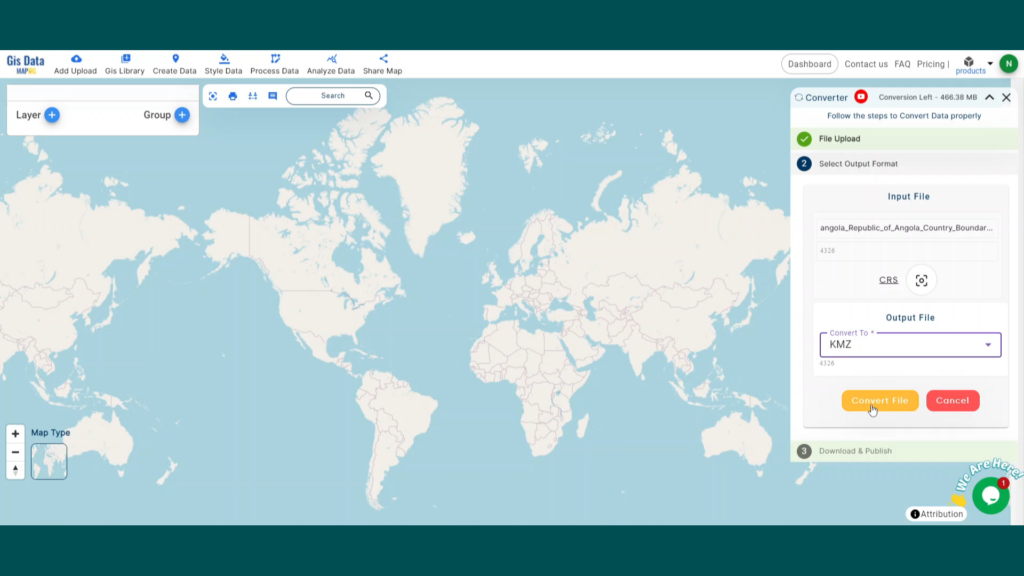
Step two is to select the output format from the dropdown for the converted file, in this case its GeoJSON. You can also set the Coordinate Reference System of your preference. As a default CRS will set to WGS 84 (World) [EPSG:4326]. Click on the Convert File.

Slect GeoJSON as output Format
Select GeoJSON as output Format

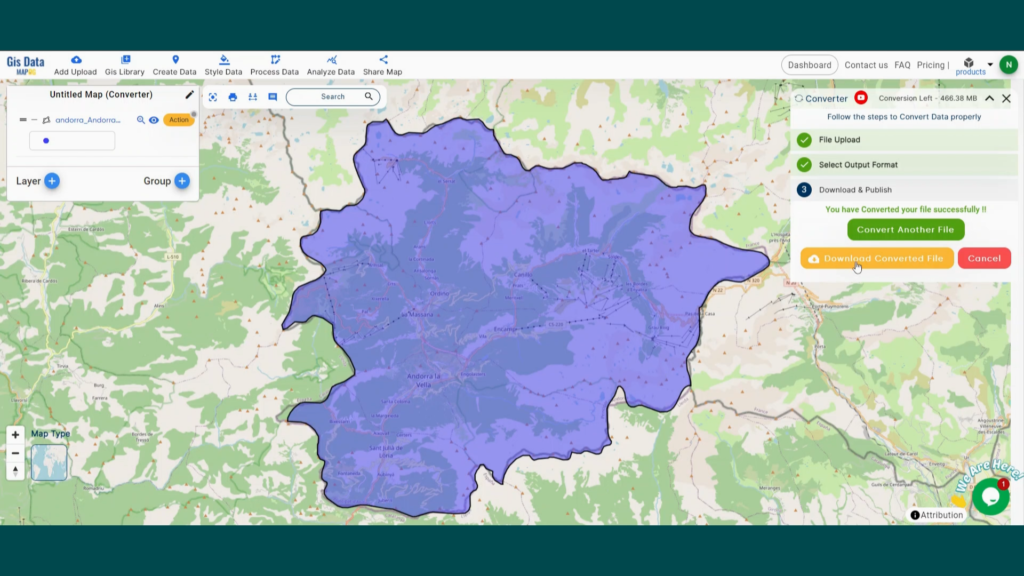
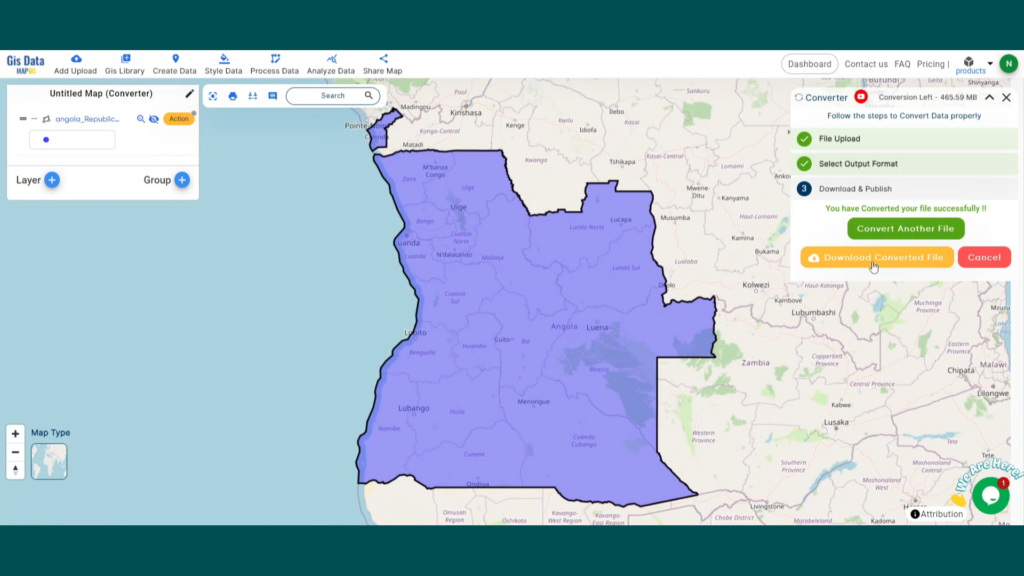
Your KML file will then gets converted to GeoJSON file after a few seconds and will be available for downloading.

Download GeoJSON file

You can also choose to style the layer or continue with further conversion process by clicking the Convert Another File button.

Converted Files section from the dashboard contains the list of the details of all the conversion done in your account, providing both input and output data available for download their corresponding formats.

Download free shapefile of various countries.

Create your own shapefile and share with your clients or embed on your website. 

Convert KMZ to KML

In this post we are going to discuss that how can we convert KMZ to KML data format. Both KML and KMZ are file extensions used in Google applications, specifically Google Earth and Google Maps. A person using these two Google applications can encounter a lot of file formats, including KML and KMZ.

A KML file is a text based file composed of Tags similar to .XML or .HTML. KML files can also be converted to a .KMZ file. KMZ is a zipped file containing one or compressed KML files. KMZ data which is used in software like Google Earth and GPS devices can be converted with one click to KML format used in software like Google Earth, Fusion Tables, Maps and GPS devices with the help of IGISMAP Converter.

Online Converter Tool To Convert KMZ to KML

Conversion of GIS data like KMZ to KML can be so easy with the help of online conversion IGIS Map tool. You can also check Convert KML to DXF. KML to KMZ, KML to SHP, KML to CSV, KML to GML, KML to GeoJSON, KML to TopoJSON etc.

IGISMAP to Convert KMZ to KML

IGIS Map Converter also supports more other vectors and raster GIS/CAD formats and more than 4000 coordinate reference systems. If the coordinate system of your input data is not present or not recognized correctly, it is possible to assign the correct one. IGIS Map Converter makes it possible to transform your data to any other coordinate reference system.

Here are some of the main process in converting KMZ to KML using IGIS Map Converter.

Go to MapOG Converter Tool, after logging in with your registered email and password. If you are a new user, click the Sign Up button in the Login popup and register to IGISMAP by filling the details.

There are three main steps for using GIS Converter:

  • Upload the data
  • Choose the format to which it should be converted
  • Download the converted file.

Step one is to upload your KMZ file which you want to convert. You can upload the file from your system or select from the Recent Files.

Upload KMZ
Upload KMZ

Here we are uploading the KMZ file of the Washington counties layer

Step two is to select choose the output format of the converted file, in this case its KML. You can also set the Coordinate Reference System of your preference. As a default CRS will set to WGS 84 (World) [EPSG:4326]. Click on the Convert File.

Select KML as Output Format

Your KMZ file will then get converted to KML file after a few seconds and will be available for downloading.

Download and Publish KML File

You can also choose to style the layer or continue with further conversion process by clicking the Convert Another File button.

Converted Files section from the dashboard contains the list of the details of all the conversion done in your account, providing both input and output data available for download their corresponding formats.

You can also search locations, add new datasets, edit layers and style the map according to your choice and requirements. As IGIS Map Converter Tool provides many benefits other then just conversion of data. This tool provides us to generate this published map in PDF or as image format.

Other GIS data Conversions

If you are facing any problem in conversion or login then please let us know by mailing at support@igismap.com or drop comment.

Convert KML to DXF

Are you looking for converting your KML data file into DXF format for your GIS project or uploading in the CAD system? Have you extracted and downloaded KML file from Google Earth or Google map and want to render it with your geo library which support DXF format? You can carry out this process using any GIS or Design specific desktop software. There are also a number of online tools to perform this conversion. but If you don’t want to spend so much time just on conversions and want an easy way for conversions. Here is an amazing tool for converting your data files within a minute, i.e. MapOG Converter.

MapOG Converter

IGIS Map converter is an incredible tool for data file conversions. It will translate an AutoCAD file (in DXF format) to a shapefile or KML format. It can also convert from KML format to shapefile, or KML to DXF, or Shapefile to DXF.  It Convert GIS / CAD files online without using complex and Enterprise Software like ArcGIS, QGIS, AutoCAD etc. IGIS Map converter is much easier to use then any other conversion software or tool.

MAPOG to Convert KML to DXF

Go to MapOG Converter Tool, after logging in with your registered email and password. If you are a new user, click the Sign Up button in the Login popup and register to IGISMAP by filling the details.

There are three main steps for using GIS Converter:

  • Upload the data
  • Choose the format to which it should be converted
  • Download the converted file.

Step one is to upload your KML file which you want to convert. You can upload the file from your system or select from the Recent Files.

Converter Tool - Upload KML
Upload KML

Here we using the KML file of New York state boundary.

Step two is to select choose the output format of the converted file, in this case its DXF. You can also set the Coordinate Reference System of your preference. As a default CRS will set to WGS 84 (World) [EPSG:4326]. Click on the Convert File button.

Converter Tool - DXF as Output Format
Select DXF as Output Format

Your KML file will then get converted to DXF file after a few seconds and will be published in the map canvas. You can download the DXF file of New York state boundary by clicking the Download Converted File button.

Download and Publish DXF File

You can also choose to style the layer or continue with further conversion process by clicking the Convert Another File button.

Converted Files section from the dashboard contains the list of the details of all the conversion done in your account, providing both input and output data available for download their corresponding formats.

Conclusion

IGIS Map Converter Tool provides many benefits other then just conversion of data. This tool provides us to generate this published map in PDF or as image format.

InfoGISMapOG supports most of the commonly used GIS or AutoCAD files like Shapefile SHP, KML, KMZ, CSV, TopoJSON, GeoJSON, GML, DXF, GeoTIFF, NetCDF, GRIB, HDF5, OSM, PBF, and many more raster and vector files, along with that it support more than 4000 Coordinate Reference System.

IGIS Map Converter is a online tool for converting GIS data files from one format to another. which helps you in easy data conversion and beautiful and incredible map creation in no time. IGIS Map converter online tool is recommended for better and easy conversions.  If you want you can also use ogr2ogr offline conversion tool for convert KML to DXF format.

Need Sample data for research and study – Download Shapefile of Countries

If you face any problem during implementing this tutorial, drop a mail at support@igismap.com, also feel free to comment in given comment box.

Get Band Information from WMS Geoserver Leafletjs

Get Band Information from WMS Geoserver Leafletjs. Band Information from Layer: In its simplest form, a raster consists of a matrix of cells (or pixels) organized into rows and columns (grid), where each cell contains a value representing information, such as temperature, precipitation or elevation etc. Rasters are digital aerial photographs, imagery from satellites, digital pictures, or even scanned maps.

Get Band Information from WMS Geoserver Leafletjs

Data stored in a raster format represents real-world phenomena – Get Band Information from WMS Geoserver Leafletjs:
  • Thematic data (also known as discrete) represents features such as land-use or soils data.

  • Continuous data represents phenomena such as temperature, elevation, or spectral data such as satellite images and aerial photographs.

  • Pictures include scanned maps or drawings and building photographs.

You may check different multidimensional multiband files like Grib files, NetCDF files and Hdf5 files.

There are three main ways to display (render) single-band raster datasets:
  • Using two colors—In a binary image, each cell has a value of 0 or 1 and is often displayed using black and white. This type of display is often used for displaying scanned maps with simple line work, such as parcel maps.

  • Grayscale—In a gray scale image, each cell has a value from 0 to another number, such as 255 or 65535. These are often used for black-and-white aerial photographs.

  • Color map—One way to represent colors on an image is with a color map. A set of values is coded to match a defined set of red, green, and blue (RGB) values.

When there are multiple bands, every cell location has more than one value associated with it. With multiple bands, each band usually represents a segment of the electromagnetic spectrum collected by a sensor. Bands can represent any portion of the electromagnetic spectrum, including ranges not visible to the eye, such as the infrared or ultraviolet sections. The term band originated from the reference to the color band on the electromagnetic spectrum.

Get Band Information from WMS Geoserver Leafletjs

This demo shows the raster overlay on map with the help of Leaflet javascript library. The raster contains three bands as Red, Blue and green. Here raster data is in GeoTiff format and is published on Geoserver. This demo is about how one can extract the Bands information from layer. In similar way we can also extract values such as elevation, any natural hazards distortion or changes in data from layers.

Get Band Information from WMS Geoserver Leafletjs

For this demo we have downloaded data from  from one of the free data download website. It is a raster data containing three bands as blue, red and green. In this demo we render raster data on map and shown the value of bands using popup.

Raster data on GeoServer and styling:

GeoServer is an open source server for sharing geospatial data in both vector format and raster format. It is designed to host major datasets, which can easily render on maps.

To Download and install GeoServer please follow the last article. Then login to the GeoServer and publish data on the Geoserver and get the link from layer preview section. You can visit the articles to know how to publish and style the GeoTiff file on Geoserver and also how to make geotiff work with geowebcache for tiling.

For rendering layer on map, you need to create division for map.

var map = L.map('map').setView([34.84859848,-111.788002],5);
  L.tileLayer('http://{s}.tile.osm.org/{z}/{x}/{y}.png', {
  attribution: '&copy; <a href=”http://osm.org/copyright”>OpenStreetMap</a> contributors'
  }).addTo(map);
Render Raster on Map:

To render this data on map, we need to get the data from GeoServer, which can be done by using leaflet javascript library. In the Leaflet library, we have Leaflet-WMS plugin.

<script src="leaflet.wms.js"></script>
What is WMS service:

WMS (web map service), is a way of publishing maps. This format is similar to map tiles, but more generic. A WMS image is defined by the coordinates.

L.tileLayer.wms: It provides a simple interface for loading tiles from a WMS service. Here we also need to provide layer name, format of layer and make transparent as true.

var raster = L.tileLayer.wms('http://139.59.42.235:8080/geoserver/portfolio/wms?',{
    layers: 'HYP_HR',
    format: 'image/png',
    transparent: true
}).addTo(map);

In this way we can render raster data and have layer information. This information further can be used for analysis purpose. For example we can have vegetation index (NDVI) from values of bands. We can actually calculate the loss information if having two time series band information.

function showGetFeatureInfo(latlng,layer){
 var prop = layer.features[0].properties;
 var mark=L.marker([latlng.lat,latlng.lng]).addTo(map);
 var blue=prop['BLUE_BAND'];
 var green=prop['GREEN_BAND'];
 var red=prop['RED_BAND'];
 mark.bindPopup("Blue Band: "+blue.toString()+"
 <br>Green Band:"+green.toString()+"
 <br>Red Band:"+red.toString());
 document.querySelector('#demoR').innerHTML=red; document.querySelector('#demoB').innerHTML=blue; document.querySelector('#demoG').innerHTML = green; }

Get Band Information from WMS Geoserver Leafletjs

Check more:

Large GIS Data file on Web

Speed up the rendering of data

Comment below if you found any issue in getting band information in the box provided. Thanks.

GeoServer Tiling – Web Cache Load WMS layer Fast

Here we will find out how to implement GeoServer Tiling to make wms tiles load fast.

Tile Layers from geoserver:

The need of tile layer is to speed up the rendering of data. It is similar to the Layer Preview for GeoWebCache. There are png, jpeg, geotiff many formats available to store the tiles. In all the format png is considered as fastest format to render data with geoserver.

Advantages of GeoServer tiling

Rendering is done by the client (for example, OpenLayers or leaflet), not by the server. This allows different maps/applications to style a map differently without having to reconfigure GeoServer.

The size of a vector tile is usually smaller than an image tile, resulting in faster data transfer and lower bandwidth usage.

GeoWebCache, embedded with GeoServer efficiently stores the vector tile data. Since styling is done by the client, not the server, GeoWebCache only needs to store one tile for all different styles.

Because the vector data is available on the client, very high-resolution maps can be drawn without corresponding increases in bandwidth.
The client has native access to the actual feature information (attributes and geometry), allowing for very sophisticated rendering.

For each layer, GeoServer has some information such as

1. Type: type of layer i.e. line, point or polygon layer
2. Layer name: name of the layer,
3. Disk quota: The maximum amount of disk space that can be used for this layer,
4. Disk used: The current disk space being used by tiles for this particular layer,
5. Enabled: shows whether tile caching is enabled for this layer,
6. Preview: Similar to Layer Preview, this will generate a simple OpenLayers application populated with tiles from one of the available gridset/image format combinations.
7. Action: It has two option seed/truncate or empty. Whereas seed/truncate option opens the GeoWebCache page for automatically seeding and truncating the tile cache and empty option removes all saved tiles from the cache.

Adding GeoServer Tiles

If you have already published your layer on GeoServer, and want it to be in tiles you can follow the procedure given below.

i.) First of all publish your layer with proper name and style. To know how to publish layer on GeoServer you can visit previous articles based on GeoServer.

ii.) Then go to Tile Layer option under Tile Caching. Then search your published layer in list.

iii.) Now you can open that layer as png or jpeg in preview/openLayer option or before that you can seed the layer. Seed layer is nothing but an option where you can decide the zoom level for the layer and hence number of tiles in layer.

While seeding you need to provide the given requirements mentioned below:

a) Number of threads to use:

Possible values are between 1 and 16.

b) Type of operation:

Sets the operation. There are three possible values: Seed (creates tiles, but does not overwrite existing ones), Reseed (like Seed, but overwrites existing tiles) and Truncate (deletes all tiles within the given parameters)

c) SRS (Spatial Reference System):

Specifies the projection to use when creating tiles (default values are EPSG:4326 and EPSG:900913)

d) Format:

Sets the image format of the tiles. Can be application/vnd.google-earth.kml+xml (Google Earth KML), image/gif (GIF), image/jpeg (JPEG), image/png (24 bit PNG), and image/png8 (8 bit PNG)

f) Zoom start:

Sets the minimum zoom level. Lower values indicate map views that are more zoomed out. When seeding, GeoWebCache will only create tiles for those zoom levels inclusive of this value and Zoom stop.

g) Zoom stop:

Sets the maximum zoom level. Higher values indicate map views that are more zoomed in. When seeding, GeoWebCache will only create tiles for those zoom levels inclusive of this value and Zoom start.

h) Bounding box:

(optional) Allows seeding to occur over a specified extent, instead of the full extent of the layer. This is useful if your layer contains data over a large area in GeoServer, but the application will only request tiles from a subset of that area. The four boxes correspond to Xmin, Ymin, Xmax, and Ymax.

iv.) After giving all this, you need to submit these details. After that you will be having a list containing Id, Layer, Status, Type, Estimated number of tiles, Tiles completed, Time elapsed, Time remaining and Tasks. In this list you can check the number of tiles whether it is too high or too low. It should be balanced if it is too high the data size would be high if to low then zooming will not be proper. The number of tiles depends upon zoom start and stop. If difference is very high then number of tiles will be more and vice versa, so it is advised to keep the zoom stop level less than 20.

v.) Before open this layer you should reload the configuration then open it as png and jpeg format under openLayer option.

OUTPUT of GeoServer Tiling-

You must notice that png format would open fast than jpeg format.
The images given below has left side Jpeg format and right side png format. So it is clear that tile in png format render faster than jpeg or any other format.

GeoServer Tiling
GeoServer Tiling

You also can visit Install Geoserver in linux operating system, Install GeoServer in Windows operating system, Publish and style Raster data on GeoServer, Publish and style Vector data etc.

If you find any problem during implementing this tutorial, please let us know. Feel free to comment in given comment box provided below.

Create and Measure Map Polygon Area – Quick Help

Creating Polygons shapes on digitized lands is easy as we already have some tutorial created for creating polygon with leafletjs. But ever wondered what should one do when they need to Create and measure Map Polygon area? The solutions for small challenges like this, which appears to be big for developers who didn’t worked on GIS earlier, is what we are providing here at Engineer Philosophy Web Services.

This case happened when one of the United States based ERP company, which operates in multiple countries, wants to provide a small GIS solution to be intergrated in their existing ERP system to their fertilization and agricultural sector client. As their client need a quick POC (Proof of concept) to digitize their land and calculate area in acres, they need a quick solution to be created. As their team is not expert in GIS and doesnot know which technology to opt for, they approached us around mid-night through our website chat box, as we provide 24/7 assistance with chat at our website. Quickly after talking to us and checked our ability, they turned to our GIS Consultancy Services, which helps them in getting solutions and consultant related to leaflet, geoserver or any other GIS related issues.

The Challenge – Create and Measure Map Polygon Area

Sometimes Mapping and Drawing Shapes can be challenging

Being a large ERP organization which operates with fertilization and agriculture clients to deliver and support its services to end user. Given the immediate nature of on-demand services, they expect instant support and exceptional services from us. This created a colossal consumer service challenge.

  • They needed assistance on setting up basic mapping within their .Net application which will then can be incorporated into the ERP system.
  • They needed tool for measure the polygon shape area that their clients will map on digitized lands from the ERP.
  • The Company also required an add-on, i.e. Geocoding along with maps, which can provide geographical coordinates corresponding to a particular location or address which their client might type in to search their address.

The Solution- Create and Measure Map Polygon Area

There is nothing Like Leaflet.js when it comes to mapping

To address these challenges, we analyzed and documented different solution which we can provide in an next hour. We suggested two best options with all the calculation of pros and cons for them –

The company decided to go with Leaflet.js, as it is open-source which saves them a reasonable amount of capital.

Then we worked on the solutions as follows –

  • Initially we used the Leaflet.js Draw plugin to create and digitized polygon which can be digitized, deleted and edited easily.
  • We also used Turf.js for evaluating the polygon area drawn on the digitized map because it gives more approximate results then the Leaflet.js Draw plugin.
  • When the company decided to go with the open source software, we again provided them with two options in their best interest i.e. MapQuest API and MapBox API for Geocoding purpose.

Final Result : Create and Measure Map Polygon Area
Geocoding : Create and Measure Map Polygon Area

Once we are done with coding part in next 3 hours, we showed the solution to the organisation. Get the feedback corrected some User Interface stuff and provided code to their developers. In an 1 hour we helped them to understand the code and integrate the same with their system.

The Result – Create and Measure Map Polygon Area

We are best in Overcoming challenges and providing the Best GIS Consultancy

We provided solutions for every concern related to map and gis challenges to the ERP company developers.

Final Result : Create and Measure Map Polygon Area

  • Provided hands-on assistance in setting up basic mapping within their .Net application which will then can be incorporated into the ERP system.
  • Consultancy and hands-on assistance with evaluating polygon area on digitized lands with Leaflet.js and the same saved polygon should be reopened and edited from the system.
  • Provided wonderful tool for Geocoding along with the maps and assistance on implementing it.

We here at Engineering Philosophy Web Services provides Services and Consultancy related to Leaflet.js, Geoserver, Geocoding, Web/App development and Other GIS tech factors.

Fleet Management System – Requirement | Features | Cost

This blog post describes a detailed overview of fleet management system – Requirement, Time, Technology and functionality. All features of Fleet Management Systems are going to be provided in this post in details.

Fleet Management System:

Fleet Management System is the range of functions which allows transportation companies in business to minimize the risk related with the improving efficiency, proven return on investment, productivity in business and reducing the overall cost.
It is a modular based system that has been developed for the group of transportation or large companies using fleets/vehicles with the sole intention of operating the business in a timely manner and reliable way.
Fleet management includes a range of functions like tracking valuable assets; automate the fleet reports, Management of vehicles and security & control of the fleet.
We provide simple and versatile fleet management system which is backed up by mobile access and live support. We emancipate your fleet with the sharpest technology, outstanding features and 24 hr access.
Now you can have more time to achieve your destination then less time to worry about the fleet operations and route.

Requirement Gathering:

  • What do client requires?

    We have an absolute idea of our client’s needs for the Fleet Management System in their business, so here is a list of some main requirements we think that every client would want in their Fleet management system.

    • Reduce fleet management time and cost
    • Integrate fleet planning and execution
    • Real time tracking of fleet which includes vehicle tracking, driver detail and asset details.
    • Fleet scheduling management for on-time deliveries and customer service.
    • Automation of fleet reports.
    • Management of fleet/vehicle Maintenance
    • Fleet utilization management
    • All time fleet monitoring
    • Route tracking
    • Expense tracking
    • Fleet analytics
  • Hardware requirements:

    Implementation of fleet management system would require hardware entities for Real time tracking of fleets and driver, which can be listed as:

    • Mobile Phones (iOS/Android/Windows): Any Mobile phone with the driver with GPS enabled in it can be used for the real time tracking of the vehicle and the driver. This provides you the location access to any of the mobile or immobile fleet.
    • GPS Device: Live GPS tracking devices are ideal for most vehicle tracking needs. With live GPS tracking systems in the fleet, you can have access to real-time data about vehicle location, use, driving speed and etc. This can be used to track driving habits, route vehicles more effectively, keep tabs on equipment that is at high risk of theft, and improve your dispatch processes.
      You can use both of these for the combine and separate tracking of the fleet and the driver.
  •  Software requirements:

    These are some software requirements for the implementation of the fleet management system:

    • Server: We can use any server for this management system but we prefer these two servers to be precise that we will be working on:
      1. NGINX Server – Nginx is an open source web server which can handle a website with a huge amount of traffic. It is a high performance web server developed with an intention to handle websites with large number of users. Its speciality is that it can run on a minimal amount of resources and handle a large number of requests.
      2. Digital Ocean Server – Digital ocean server or ‘droplets’ is a cloud server which is designed to store and server massive amount of data while making it easy and cost effective. Digital ocean server use KVM as hyperviser and can be created in various sizes. It helps in build deploy and scale cloud application faster and more efficient

      We personally recommend to use Digital Ocean Server, as it is much faster, easy and cost efficient.

    • Socket connection: One of the main software components of the Fleet management system is socket communication server. It is a central server component that communicates with the tracking units. Socket connection is capable of communicating with multiple clients units using multiple threads as it establishes TCP/IP socket connection with the remote hardware units. When the fleet GPS is connected, the server will authenticate the connection and proceed to receive information from the device.
    • RabbitMQ: RabbitMQ is the most used open source message broker software. It originally implemented the Advance message Queuing Protocol, which we will be using in this system. If we add single entries from server multiple times in database it will lock itself. So for preventing that from happening we will use RabbitMQ, which stores a information until a receiving server connects and takes a message off the queue. The receiving server then processes the information in an appropriate manner. So we can insert bulk information in the database in particular time as we want.
    • Database: We will be using any of these two databases for storing the data we collected from the tracking devices of the fleet:
      1. PostGIS/PostGreSQL
      2. MySQL
    • Mapping Systems: This is the main software component of the Fleet management system. This whole system is dependent on the web mapping of the data or information that the GPS devices provide. For mapping the data we can use any of these two Mapping systems.
      1. Google Maps: Google Maps is the tool which is used to display geographical information on a map which is in a widely accepted standard format for digital maps.
      2. OSM (Open Street Map): OSM is the software that creates and distributes the open source graphic data of the world. OSM has no restriction of technical or legal type. It allows free access to its map images and underlying map data. Here we can show our tracking data in real time.

    Features:

    •  Managing vehicles:

      We will provide you all the information regarding the fleet/vehicles in the web portal’s dashboard like vehicles insurances details, vehicle renewable reminders and Maintenance/service reminders for vehicles etc. Our system provides automated reports for every penny you spent on the vehicle and each expense you are going to do in meantime. We provide vehicle orders bar where you can manage orders and get previous order details.

    • GPS Tracking:

      The tracking unit collects the location information with the help of the GPS (Global Positioning System) device which we used in our system as hardware. Global Positioning System can be used for providing the route to the fleet. GPS formats collected information into the system–specific packet format and sends it to server via socket connection server. Global Positioning System tracking system uses the Global Navigation Satellite System (GNSS) network. This network incorporates a range of satellites that use microwave signals that are transmitted to GPS devices to give information on location, vehicle speed, time and direction by which we can manage Real time tracking of fleet which includes vehicle tracking, driver detail and asset details and Fleet scheduling management for on-time deliveries and customer services.

    • Speed tracking:

      Driving with excessive speed is one of the main factors in fatal road accidents. Driving at a safe speed can help save lives. Fleet managers have an interest in keeping their drivers on the road and out of the troubles, and they also want to ensure that their fleet is operating in an efficient and timely manner. Speed tracking and reporting is a principal feature in Fleet Management System. In terms of reporting, our systems will report all offences to base in real time (even have the capacity to set an SMS alert).

    • Geofence:

      Geofence is described as the circular areas which are defined around a particular location. It is set by the client in Fleet Management system by able to define the radius of the area. The GPS location of the center of the circle and the radius define a Geo-fence. If a vehicles GPS location is within the Geofence, then they are in safe area and if any vehicle go outside the area of geofence the client is notified by a text or email alert and the event is recorded.
      geofence- fleet management system

    • Automate the fleet report:

      We surely provide the automated report on each transaction or order. We provide automated report of the previous orders of fleet which you can check any time or download the file.

    Cost:

    Contact us at our mail or put a comment below to discuss the expected cost.