In this guide, we’ll walk you through how to efficiently convert your GML files to MAPINFO using the powerful Converter Tool in MAPOG Map Analysis. Whether you’re a beginner or an experienced user, Converting GML to MAPINFO with MAPOG, this tutorial will help you understand the process in easy steps.
Key Concept to Converting files
The Converter Tool is a feature in MAPOG Map Analysis that helps you change your data from one format to another. It’s like magic! You give it your data in one form, and it transforms it into another form that you need for your analysis. Additionally, with GIS Data, you can download data in any format, making it versatile and adaptable for various applications.
Converting GML to MAPINFO
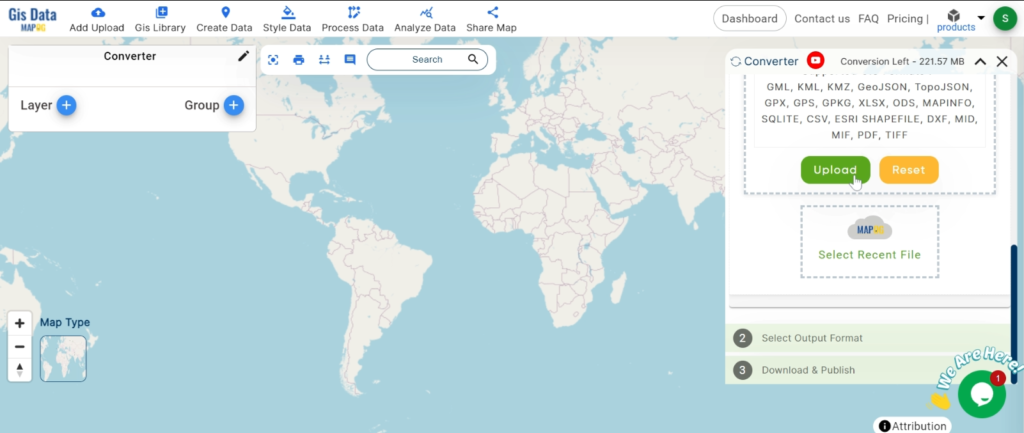
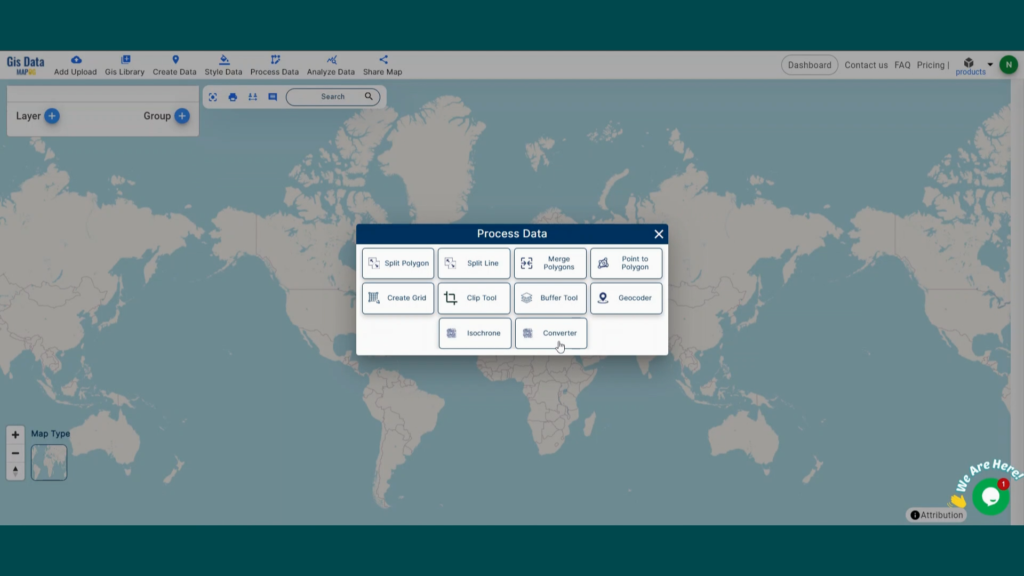
Step 1: Upload the Data
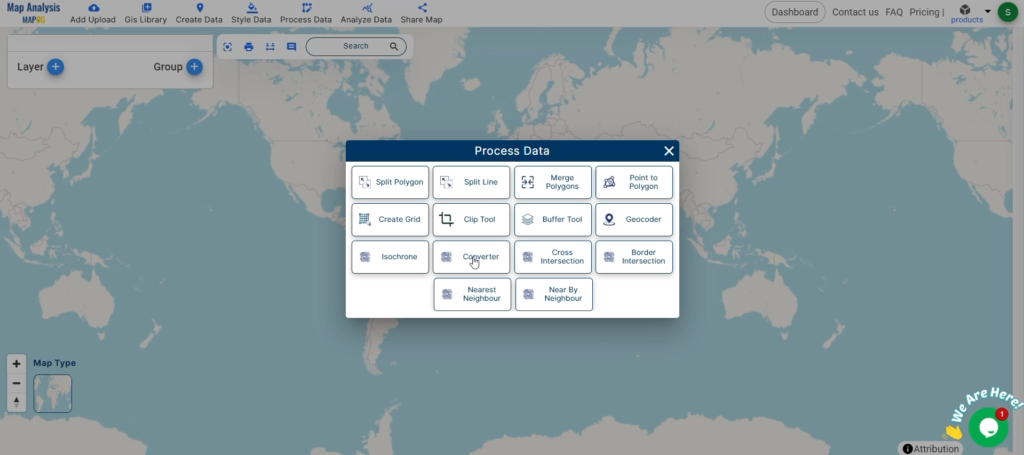
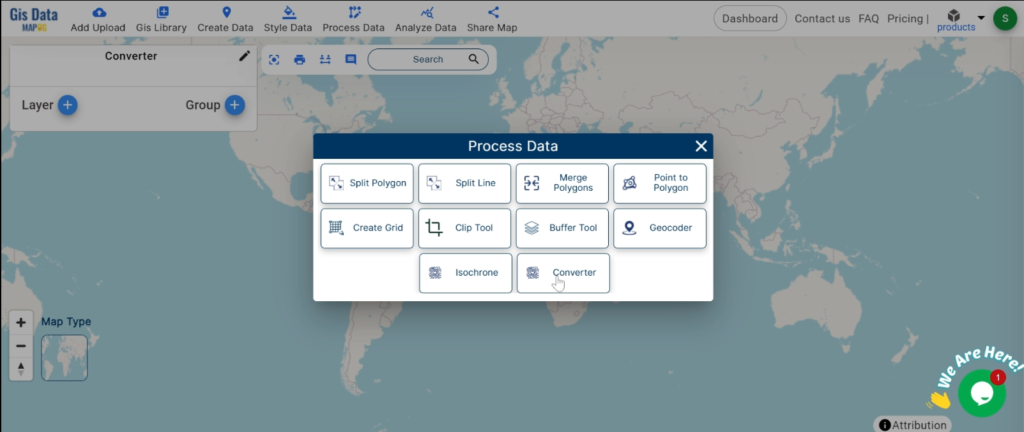
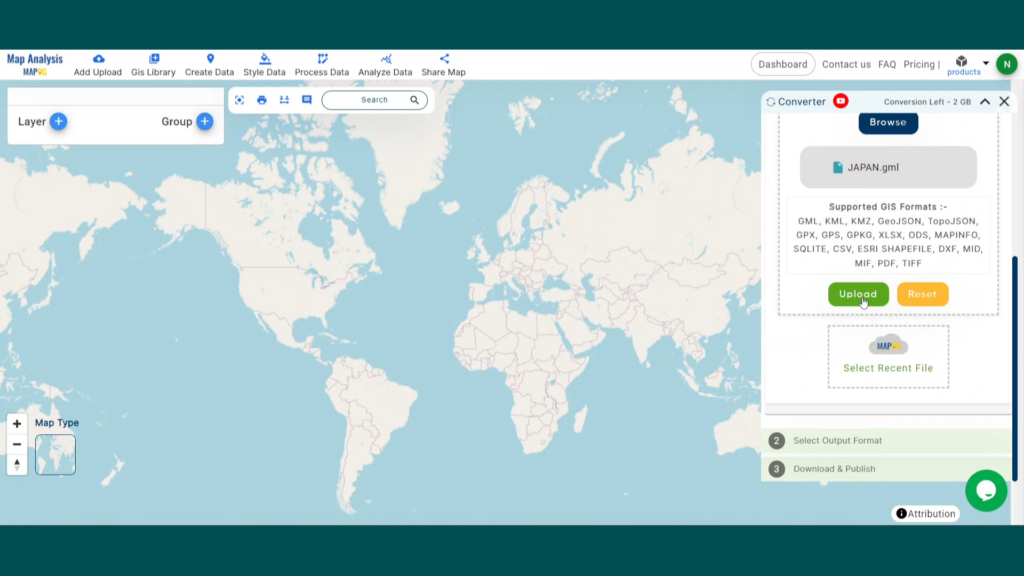
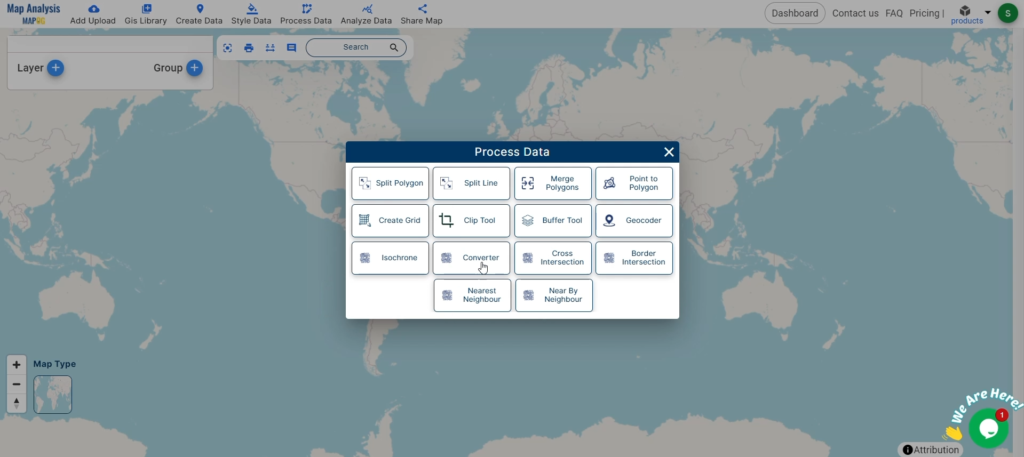
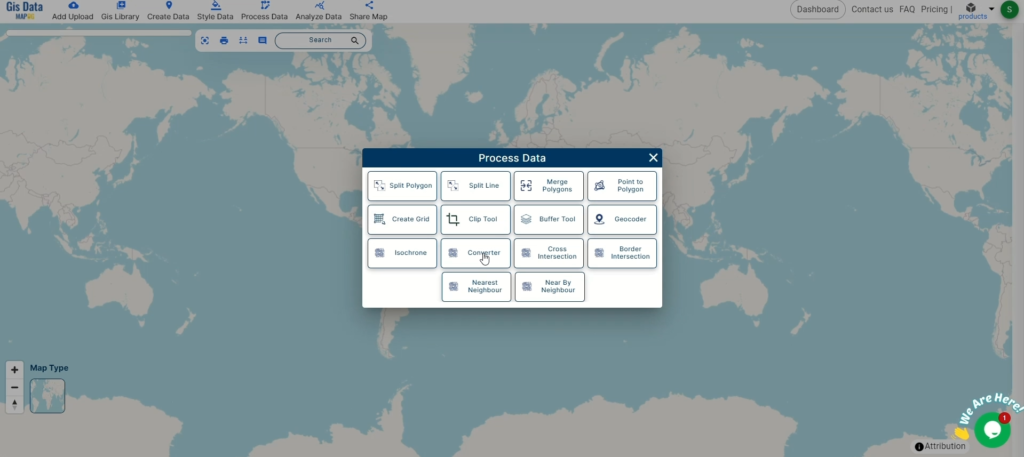
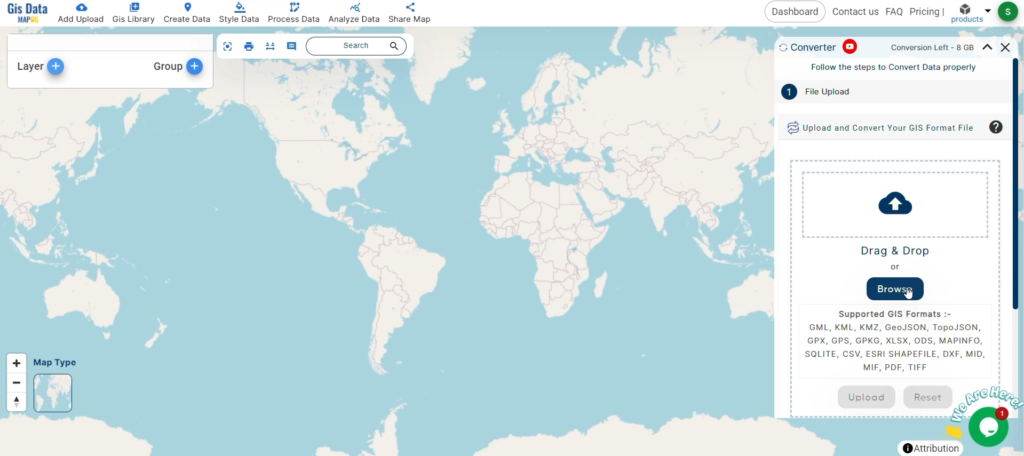
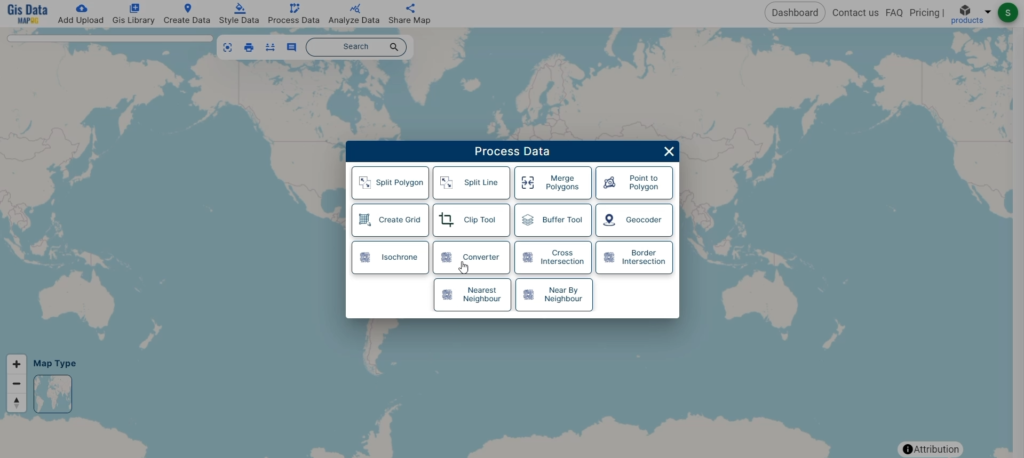
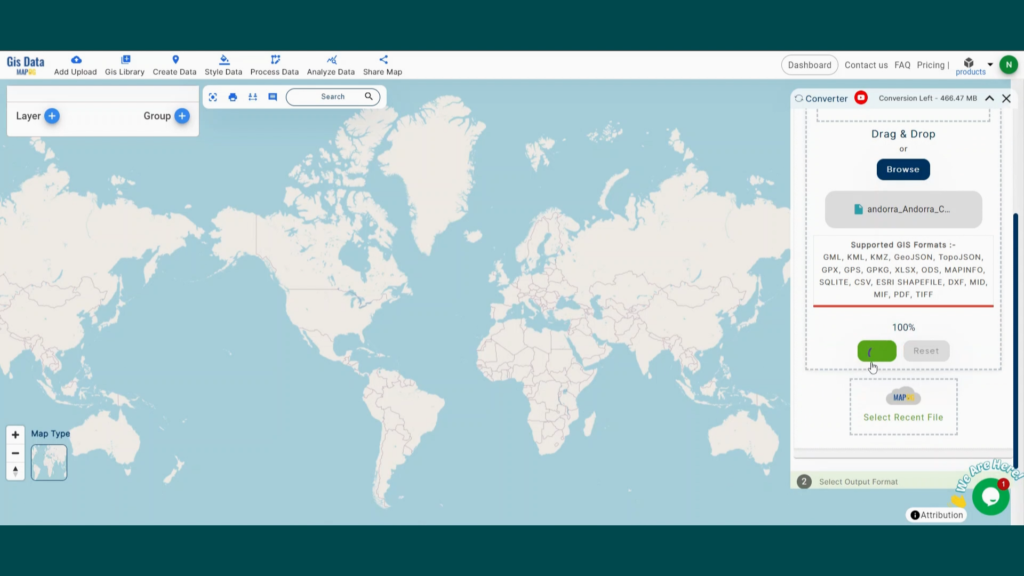
1. Click on the “Process Data” menu and choose the “Converter Tool” option.
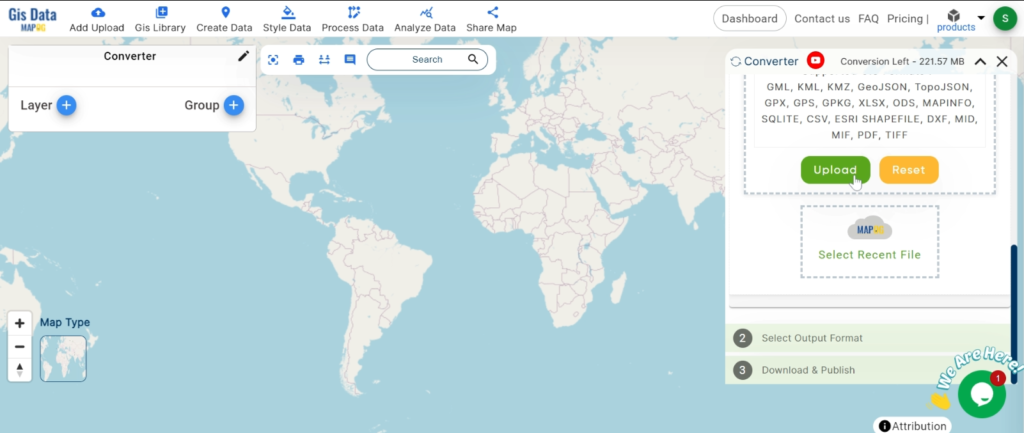
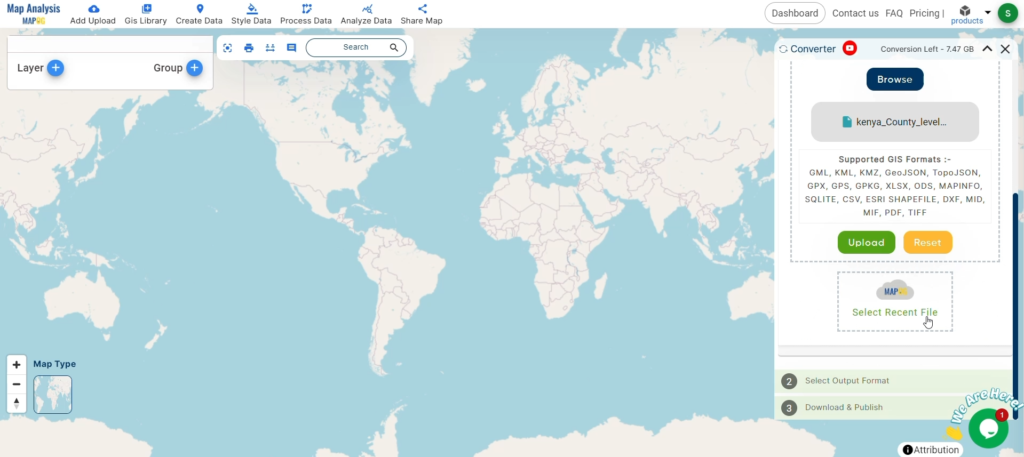
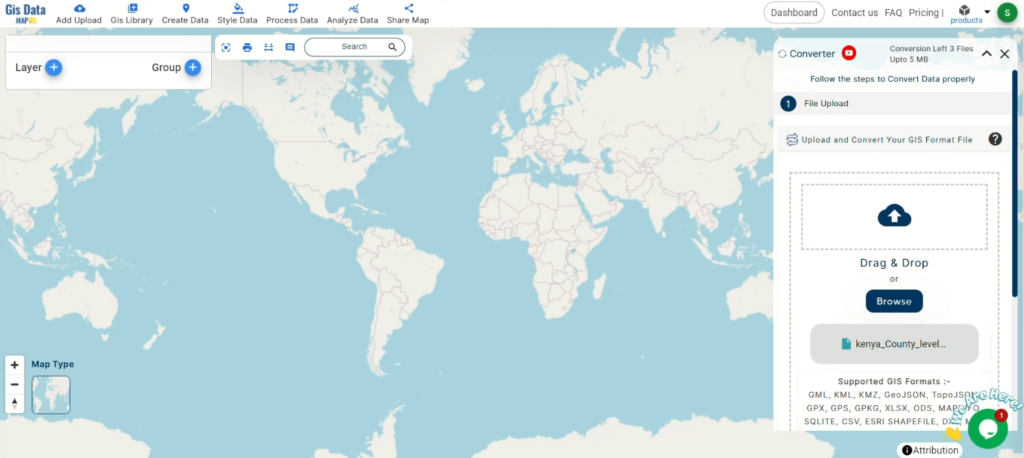
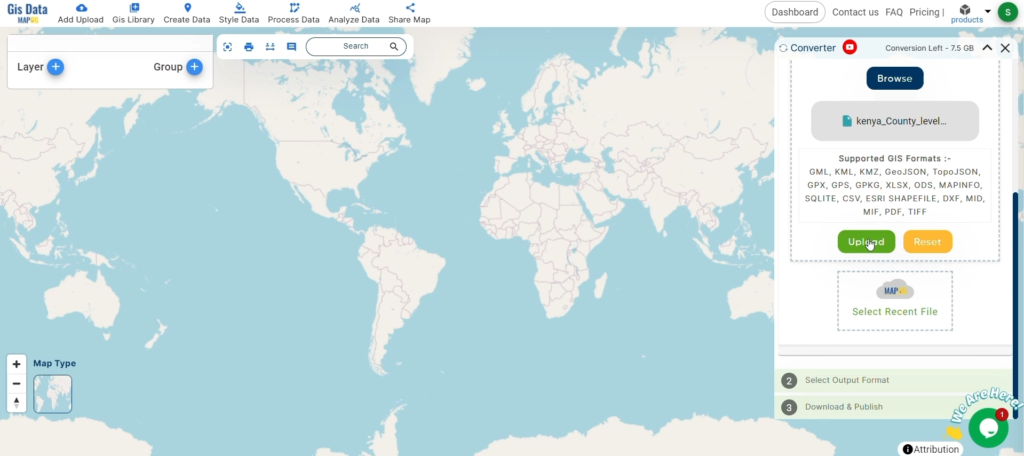
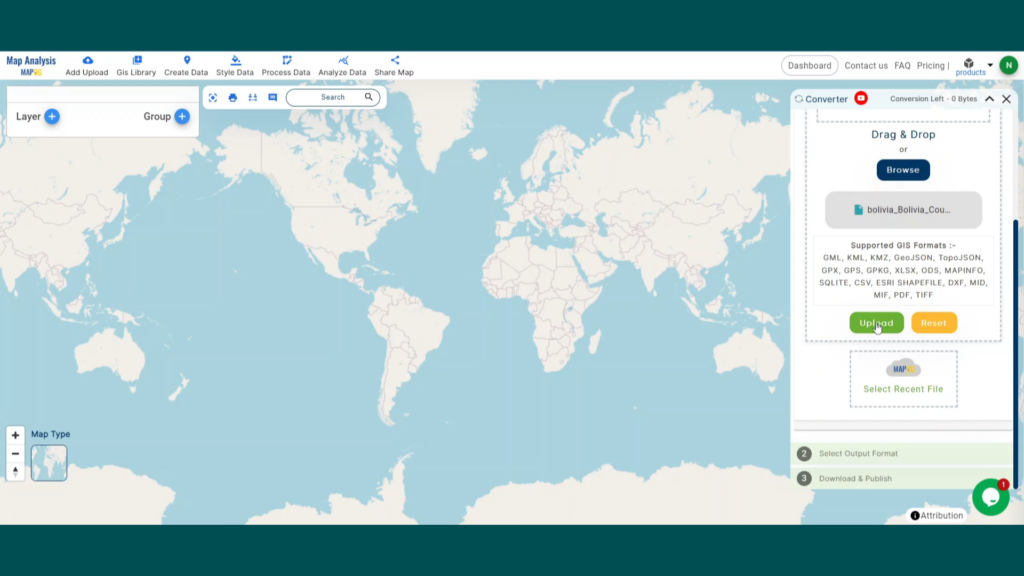
2. Upload your GML file. This is your starting point where you provide the data that needs conversion.
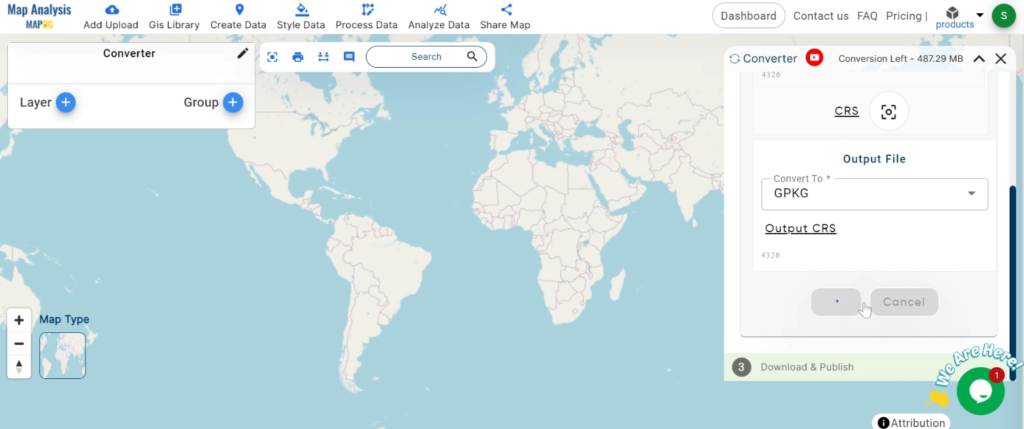
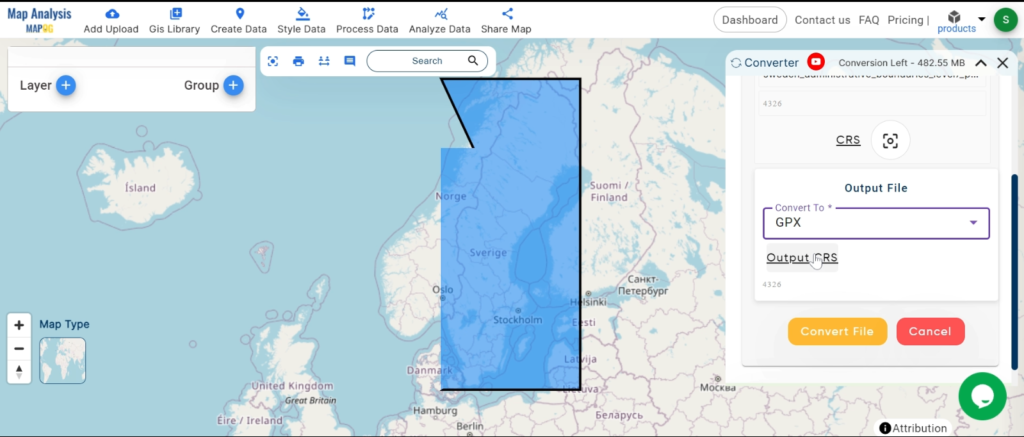
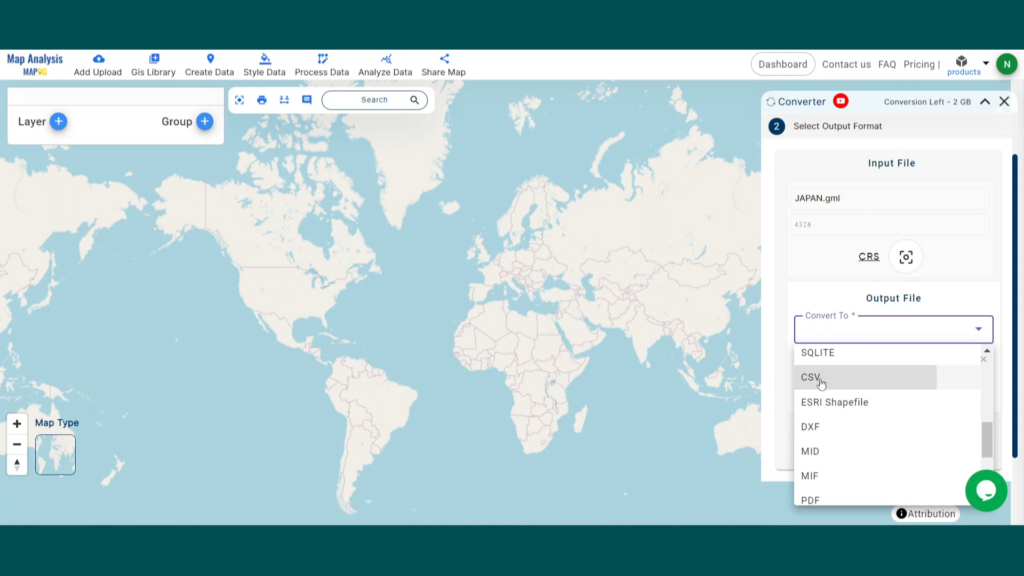
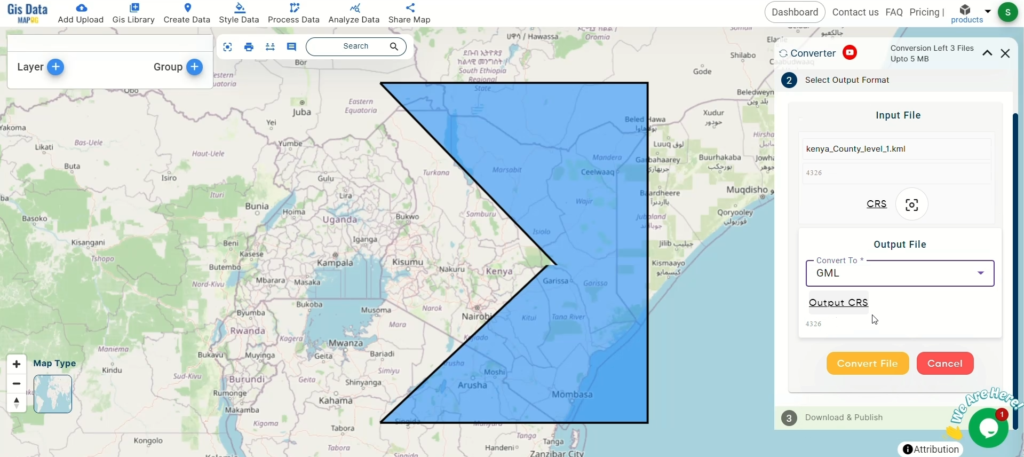
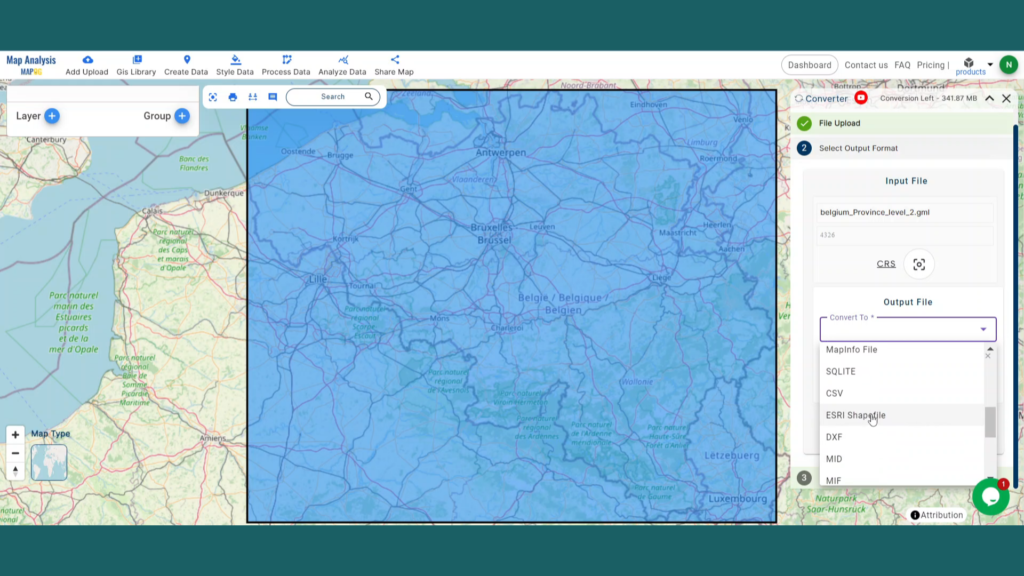
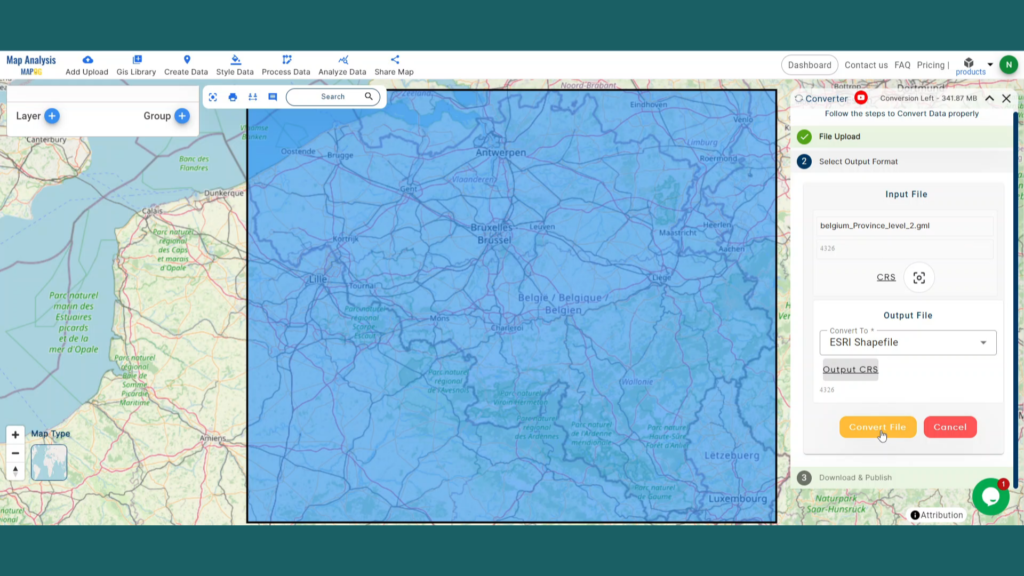
Step 2: Select the Format for Conversion
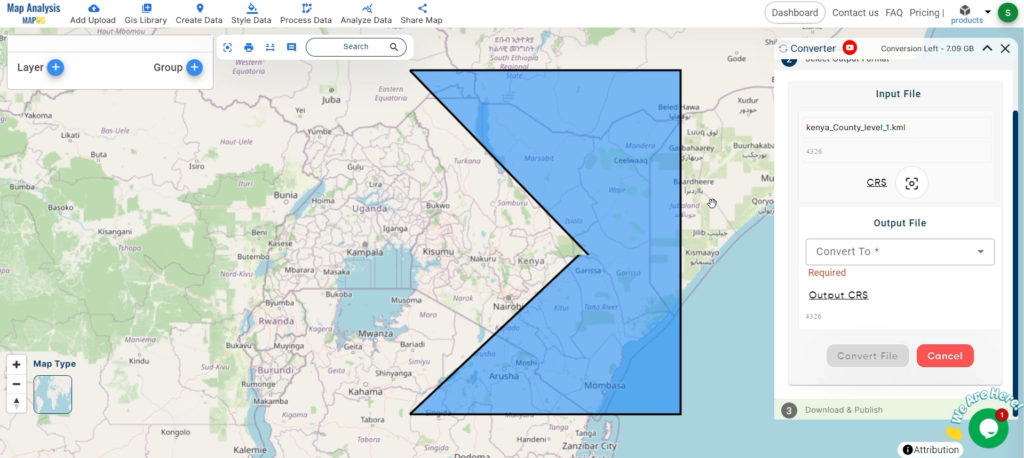
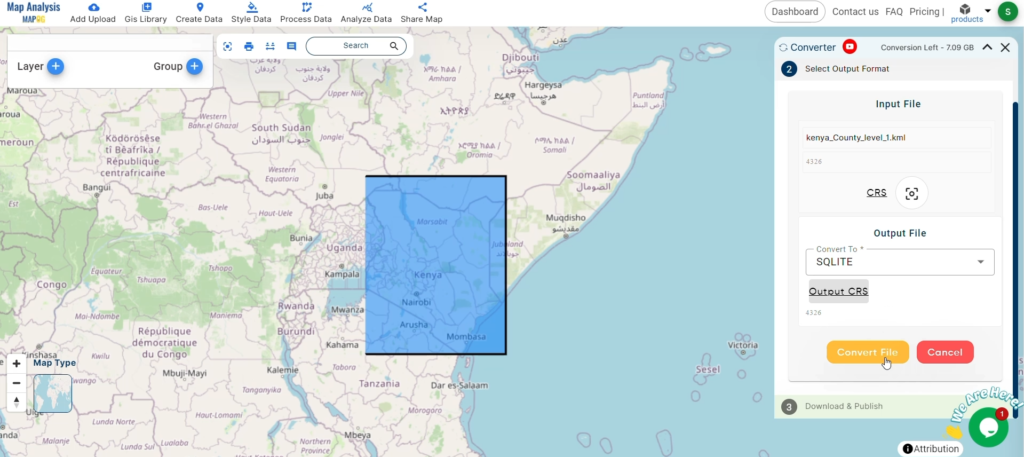
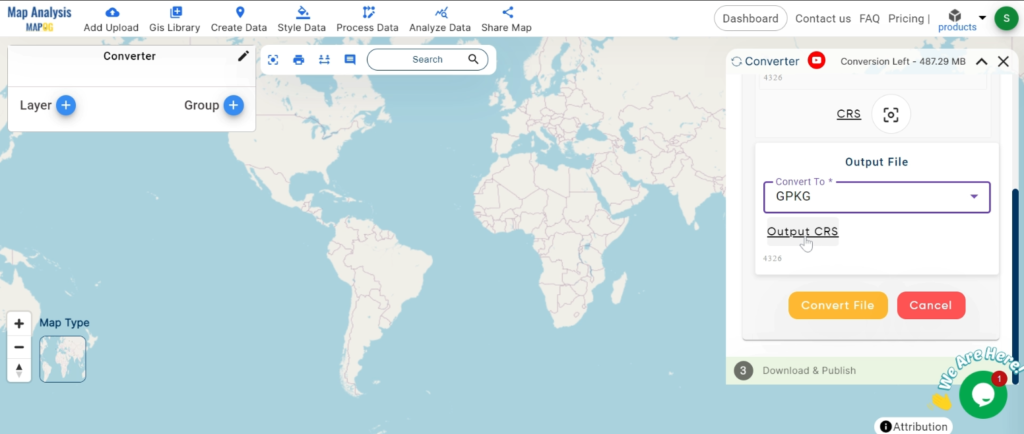
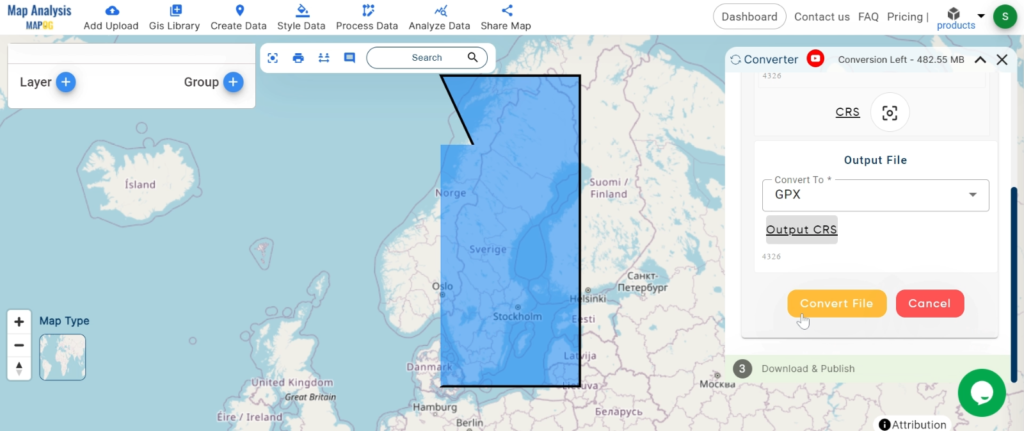
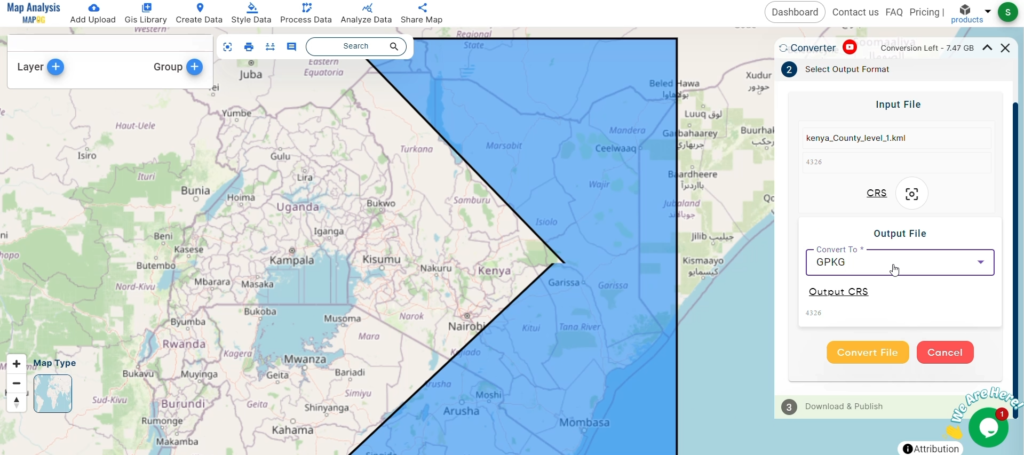
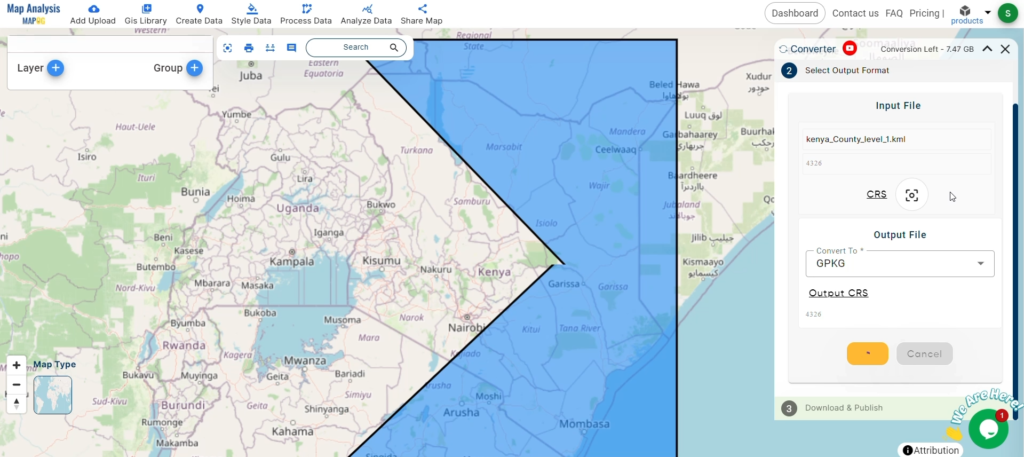
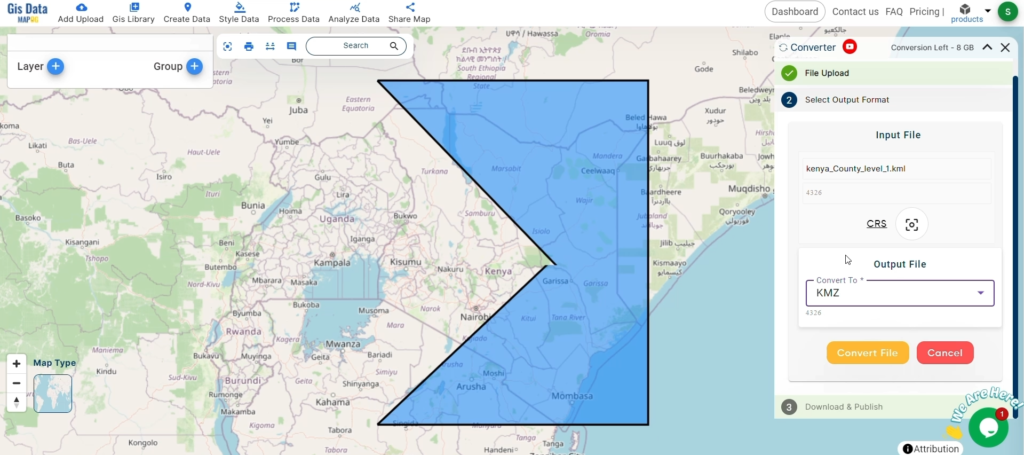
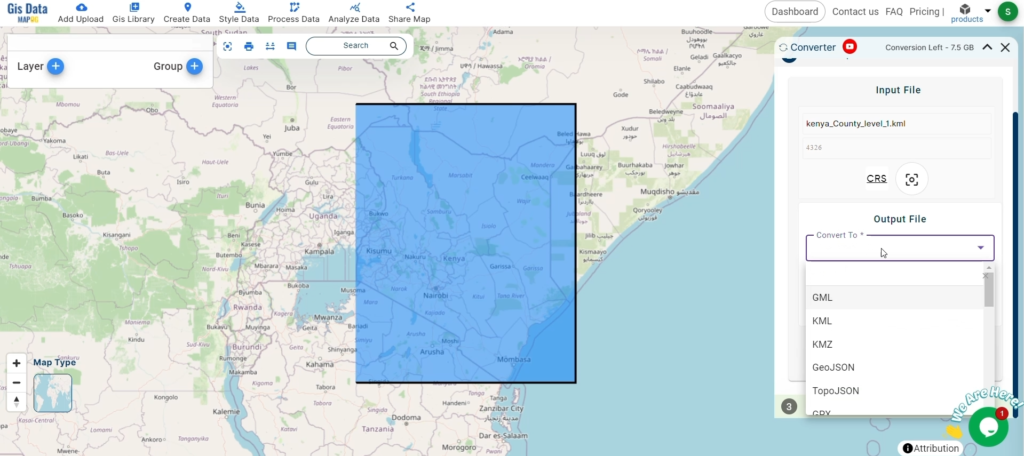
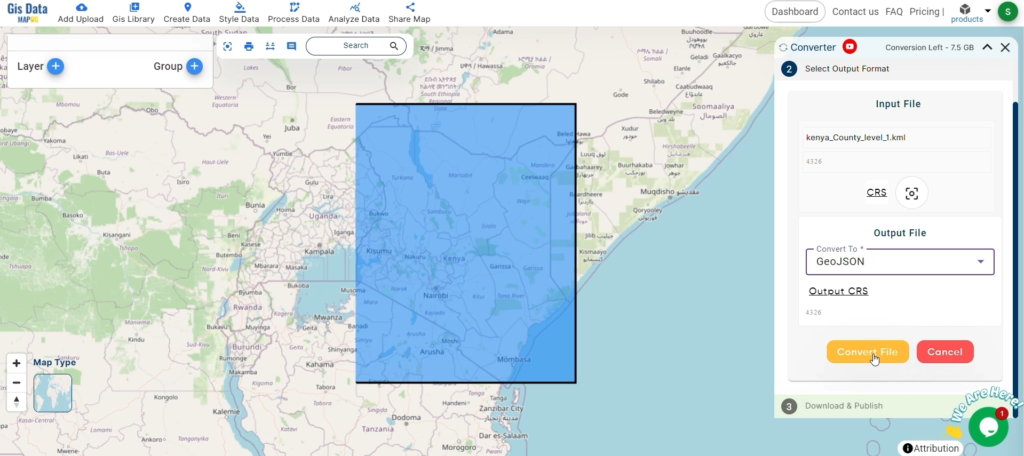
1. Choose the output file format as MAPINFO. The tool offers various formats, but for this guide, we are focusing on converting to MAPINFO.
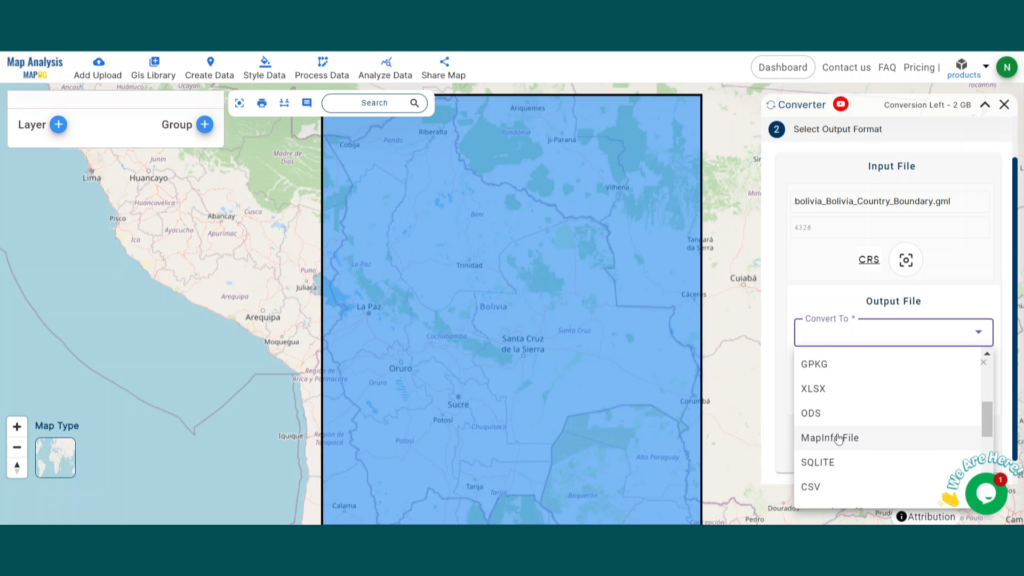
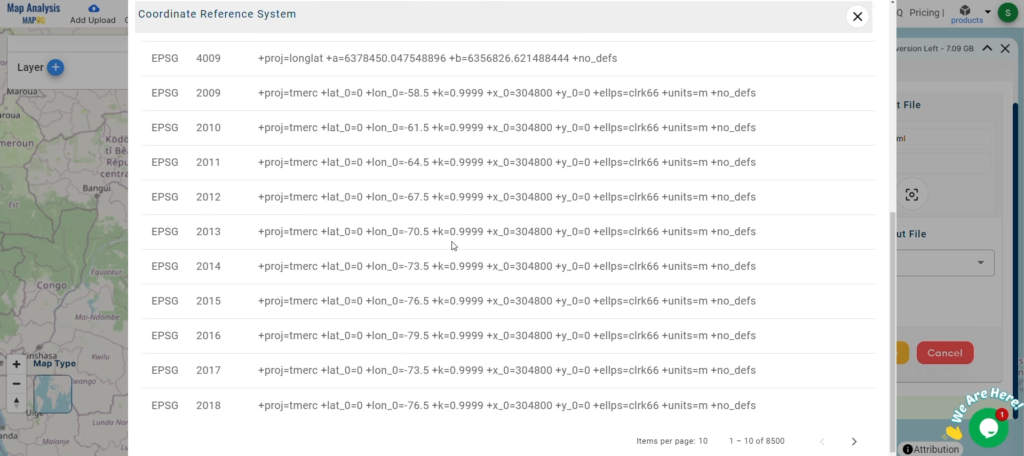
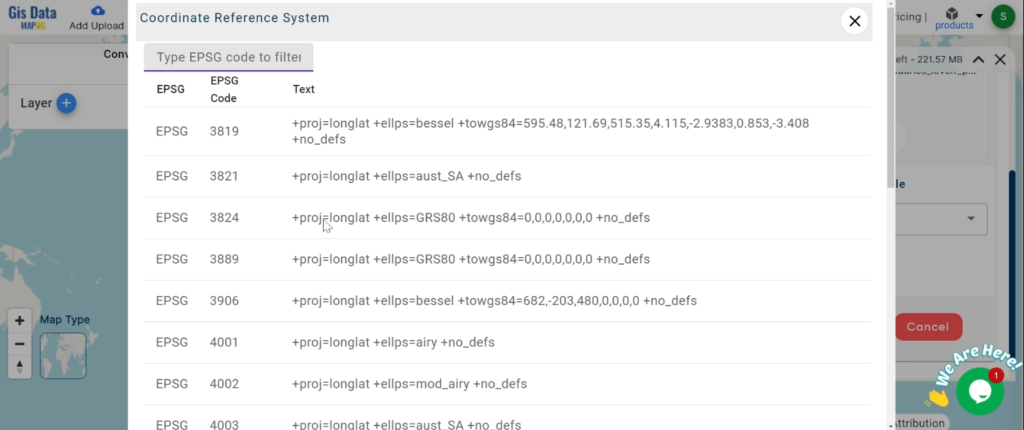
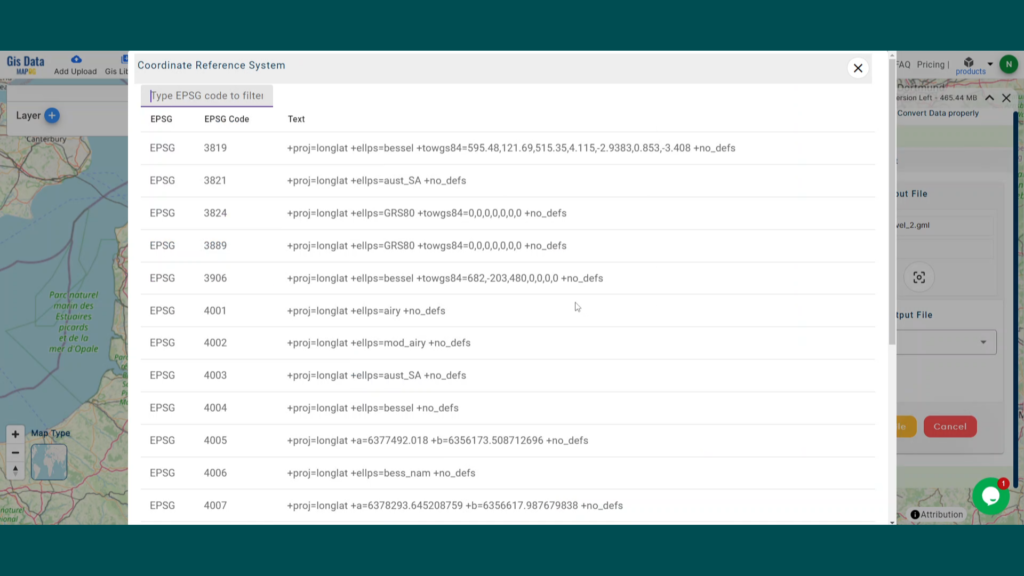
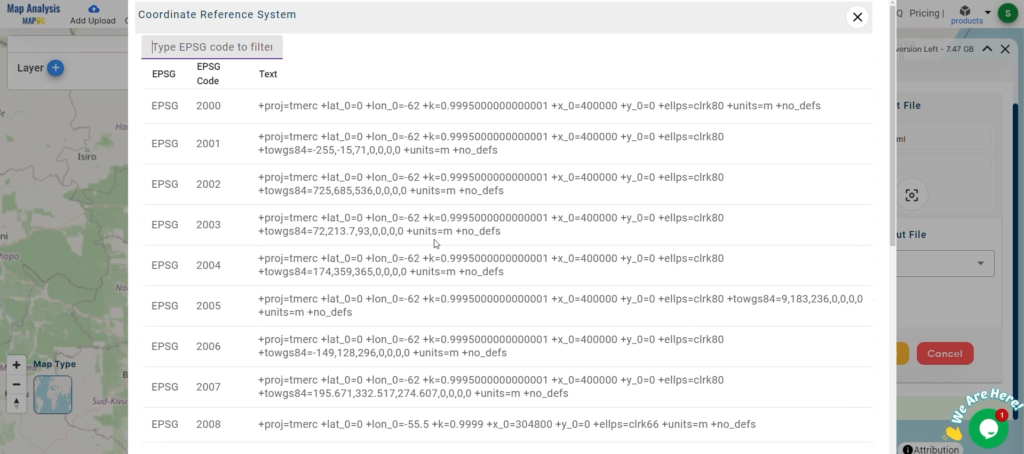
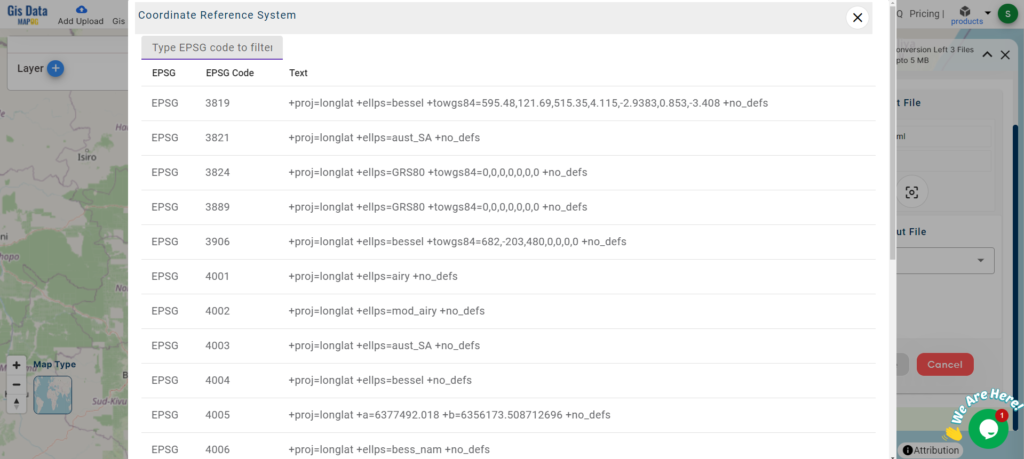
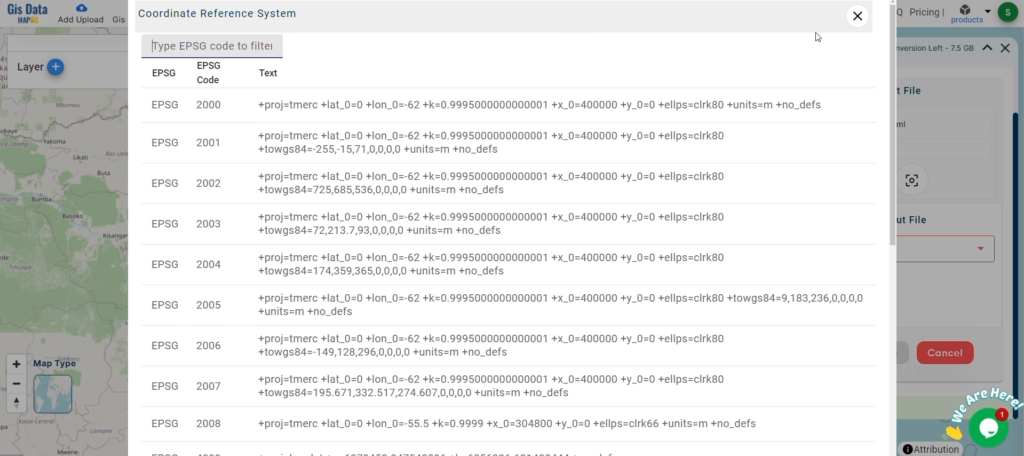
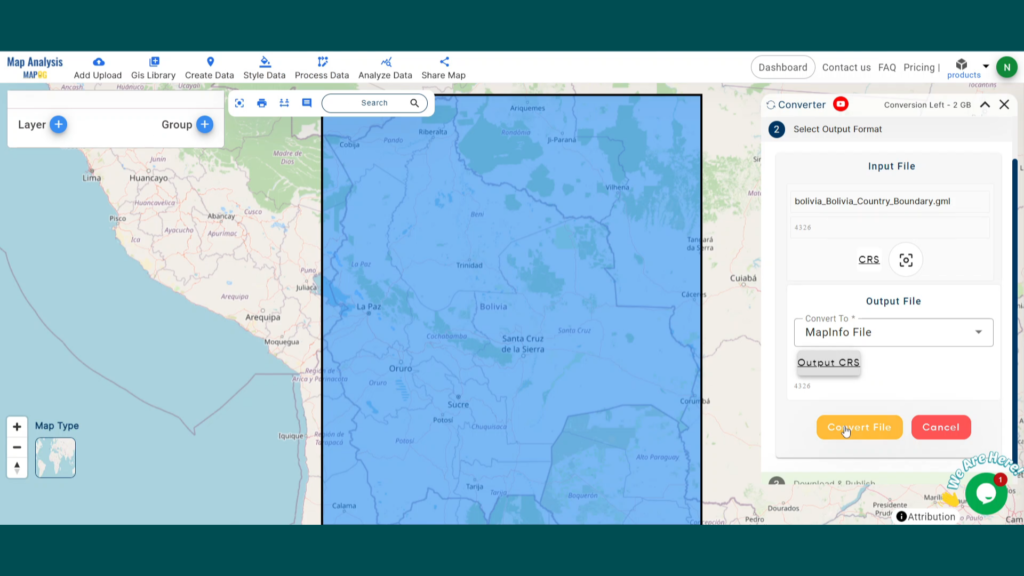
2.You can also set the CRS at this stage.

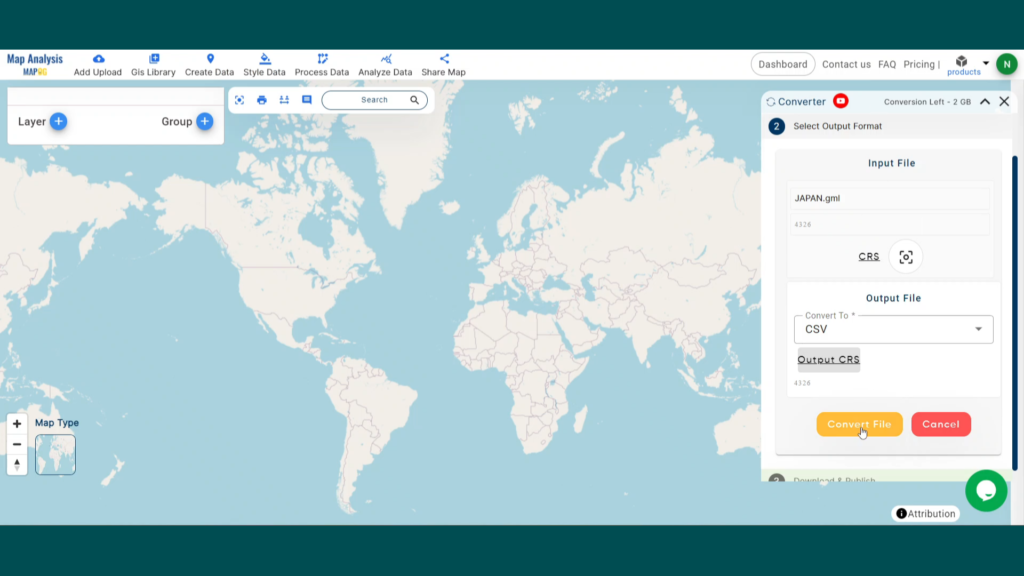
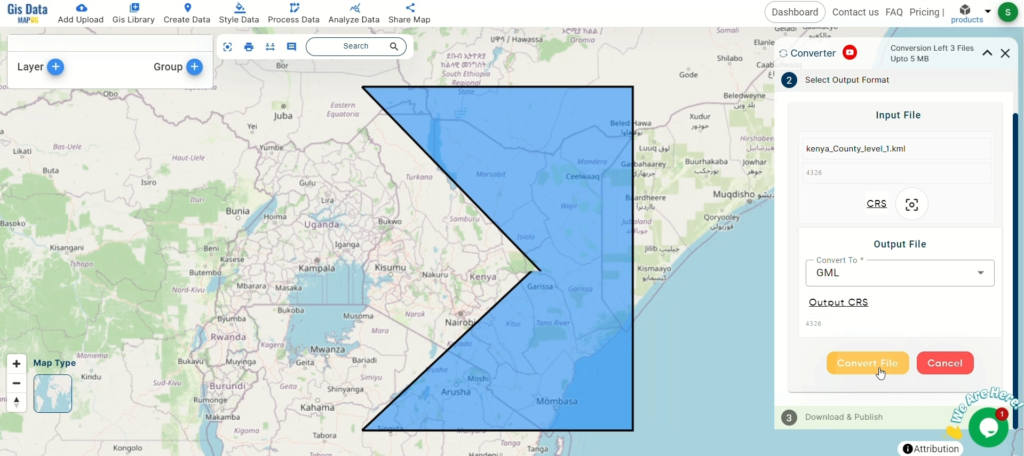
Step 3: Run the Conversion
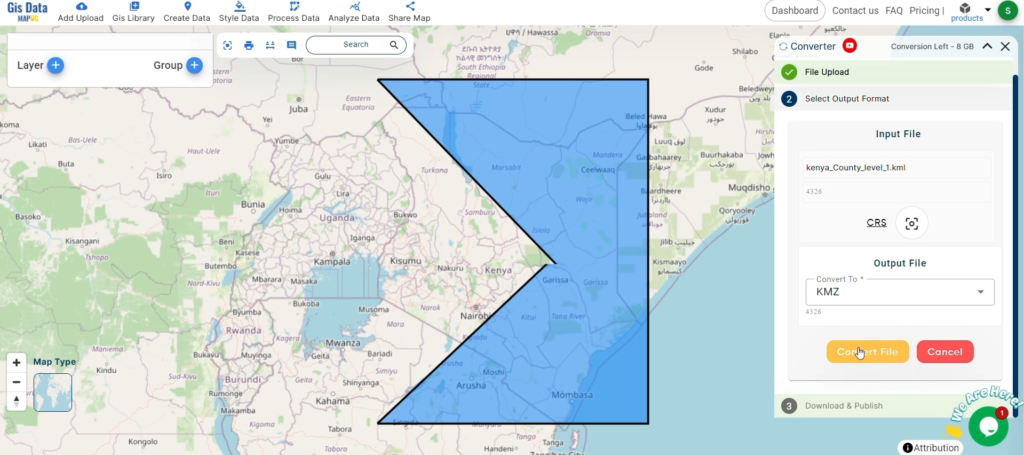
Click ‘Convert’ and let the tool work its magic. The Converter Tool processes your data, transforming it from GML to MAPINFO format.
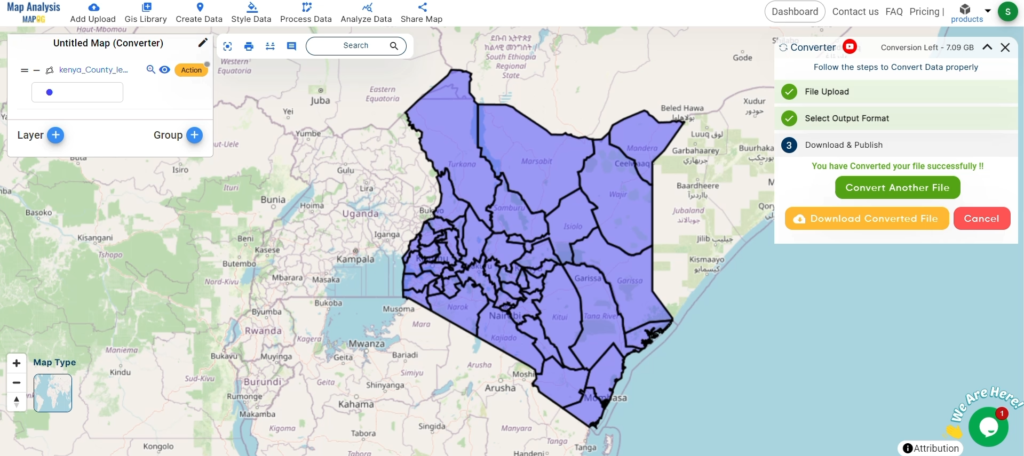
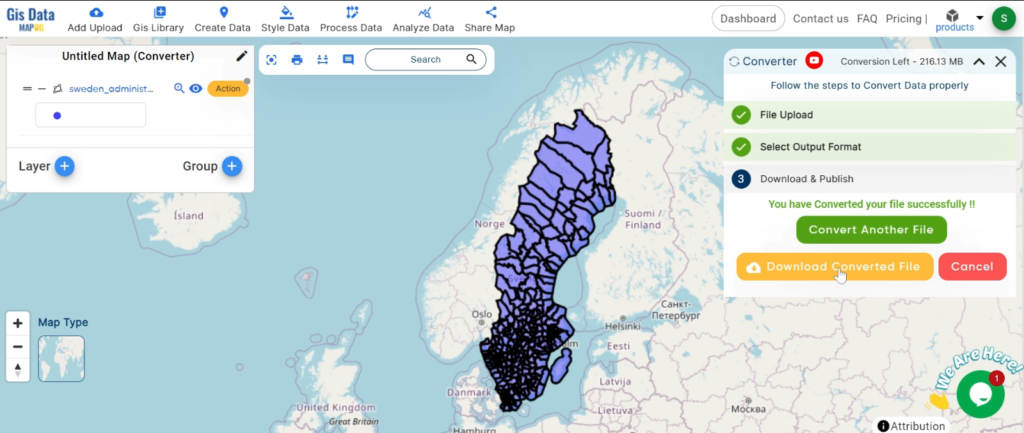
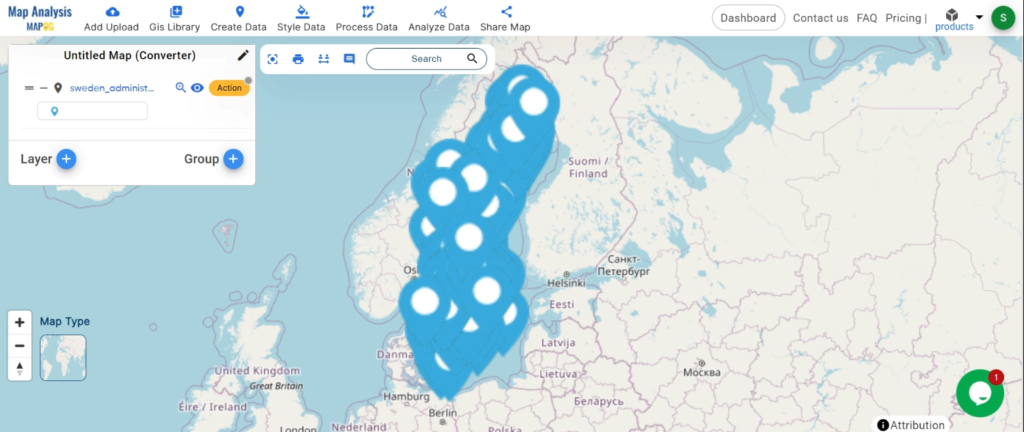
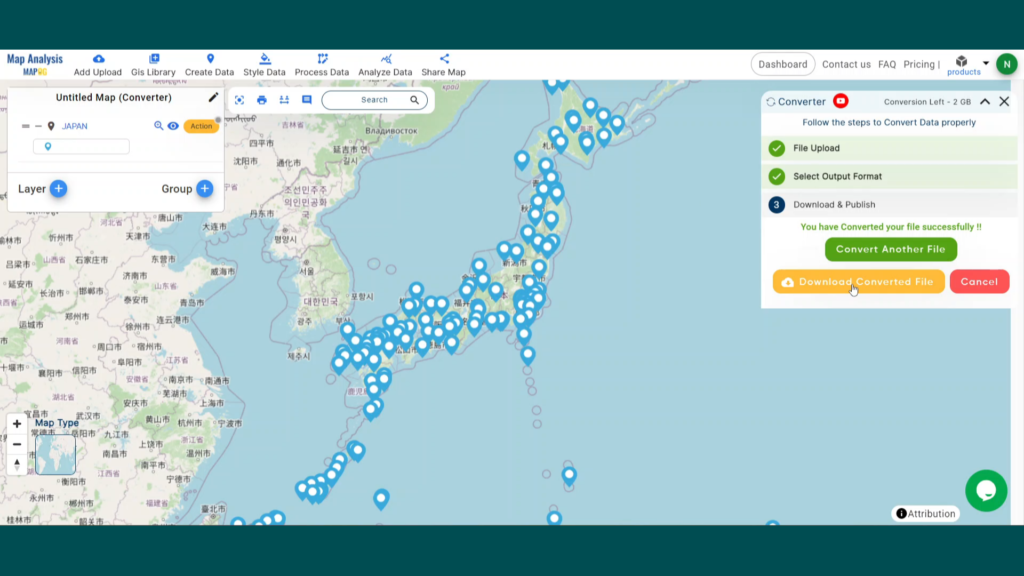
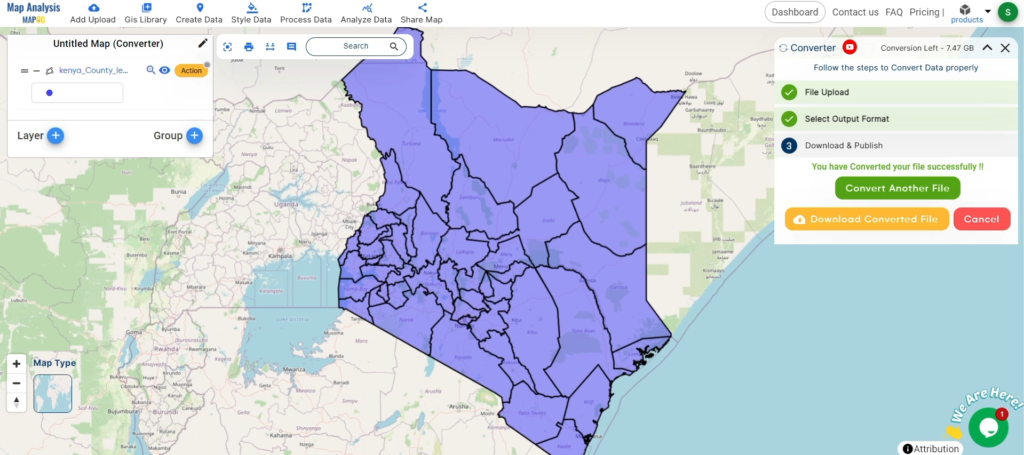
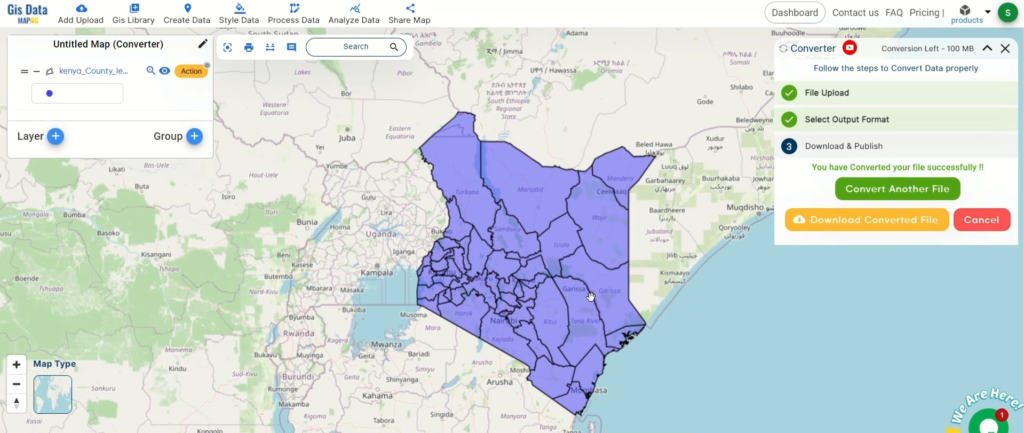
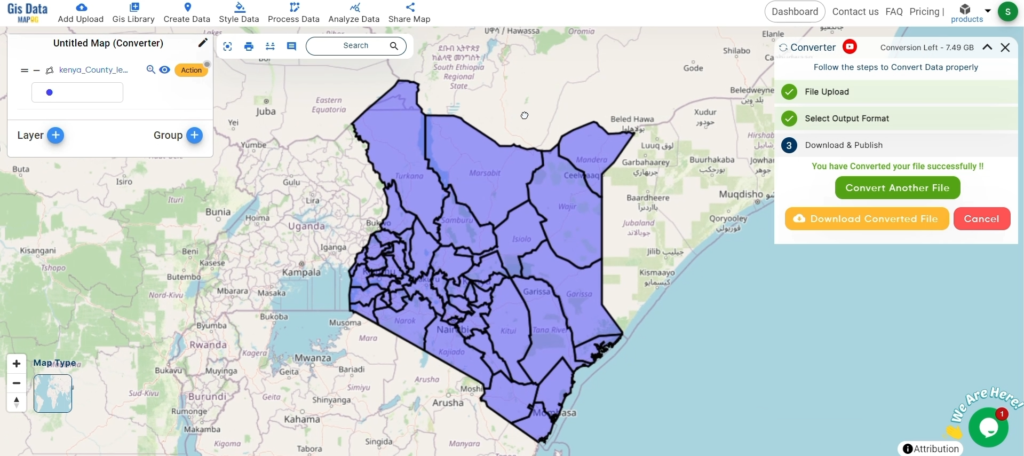
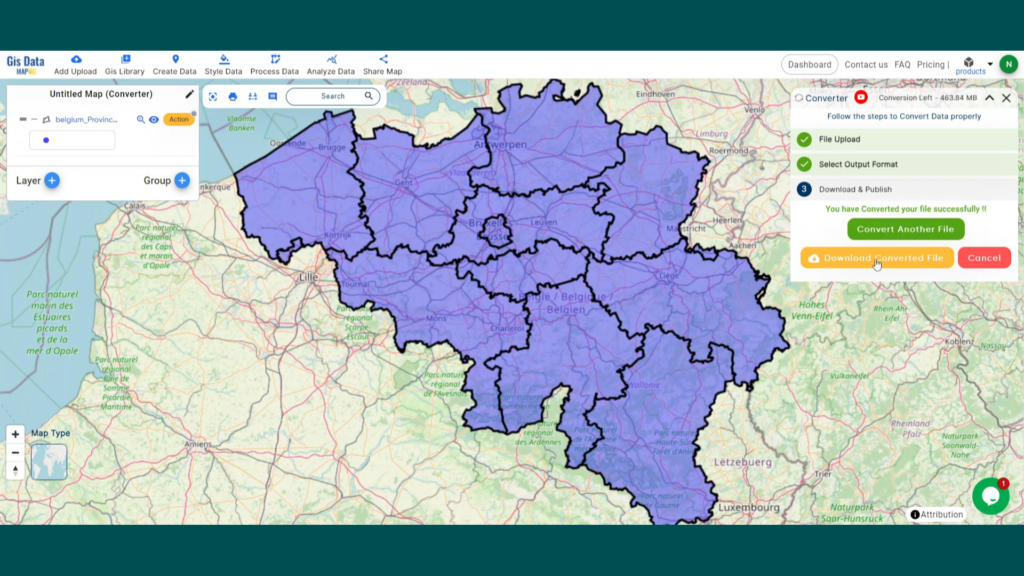
Step 4: Review and Download
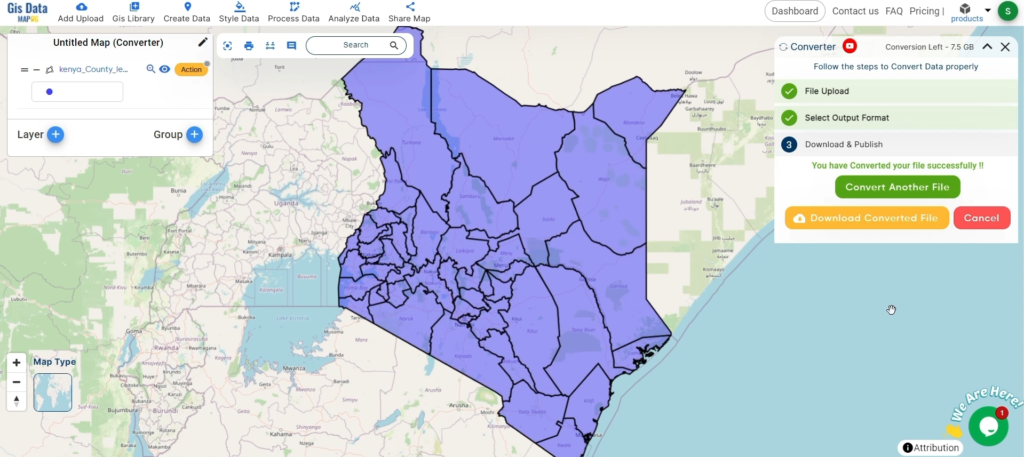
Finally, review your converted MAPINFO data to ensure it looks right. Once satisfied, download the converted file. This step is crucial to verify that the conversion has been successful and the data integrity is maintained.
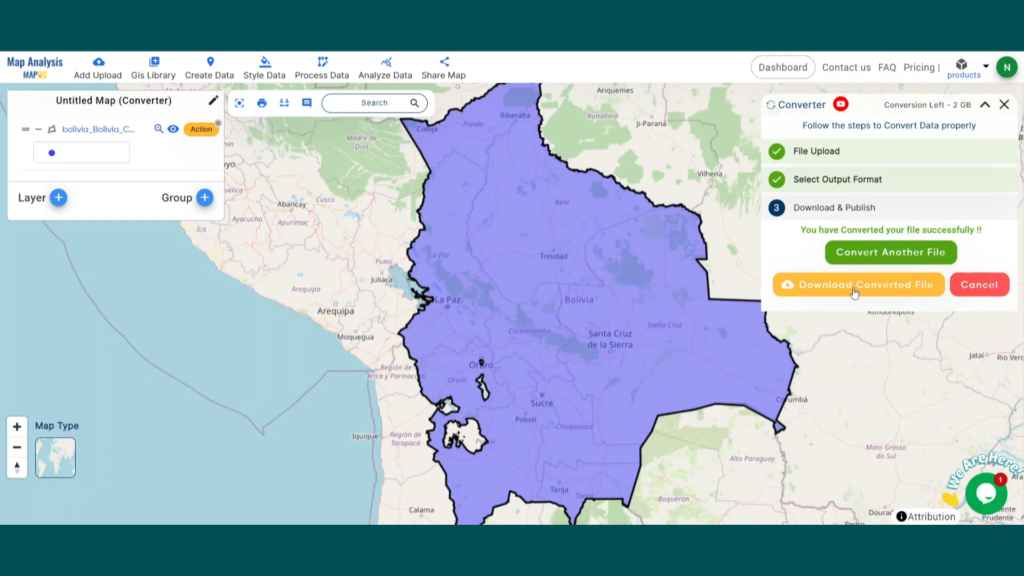
And there you have it! You’ve successfully used the Converter Tool in MAPOG Map Analysis to convert your GML Files to MAPINFO. Now you can easily convert your data for all your analysis needs. This feature simplifies the process of handling different data formats, making your workflow more efficient and effective.