Blog

How to create Bubble Map for point GIS data

GIS helps users to understand patterns, relationships and geographic context. It’s benefits includes improved communication and efficiency that helps in improved management and decision-making. GIS combines datasets with maps, integrated regional datasets with any type of descriptive information or data. It provides mapping and assessment prerequisites for technology and almost every industry.

Visualization and intepretaion methods makes GIS an interesting fields in data analytics. Science of visualization is the core essence in the art of cartography and mapping. Any type of geospatial features presented in the map with proper color combination, accurate size and location helps in better image interpretation. Common visualization methods used in GIS are Quantity and Category stylings.

IGISMap Styling Tools

IGISMap is a web platform providing multiple GIS applications that are most important in the field of geospatial analytics. The peculiarity of IGISMap in the GIS Industry is its UI/UX that helps the user to perform effortless geospatial operations. IGISMap provides the following styling tools:

In IGISMap, Bubble Style and Icon Style are the styling tools for point GIS data, whereas Basic, Category and Quantity styling tools can be applied on polygon and polyline GIS data. Bubble Style visualizes point GIS data quantitatively, while Icon Style will provide proper icons for the points based on the property. Icon Style also has the option to style the points categorically by assigning separate icon for each categories.

In this article, we will talk about how to quantitatively represent point GIS data using Bubble Style tool of IGISMap. We will walk through each steps to create a map like the following.

Population Diversity in USA States

Check the following article to know how to style the pins based on categories.

Uploading the data

For the demonstration, we will upload a point GIS data into IGISMap. We can either add it in vector format using Upload Vector File tool or in spreadsheet format using Upload CSV/Excel File tool. Here, let’s upload the GIS data of state wise population details of the USA in spreadsheet format with latitude and longitude fields containing the state centroid coordinates.

Click https://map.igismap.com/upload-excel-csv-files to open Upload Excel/CSV File tool.

After opening Upload Excel/CSV File tool, click on Browse and choose the file final_usa_popuplation showing USA state wise population map from the desktop and then Upload it.

Upload Excel/CSV File

After Upload we have to define the location fields in Define Location Fields section. In the IGISMap there are three options to Define Location Fields from the spreadsheet file:

  • Latitude/Longitude
  • WKT
  • Geocode

Coordinates in our data is saved in separate latitude and longitude columns. Thus we have to select latitude and longitude attribute fields in our data from the dropdown list at appropriate boxes. Then click on Publish to publish the data in the map.

Define Location Fields

Now the data is published and point is plotted in the map with a default blue pins as shown below.

Point Data Published

Open IGISMap Bubble Style tool

Lets now open the Bubble Style tool to style the uploaded point data. To access the tool from the map itself, click Tools button from Map Tools section below Base Map tab. This opens a popup with Map Tools where you can select Bubble Style tool listed under Style Your Data section.

Map Tools
Map Tools

You can also open the Bubble Style tool by going to the More option of input point data and choose the Bubble Style from the Edit Style option.

More options
More options

Convert pins to bubbles

In Bubble Style tool, first step is to select the layer from Select Layer section which is the final_usa_popuplation in our case and click Next.

Bubble Style - Select Layer
Select Layer

Now the Edit Layer section is opened. Here you can fix the Opacity and choose the Attribute field from which you need to take values for quantitative visualization. Select population_2020 as we need to understand the population distribution in every states of USA in 2020.

Bubble Style - Select Attribute Field
Select Attribute Field

When required attribute field is selected, four class of value ranges get listed as default with different color and bubble radius. We can change the Color and bubble Radius for each class by selecting the color, that opens a palette to choose the right color of your choice. After making all changes, click Save Style button to apply this style to the point GIS data.

Assign color to each class

Bubble Style is applied in the point GIS data like the following.

Bubble Map
Bubble Map

Check the article Share your Map to understand more about Share Map feature of IGISMap.

Also check the article Create GIS Bubble Map – IGIS Map Tool

Check other articles:
Check the following IGISMap tools:

Plot ATM locations on a map and embed on your website

Consider that you are an engineer working for the technical support team in a bank. And you were asked to host a web map of the ATM locations under your branch. This same map should be later available to dynamically visualize the transactions associated with each ATM in a quantitative representation. In this article, you will learn how to plot atm/shop locations on map and embed it on your website.

There are limited GIS software and online tools where you can do this job. Most of them are limited to any single service, ie., either creating a map and hosting the map on a website, but IGISMap allows you to do both. IGISMap is a GIS based web platform providing multiple GIS applications that are most important in the field of geospatial analytics. The peculiarity of IGISMAP in the GIS Industry is its UI/UX which helps the user to perform effortless geospatial operations. GIS tools of IGISMAP allow you to Add Your Data, Create Your Data, Map Your Data, Style Your Data, Process Your Data, and Analyze Your Data, and additionally, it helps you to share your Data privately or publicly.

How to Plot ATM/shop locations on map

Create Point Data tool of IGISMap is a powerful GIS tool to plot point vector data to represent locations and point objects with single latitude and longitude values. Using Create Point Data tool, we can create an interactive map of ATM locations like the following.

Map of ATM Locations

Lets walk through each step of the Create Point Data tool to create a map like this and share with your team.

  • First, you need to log in to IGISMap from https://map.igismap.com/. If you haven’t signed up for IGISMap, click the Sign Up button to create an IGISMap account.
  • After Logging In, you will be directed to the dashboard of your IGISMap account.
  • From the dashboard, click on the Create Point Data tab to open the tool as shown below.
plot atm/shop locations on the map
Create Point Data tool

Start Plotting Points for the ATM Locations

First step is Add Points, where we can start plotting the ATM locations as points, in the form of pins. IGISMap provides you with three features for plotting points: Drop Points, Search Address, and Lat Lon Values.

  • Let’s select the Drop Points option and zoom to the location with the desired ATM Machine to plot a pin in that specific location on the map
Create Point Data - Add Points - Drop Points - plot the atm/shop location on map
Add Points – Drop Points
  • Search Address option opens a search address box, where you can enter an address and choose the right option from the dropdown list, then click the Plot button to plot a point on that location.
  • Lat Lon Values will open two boxes to enter latitude and longitude values of the location you want to plot, Plot Location button in this option will plot a pin at the location you have entered.

Also, a popup will open for entering attribute values in each attribute field for that atm location when a point is plotting. Click the Submit button to Submit the save the attribute entries. You can choose to delete the point you plotted by clicking the Delete Point button. You can disable the default opening of this popup using the toggle button.

Create Point Data - Add Points - Enable/Disable Popup

But we can open this popup anytime while plotting, by simply clicking on an existing pin.

Note: If the Drop Points option is active for dropping pins, it should be unselected for selecting the plotted pins to open the attribute popup.

After plotting every desired ATM location for our data, click the Save and Publish button to publish your data in the map.

Review and Edit the Datatable

After the atm location is published, Show/Edit Datatable section will be open. Here you can edit the attribute values entered for each point location after clicking the button in the data table along each row in the data table. You can also choose to delete a point by clickingbutton.

Create Point Data - Show/Edit Datatable - plot the atm/shop location on map
Datatable

Options to edit or delete the attribute fields are also available in this step along with the option to add new attribute fields to this data. If you thought of adding more points to the data of ATM Locations, select the Back button to go to the Add Points section, where you can add more points and make changes to the already published data.

Option to update the data table as bulk is available in this section. Where the whole data table can be downloaded in Excel format using Download Datatable button. And to make the changes outside IGISMap, then upload the edited/updated spreadsheet file using Upload Datatable button and integrate with the same point data of ATM locations. 

After making all the changes in the datatable, let’s move to the styling section by clicking the Next button to finish plotting.

Style Your ATM Location Points

A map will become more meaningful if appropriate icons and colors are used to visualize the features of the map. In IGISMap styling options, Bubble Style and Icon Style are provided for point GIS data.

Check this article understand How to create Bubble Map for point GIS data.

Here we are going to style our data using Icon Style. In Icon Styling, IGISMap provides two more options – Basic and Category styling. For now, let’s make it simple by providing an appropriate pin icon for styling the ATM location points. And apply it on the ATM Locations data as follows.

Check this article to understand How to style point GIS data categorically using Icon Style tool.

Create Point Data - Edit Style - plot the atm/shop location on map
Edit Style

IGISMap provides direct access to Icon Style and Bubble Style tools from an existing map, where you can style point GIS data published in that map

Embed Your ATM Locations Map in a Website

As the data is created completely and styled appropriately, let’s embed the map of ATM Locations in a website. For this, click the button at the top right, where you will reach the UI to control the sharing of this map.

Share Map - plot the atm/shop location on map
Share Map

Once the components are enabled and disabled as desired. After that click the Next button to proceed to the step of copying the iframe link to embed in a website.

Share Map - Embed Map
Share Map – Embed Map
Link to Embed Map - plot the atm/shop location on map
Link to Embed Map

Copy the HTML code link and embed it on your website. Thus the map will be available as interactive as below.

Afterward merge the data table of the ATM Locations with the transaction data of each ATMs. Furthermore, for quantitative visualization, we can use Bubble Style. The style will apply automatically to your website. So with the following steps, you can plot atm/shop locations on a map and embed them on your website.

Article Share your Map will help you understand more about Share Map feature of IGISMap.

Other articles:
Check the following IGISMap tools:

Download Switzerland Administrative Boundary Shapefiles – Cantons, Districts, Postal Codes and more

Hello GIS enthusiasts, IGISMAP has now published the latest GIS vector data of Switzerland administrative levels. Links for downloading the shapefiles of the important administrative divisions of Switzerland are provided in the following. You can also download these data in KML, GeoJSON or CSV formats.

Note:

  • All data available are in GCS datum EPSG:4326 WGS84 CRS (Coordinate Reference System).
  • You need to login for downloading the shapefile.

Download Free Shapefile Data of Switzerland

Switzerland, officially the Swiss Confederation, is a landlocked country at the confluence of Western, Central and Southern Europe. Switzerland is bordered by Italy to the south, France to the west, Germany to the north and Austria and Liechtenstein to the east. It is geographically divided among the Swiss Plateau, the Alps and the Jura, spanning a total area of 41,285 km2 (15,940 sq mi) and land area of 39,997 km2 (15,443 sq mi).

Switzerland GIS Data - National Boundary
Switzerland National Boundary

Download Switzerland National Outline Boundary Shapefile

If you are looking for any other GIS formats then use GIS File Converter.

Download Switzerland Cantons Shapefile Data

Switzerland being a federal republic composed of 26 cantons. The 26 cantons of Switzerland are the member states of the Swiss Confederation.

Switzerland GIS Data - Canton Boundaries
Switzerland Canton Boundaries

Download Switzerland Canton Boundaries Shapefile

Download Switzerland Districts Shapefile Data

Districts of Switzerland are a political subdivision for cantons. In the federally constituted Switzerland, each canton is completely free to decide its own internal organization. Following data of Switzerland have 159 district boundaries.

Switzerland GIS Data - District Boundaries
Switzerland District Boundaries

Download Switzerland District Boundaries Shapefile

Download Switzerland Postcode areas Shapefile Data

Switzerland is divided into nine postal districts, numbered from west to east. Each district is subdivided into postal areas. Each area contains a maximum of one hundred units. There are 4116 Postcode in the following data.

Switzerland Postcode Boundaries Shapefile
Switzerland Postcode Boundaries

Download Switzerland Postcode Boundaries Shapefile

Other Administrative Boundary Data:

For more GIS data visit – IGIS Map GIS Data

For more specific data contact us at support@igismap.com

Download Free Shapefile for the following:

  1. World Countries Shapefile
  2. Australia
  3. Argentina
  4. Austria
  5. Belgium
  6. Brazil
  7. Canada
  8. Denmark
  9. Fiji
  10. Finland
  11. Germany
  12. Greece
  13. India
  14. Indonesia
  15. Ireland
  16. Italy
  17. Japan
  18. Kenya
  19. Lebanon
  20. Madagascar
  21. Malaysia
  22. Mexico
  23. Mongolia
  24. Netherlands
  25. New Zealand
  26. Nigeria
  27. Papua New Guinea
  28. Philippines
  29. Poland
  30. Russia
  31. Singapore
  32. South Africa
  33. South Korea
  34. Spain
  35. Switzerland
  36. Tunisia
  37. United Kingdom Shapefile
  38. United States of America
  39. Vietnam
  40. Croatia
  41. Chile
  42. Norway

Disclaimer : If you find any shapefile data of country provided is in correct do contact us or comment below, so that we will correct the same in our system as well we will try to correct the same in OSM.

Download Ireland Administrative Boundary Shapefiles – Counties, Municipal Districts, Constituencies and more

Hello GIS enthusiasts, IGISMAP has now published the latest GIS vector data of Ireland administrative levels. Links for downloading the shapefiles of the important administrative divisions of Ireland are provided in the following. You can also download these data in KML, GeoJSON or CSV formats.

Note:

  • All data available are in GCS datum EPSG:4326 WGS84 CRS (Coordinate Reference System).
  • You need to login for downloading the shapefile.

Download Free Shapefile Data of Ireland

Ireland also known as the Republic of Ireland is a country in north-western Europe consisting of 26 of the 32 counties of the island of Ireland. The capital and largest city is Dublin, on the eastern side of the island. Around 40% of the country’s population of 5 million people resides in the Greater Dublin Area. The sovereign state shares its only land border with Northern Ireland, which is part of the United Kingdom.

Ireland GIS Data - National Boundary
Ireland National Boundary

Download Ireland National Outline Boundary Shapefile

Download Ireland Counties Shapefile Data

The 26 counties of the Republic of Ireland are Carlow, Cavan, Clare, Cork, Donegal, Dublin, Galway, Kerry, Kildare, Kilkenny, Laois, Leitrim, Limerick, Longford, Louth, Mayo, Meath, Monaghan, Offaly, Roscommon, Sligo, Tipperary, Waterford, Westmeath, Wexford and Wicklow.

Ireland GIS Data - County Boundaries
Ireland County Boundaries

Download Ireland County Boundaries Shapefile

Download Ireland Municipal Districts Shapefile Data

A municipal district is an area of a council area that comprises one or more electoral area. In most cases the electoral area constitutes the municipal district. All counties and cities apart from the local authorities in the areas of Dun Laoghaire, Fingal and South Dublin and the cities of Dublin, Cork and Galway are divided into municipal districts. Councillors represent both the municipal district and the local authority. In total, there are 95 municipal districts in the country.

Ireland GIS Data - Municipal District Boundaries
Ireland Municipal District Boundaries

Download Ireland Municipal District Boundaries Shapefile

Download Ireland Parliamentary Constituencies Shapefile Data

There are 39 multi-member electoral districts, known as Dáil constituencies, that elect 160 TDs (members of parliament), to Dáil Éireann, Ireland’s lower house of the Oireachtas, or parliament, by means of the single transferable vote, to a maximum term of five years.

Ireland GIS Data - Parliamentary Constituency Boundaries
Ireland Parliamentary Constituency Boundaries

Download Ireland Parliamentary Constituency Boundaries Shapefile

Other Administrative Boundary Data:

Download Free Shapefile for the following:

  1. World Countries Shapefile
  2. Australia
  3. Argentina
  4. Austria
  5. Belgium
  6. Brazil
  7. Canada
  8. Denmark
  9. Fiji
  10. Finland
  11. Germany
  12. Greece
  13. India
  14. Indonesia
  15. Ireland
  16. Italy
  17. Japan
  18. Kenya
  19. Lebanon
  20. Madagascar
  21. Malaysia
  22. Mexico
  23. Mongolia
  24. Netherlands
  25. New Zealand
  26. Nigeria
  27. Papua New Guinea
  28. Philippines
  29. Poland
  30. Russia
  31. Singapore
  32. South Africa
  33. South Korea
  34. Spain
  35. Switzerland
  36. Tunisia
  37. United Kingdom Shapefile
  38. United States of America
  39. Vietnam
  40. Croatia
  41. Chile
  42. Norway

Disclaimer : If you find any shapefile data of country provided is in correct do contact us or comment below, so that we will correct the same in our system as well we will try to correct the same in OSM.

Download Italy Administrative Boundary Shapefiles – Regions, Provinces, Municipalities and more

Hello GIS enthusiasts, IGISMAP has now published the latest GIS vector data of Italy administrative levels. Links for downloading the shapefiles of the important administrative divisions of Italy are provided in the following. You can also download these data in KML, GeoJSON or CSV formats.

Note:

  • All data available are in GCS datum EPSG:4326 WGS84 CRS (Coordinate Reference System).
  • You need to login for downloading the shapefile.

Download Free Shapefile Data of Italy

Italy officially known as the Italian Republic is a country consisting of a peninsula delimited by the Alps and several islands surrounding it, whose territory largely coincides with the homonymous geographical region. Italy is located in the centre of the Mediterranean Sea, in Southern Europe and is also considered part of Western Europe. A unitary parliamentary republic with Rome as its capital and largest city, the country covers a total area of 301,340 km2 (116,350 sq mi) and shares land borders with France, Switzerland, Austria, Slovenia, and the enclaved microstates of Vatican City and San Marino.

Italy GIS Data - National Boundary
Italy National Boundary

Download Italy National Outline Boundary Shapefile

Download Italy Regions Shapefile Data

The regions of Italy are the first-level constituent entities of the Italian Republic, constituting its second NUTS administrative level. There are 20 regions, of which five have greater autonomy than the other fifteen. Under the Italian Constitution, each region is an autonomous entity with defined powers. With the exception of the Aosta Valley, each region is divided into a number of provinces.

Italy GIS Data - Region Boundaries
Italy Region Boundaries

Download Italy Region Boundaries Shapefile

Download Italy Provinces Shapefile Data

The provinces of Italy are the constituent entities of the Italian Republic, on an intermediate level between a municipality (comune) and a region (regione). Since 2015, provinces have been classified as ‘institutional bodies of second level’. There are currently 107 Provinces in Italy, including 80 ordinary provinces, 2 autonomous provinces, 4 regional decentralization entities, 6 free municipal consortia, and 14 metropolitan cities, as well as the Aosta Valley region (which also exercises the powers of a province). Italian provinces (with the exception of the current Sardinian provinces) correspond to the NUTS 3 regions.

Italy GIS Data - Province Boundaries
Italy Provinces Boundaries

Download Italy Province Boundaries Shapefile

Download Italy Municipalities Shapefile Data

The Municipalities also known as comune is a local administrative division of Italy, roughly equivalent to a township. In 2020, Italy counted 7914 municipalities. Between 2011 and 2020, the number of municipalities experienced a constant decrease. In 2011, there were over eight thousand municipalities in the country.

Italy GIS Data - Municipality Boundaries
Italy Municipality Boundaries

Download Italy Municipality Boundaries Shapefile

Other Administrative Boundary Data:

Download Free Shapefile for the following:

  1. World Countries Shapefile
  2. Australia
  3. Argentina
  4. Austria
  5. Belgium
  6. Brazil
  7. Canada
  8. Denmark
  9. Fiji
  10. Finland
  11. Germany
  12. Greece
  13. India
  14. Indonesia
  15. Ireland
  16. Italy
  17. Japan
  18. Kenya
  19. Lebanon
  20. Madagascar
  21. Malaysia
  22. Mexico
  23. Mongolia
  24. Netherlands
  25. New Zealand
  26. Nigeria
  27. Papua New Guinea
  28. Philippines
  29. Poland
  30. Russia
  31. Singapore
  32. South Africa
  33. South Korea
  34. Spain
  35. Switzerland
  36. Tunisia
  37. United Kingdom Shapefile
  38. United States of America
  39. Vietnam
  40. Croatia
  41. Chile
  42. Norway

Disclaimer : If you find any shapefile data of country provided is in correct do contact us or comment below, so that we will correct the same in our system as well we will try to correct the same in OSM.

Download Spain Administrative Boundary Shapefiles – Autonomous Communities, Provinces, Municipalities and more

Hello GIS enthusiasts, IGISMAP has now published the latest GIS vector data of Spain administrative levels. Links for downloading the shapefiles of the important administrative divisions of Spain are provided in the following. You can also download these data in KML, GeoJSON or CSV formats.

Note:

  • All data available are in GCS datum EPSG:4326 WGS84 CRS (Coordinate Reference System).
  • You need to login for downloading the shapefile.

Download Free Shapefile Data of Spain

Spain officially known as the Kingdom of Spain is a country in Southwestern Europe with some pockets of territory in the Mediterranean Sea, offshore in the Atlantic Ocean. The country’s mainland is bordered to the south by the British overseas territory of Gibraltar, to the south and east by the Mediterranean Sea to the north by France, Andorra and the Bay of Biscay and to the west by Portugal and the Atlantic Ocean.

Spain GIS Data - National Boundary
Spain National Boundary

Download Spain National Outline Boundary Shapefile

Download Spain Autonomous Communities Shapefile Data

In Spain, an autonomous community is a first level political and administrative division, created in accordance with the Spanish Constitution of 1978, with the aim of guaranteeing limited autonomy of the nationalities and regions that make up Spain. There are 17 autonomous communities and two autonomous cities that are collectively known as autonomies.

  • Andalusia
  • Aragon
  • Asturias
  • Balearic Islands
  • Basque Country
  • Canary Islands
  • Cantabria
  • Castile and León
  • Castilla–La Mancha
  • Catalonia
  • Community of Madrid
  • Extremadura
  • Galicia
  • La Rioja
  • Navarre
  • Region of Murcia
  • Valencian Community
  • Ceuta
  • Melilla
Spain GIS Data - Autonomous Community Boundaries
Spain Autonomous Community Boundaries

Download Spain Autonomous Community Boundaries Shapefile

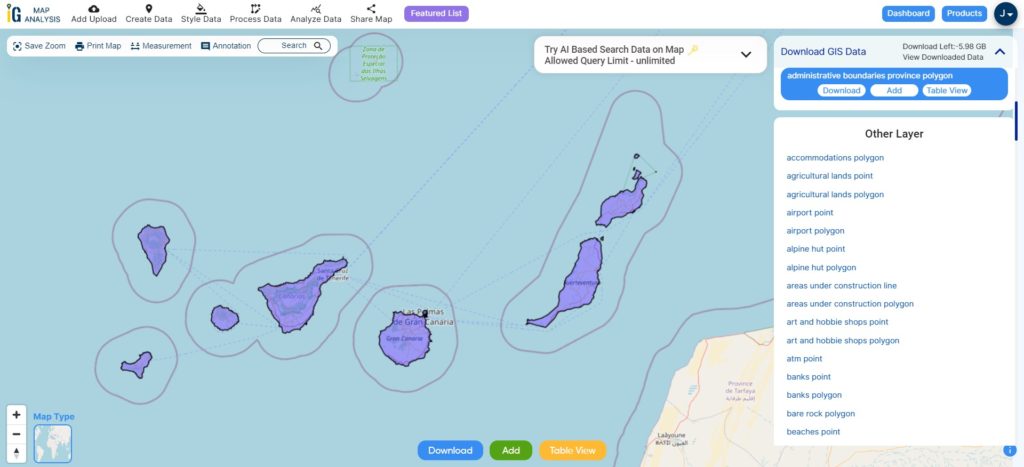
Download Spain Provinces Shapefile Data

Spain and its 17 autonomous communities are subdivided into 50 provinces. Seven of the autonomous communities comprise no more than one province each: Asturias, the Balearic Islands, Cantabria, La Rioja, Madrid, Murcia, and Navarre. These are sometimes referred to as uniprovincial communities.

Spain GIS Data - Province Boundaries
Spain Province Boundaries

Download Spain Province Boundaries Shapefile

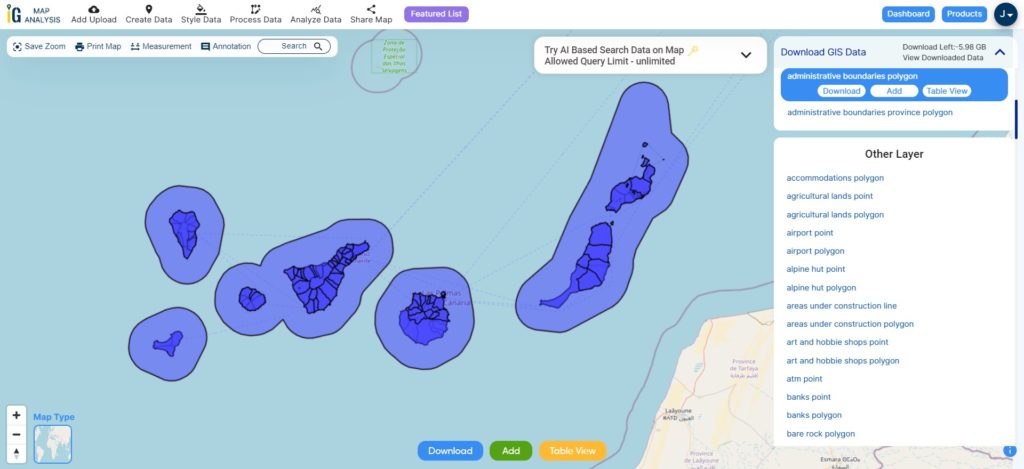
Download Spain Municipalities Shapefile Data

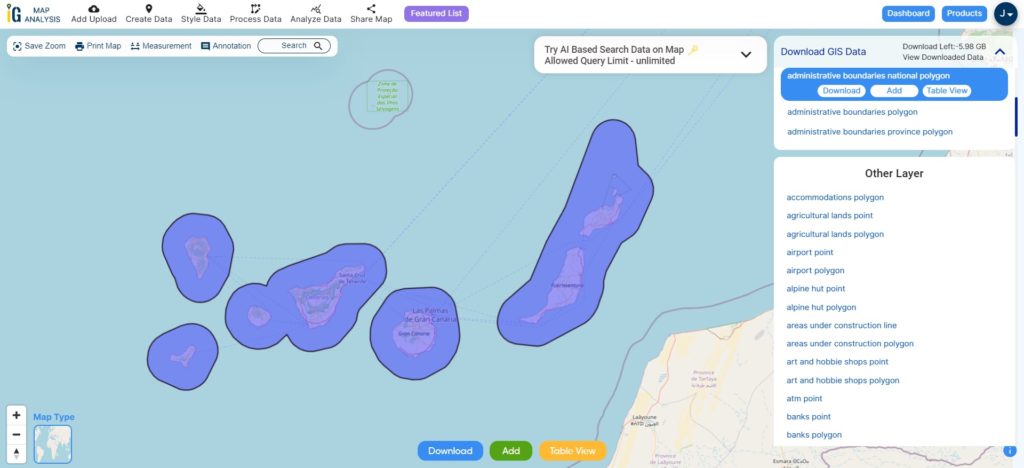
There is a total of 8124 municipalities in Spain, including the autonomous cities of Ceuta and Melilla. Burgos is the province with the most municipalities (371) and Las Palmas the one with the least (34).

Spain GIS Data - Municipality Boundaries
Spain Municipality Boundaries

Download Spain Municipality Boundaries Shapefile

Other Administrative Boundary Data:

Download Free Shapefile for the following:

  1. World Countries Shapefile
  2. Australia
  3. Argentina
  4. Austria
  5. Belgium
  6. Brazil
  7. Canada
  8. Denmark
  9. Fiji
  10. Finland
  11. Germany
  12. Greece
  13. India
  14. Indonesia
  15. Ireland
  16. Italy
  17. Japan
  18. Kenya
  19. Lebanon
  20. Madagascar
  21. Malaysia
  22. Mexico
  23. Mongolia
  24. Netherlands
  25. New Zealand
  26. Nigeria
  27. Papua New Guinea
  28. Philippines
  29. Poland
  30. Russia
  31. Singapore
  32. South Africa
  33. South Korea
  34. Spain
  35. Switzerland
  36. Tunisia
  37. United Kingdom Shapefile
  38. United States of America
  39. Vietnam
  40. Croatia
  41. Chile
  42. Norway

Disclaimer : If you find any shapefile data of country provided is in correct do contact us or comment below, so that we will correct the same in our system as well we will try to correct the same in OSM.

Download Greece Administrative Boundary Shapefiles – Regions, Prefectures, Municipalities and more

Hello GIS enthusiasts, IGISMAP has now published the latest GIS vector data of Greece administrative levels. Links for downloading the shapefiles of the important administrative divisions of Greece are provided in the following. You can also download these data in KML, GeoJSON or CSV formats.

Note:

  • All data available are in GCS datum EPSG:4326 WGS84 CRS (Coordinate Reference System).
  • You need to login for downloading the shapefile.

Download Free Shapefile Data of Greece

Greece officially known as the Hellenic Republic, is a country located in Southeastern Europe. Its population is approximately 10.7 million as of 2018. Athens is its largest and capital city, followed by Thessaloniki. Situated on the southern tip of the Balkans, Greece is located at the crossroads of Europe, Asia, and Africa. It shares land borders with Albania to the northwest, North Macedonia and Bulgaria to the north, and Turkey to the northeast.

Greece GIS Data - National Boundary
Greece National Boundary

Download Greece National Outline Boundary Shapefile

Download Greece Region Shapefile Data

Regions are the first level administrative entities of Greece. There are 13 regions each comprising several second-level units known as Regional Units.

  • Attica
  • Central Greece
  • Central Macedonia
  • Crete
  • East Macedonia and Thrace
  • Epirus
  • Ionian Islands
  • North Aegean
  • Peloponnese
  • Southern Aegean
  • Thessaly
  • West Macedonia
  • Western Greece
Greece GIS Data - Region Boundaries
Greece Region Boundaries

Download Greece Region Boundaries Shapefile

Download Greece Prefectures Shapefile Data

Prefectures are the second level administrative division of Greece after regional division. There are 51 prefectures.

Greece GIS Data - Prefecture Boundaries
Greece Prefecture Boundaries

Download Greece Prefecture Boundaries Shapefile

Download Greece Municipalities Shapefile Data

Municipalities are the lowest level of government within the organizational structure of the state. There were 1033 municipalities based on the 1997 Kapodistrias reform. Kallikratis reform of 2011 merged certain municipalities. So currently there are 325 municipalities in Greece.

Greece GIS Data - Municipality Boundaries
Greece Municipality Boundaries

Download Greece Municipality Boundaries Shapefile

Other Administrative Boundary Data:

Download Free Shapefile for the following:

  1. World Countries Shapefile
  2. Australia
  3. Argentina
  4. Austria
  5. Belgium
  6. Brazil
  7. Canada
  8. Denmark
  9. Fiji
  10. Finland
  11. Germany
  12. Greece
  13. India
  14. Indonesia
  15. Ireland
  16. Italy
  17. Japan
  18. Kenya
  19. Lebanon
  20. Madagascar
  21. Malaysia
  22. Mexico
  23. Mongolia
  24. Netherlands
  25. New Zealand
  26. Nigeria
  27. Papua New Guinea
  28. Philippines
  29. Poland
  30. Russia
  31. Singapore
  32. South Africa
  33. South Korea
  34. Spain
  35. Switzerland
  36. Tunisia
  37. United Kingdom Shapefile
  38. United States of America
  39. Vietnam
  40. Croatia
  41. Chile
  42. Norway

Disclaimer : If you find any shapefile data of country provided is in correct do contact us or comment below, so that we will correct the same in our system as well we will try to correct the same in OSM.

Download Belgium Administrative Boundary Shapefiles – Provinces, Arrondissements, Postal Districts and more

Hello GIS enthusiasts, IGISMAP has now published the latest GIS vector data of Belgium administrative levels. Links for downloading the shapefiles of the important administrative divisions of Belgium are provided in the following. You can also download these data in KML, GeoJSON or CSV formats.

Note:

  • All data available are in GCS datum EPSG:4326 WGS84 CRS (Coordinate Reference System).
  • You need to login for downloading the shapefile.

Download Free Shapefile Data of Belgium

Belgium officially known as the Kingdom of Belgium, is a country in Western Europe. It is bordered by the Netherlands to the north, Germany to the east, Luxembourg to the southeast, France to the southwest, and the North Sea to the northwest. The capital and largest city is Brussels; other major cities are Antwerp, Ghent, Charleroi, Liège, Bruges, Namur, and Leuven.

Belgium GIS Data - National Boundary
Belgium National Boundary

Download Belgium National Outline Boundary Shapefile

Download Belgium Provinces Shapefile Data

The country of Belgium is divided into three regions. Two of these regions, Flanders and Wallonia, are each subdivided into five provinces. The third region, Brussels, is not divided into provinces, as it was originally only a small part of a province itself. Thus there are 11 provinces in Belgium.

Belgium GIS Data - Province Boundaries
Belgium Province Boundaries

Download Belgium Province Boundaries Shapefile

Second level NUTS division of Belgium for European Union statistical purposes is same as the province level division of Belgium

Download Belgium Arrondissement Divisions Shapefile Data

Arrondissements of Belgium are subdivisions below the provinces of Belgium. There are administrative, judicial and electoral arrondissements. IGISMAP provides the shapefile data of administrative arrondissements. There are43 administrative arrondissements including the Brussels-Capital as a single arrondissement.

Belgium GIS Data - Arrondissement Boundaries
Belgium Arrondissement Boundaries

Download Belgium Arrondissements Boundaries Shapefile

Download Belgium Postal District Divisions Shapefile Data

There are over 1268 postcode district boundaries based on the data provided below

Belgium GIS Data - Postcode Boundaries
Belgium Postal District Boundaries

Download Belgium Postal District Boundaries Shapefile

Other Administrative Boundary Data:

Download free Shapefile

  1. World Countries Shapefile
  2. Australia
  3. Argentina
  4. Austria
  5. Belgium
  6. Brazil
  7. Canada
  8. Denmark
  9. Fiji
  10. Finland
  11. Germany
  12. Greece
  13. India
  14. Indonesia
  15. Ireland
  16. Italy
  17. Japan
  18. Kenya
  19. Lebanon
  20. Madagascar
  21. Malaysia
  22. Mexico
  23. Mongolia
  24. Netherlands
  25. New Zealand
  26. Nigeria
  27. Papua New Guinea
  28. Philippines
  29. Poland
  30. Russia
  31. Singapore
  32. South Africa
  33. South Korea
  34. Spain
  35. Switzerland
  36. Tunisia
  37. United Kingdom Shapefile
  38. United States of America
  39. Vietnam
  40. Croatia
  41. Chile
  42. Norway

Disclaimer : If you find any shapefile data of country provided is incorrect do contact us or comment below, so that we will correct the same in our system as well we will try to correct the same in OSM.

Download West Virginia State GIS Maps – Boundary, Counties, Rail, highway

GIS Data and Maps of West Virginia State is used by planners and surveyors for visualizing and identifying the patterns that are difficult to examine when data is in table form. Here you can download the GIS data of the state boundary, county division, rail and highway maps in just a few clicks. You can use these data for analysis in MAPOG itself or download them in any suitable GIS format. You can download these data in KML, GeoJSON, CSV or Shapefile formats.

With MAPOG’s versatile toolkit, you can effortlessly upload vector and raster filesadd WMS (Web Map Service) layers, upload Excel or CSV data, incorporate existing files, perform polygon splitting and merging, generate new polygon and polyline data, use the converter for various formats, conduct buffer analysiscreate gridstransform points into polygons, calculate isochrones, and utilize the geocoder for precise location information.

We offer an extensive array of data formats, including KML, SHP, CSV, GeoJSON, Tab, SQL, Tiff, GML, KMZ, GPKZ, SQLITE, Dxf, MIF, TOPOJSON, XLSX, GPX, ODS, MID, and GPS, ensuring compatibility and accessibility for various applications and analyses.

Note:

  • All data available are in GCS datum EPSG:4326 WGS84 CRS (Coordinate Reference System).
  • You need to login for downloading the shapefile.

Download Shapefile Data West Virginia State

West Virginia is a state in the Appalachian, Mid-Atlantic and South-eastern regions of the United States. Charleston city is the capital city of the state. In addition, if you are looking for any other GIS formats then use GIS File Converter.

West Virginia GIS Data - State Boundary
West Virginia State Boundary

Download West Virginia State Outline Boundary Shapefile

In the above screen boundary map of West Virginia state. This is the map view for the data table switch button from the map to the data. The layer name is provided on the right side of the screen. For download click on the button placed beside the map layer name. You can locate your store/ shop on a map.

Download West Virginia Counties Shapefile Data

There are 55 counties in the U.S. state of West Virginia.

West Virginia GIS Data - County Boundary
West Virginia County Boundary

Download West Virginia County Boundary Shapefile

Polygon map with county division is visible on the above screen. You can easily download and upload in a tool for free and create a map from GIS data. Edit, format, add attribute column and share it with your colleagues.

Above all Layers cover GIS data of following Counties –

Barbour
Berkeley
Boone
Braxton
Brooke
Cabell
Calhoun
Clay
Doddridge
Fayette
Gilmer
Grant
Greenbrier
Hampshire
Hancock
Hardy
Harrison
Jackson
Jefferson
Kanawha
Lewis
Lincoln
Logan
Marion
Marshall
Mason
McDowell
Mercer
Mineral
Mingo
Monongalia
Monroe
Morgan
Nicholas
Ohio
Pendleton
Pleasants
Pocahontas
Preston
Putnam
Raleigh
Randolph
Ritchie
Roane
Summers
Taylor
Tucker
Tyler
Upshur
Wayne
Webster
Wetzel
Wirt
Wood
Wyoming

Highway Line GIS Data of West Virginia State

West Virginia GIS Data - Highway Lines
West Virginia Highway Lines

Download West Virginia Highway Lines Shapefile

Zoom in view of highway line map is shown shown above. Similarly, you can easily download point based GIS data of airport point, ATM point, parking area, hospital location, etc.

Railways Line GIS Data of West Virginia U.S. State

West Virginia GIS Data - Railway Lines
West Virginia Railway Lines

Download West Virginia Railway Lines Shapefile

On the above screen, the railways line map is shown. Likewise, you can download residential land-use points, polygon, restaurants, business GIS data layers.

Download GIS Data of other states of USA:

  1. Alabama
  2. Alaska
  3. Arizona
  4. Arkansas
  5. California
  6. Colorado
  7. Connecticut
  8. Florida
  9. Georgia
  10. Hawaii
  11. Idaho
  12. Illinois
  13. Indiana
  14. Iowa
  15. Kansas
  16. Massachusetts
  17. Maryland
  18. Michigan
  19. Minnesota
  20. Mississipi
  21. Missouri
  22. Montana
  23. Nevada
  24. Nebraska
  25. Ohio
  26. Oklahoma
  27. Pennsylvania
  28. Utah
  29. Vermont
  30. Washington
  31. Wisconsin
  32. Wyoming
  33. Tennessee
  34. Texas
  35. Kentucky
  36. Louisiana
  37. Maine
  38. North Carolina
  39. Oregon
  40. Virginia
  41. West Virginia

Disclaimer : If you find any shapefile data of country provided is in correct do contact us or comment below, so that we will correct the same in our system.

Download Virginia State GIS Maps – Boundary, Counties, Rail, highway

GIS Data and Maps of Virginia State is used by planners and surveyors for visualizing and identifying the patterns that are difficult to examine when data is in table form. Here you can download the GIS data of the state boundary, county division, rail and highway maps in just a few clicks. You can use these data for analysis in MAPOG itself or download them in any suitable GIS format. You can download these data in KML, GeoJSON, CSV or Shapefile formats.

With MAPOG’s versatile toolkit, you can effortlessly upload vector and raster filesadd WMS (Web Map Service) layers, upload Excel or CSV data, incorporate existing files, perform polygon splitting and merging, generate new polygon and polyline data, use the converter for various formats, conduct buffer analysiscreate gridstransform points into polygons, calculate isochrones, and utilize the geocoder for precise location information.

We offer an extensive array of data formats, including KML, SHP, CSV, GeoJSON, Tab, SQL, Tiff, GML, KMZ, GPKZ, SQLITE, Dxf, MIF, TOPOJSON, XLSX, GPX, ODS, MID, and GPS, ensuring compatibility and accessibility for various applications and analyses.

Note:

  • All data available are in GCS datum EPSG:4326 WGS84 CRS (Coordinate Reference System).
  • You need to login for downloading the shapefile

Download Shapefile Data of Virginia State

Virginia officially the Commonwealth of Virginia, is a state in the Mid-Atlantic and South-eastern regions of the United States. Richmond city is the capital city of the state.

Virginia GIS Data - State Boundary
Virginia State Boundary

Download Virginia State Outline Boundary Shapefile

In the above screen boundary map of Virginia state. This is the map view for the data table switch button from the map to the data. The layer name is provided on the Right side of the screen. For download click on the button placed beside the map layer name. You can locate your store/ shop on a map.

Download Virginia Counties Shapefile Data

There are 95 counties in the U.S. state of Virginia. For a polygon map click on the link given below.

Virginia GIS Data - Counties Boundary
Virginia Counties Boundary

Download Virginia Counties Boundary Shapefile

Polygon map with county division is visible on the above screen. You can easily download and upload in a tool for free and create a map from gis data. Edit, format, add attribute column and share it with your colleagues.

For checking information at a particular location click on the map area and the data table on a particular location will appear.

Above all Layers cover GIS data of following Counties –

Accomack County
Albemarle County
Alleghany County
Amelia County
Amherst County
Appomattox County
Arlington County
Augusta County
Bath County
Bedford County
Bland County
Botetourt County
Brunswick County
Buchanan County
Buckingham County
Campbell County
Caroline County
Carroll County
Charles City County
Charlotte County
Chesterfield County
Clarke County
Craig County
Culpeper County
Cumberland County
Dickenson County
Dinwiddie County
Essex County
Fairfax County
Fauquier County
Floyd County
Fluvanna County
Franklin County
Frederick County
Giles County
Gloucester County
Goochland County
Grayson County
Greene County
Greensville County
Halifax County
Hanover County
Henrico County
Henry County
Highland County
Isle of Wight County
James City County
King and Queen County
King George County
King William County
Lancaster County
Lee County
Loudoun County
Louisa County
Lunenburg County
Madison County
Mathews County
Mecklenburg County
Middlesex County
Montgomery County
Nelson County
New Kent County
Northampton County
Northumberland County
Nottoway County
Orange County
Page County
Patrick County
Pittsylvania County
Powhatan County
Prince Edward County
Prince George County
Prince William County
Pulaski County
Rappahannock County
Richmond County
Roanoke County
Rockbridge County
Rockingham County
Russell County
Scott County
Shenandoah County
Smyth County
Southampton County
Spotsylvania County
Stafford County
Surry County
Sussex County
Tazewell County
Warren County
Washington County
Westmoreland County
Wise County
Wythe County
York County

Highway Line GIS Data of Virginia State

Virginia GIS Data - Highway Lines
Virginia Highway Lines

Download Virginia Highway Lines Shapefile

Zoom in view of highway line map is shown shown above. Similarly, you can easily download point based GIS data of airport point, ATM point, parking area, hospital location, etc.

Railways Line GIS Data of Virginia U.S. State

Virginia GIS Data - Railway Lines
Virginia Railway Lines

Download Virginia Railway Lines Shapefile

In the above screen railways line map is shown. Likewise, you can download residential land use point, polygon, restaurants, business gis data layers.

In addition to, above enlisted layer if you are looking for any specific data write us on support@mapog.com.

Download GIS Data of other states of USA:

  1. Alabama
  2. Alaska
  3. Arizona
  4. Arkansas
  5. California
  6. Colorado
  7. Connecticut
  8. Florida
  9. Georgia
  10. Hawaii
  11. Idaho
  12. Illinois
  13. Indiana
  14. Iowa
  15. Kansas
  16. Massachusetts
  17. Maryland
  18. Michigan
  19. Minnesota
  20. Mississipi
  21. Missouri
  22. Montana
  23. Nevada
  24. Nebraska
  25. Ohio
  26. Oklahoma
  27. Pennsylvania
  28. Utah
  29. Vermont
  30. Washington
  31. Wisconsin
  32. Wyoming
  33. Tennessee
  34. Texas
  35. Kentucky
  36. Louisiana
  37. Maine
  38. North Carolina
  39. Oregon
  40. Virginia
  41. West Virginia

Disclaimer : If you find any shapefile data of country provided is in correct do contact us or comment below, so that we will correct the same in our system.