Owner and Director of a Private Limited company which serves individual to large scale industries in the field of Maps and GIS. He is a Gold Medalist in M.Tech(Spatial Information Technology) and owns some famous Technology blogs and website... Know more
Download Save Offline Google Map on app. Map helps you to navigate and find the nearest point of Interest locationwhen you are travelling and at unknown place. While Network service provider doesn’t guarantee you to provide full Network at each and every places you visit, which results in either no or slow internet. Keeping that in mind Google rolled out Offline Map to their user, by letting them to save and download a part of area into their device. This will not only solve the above stated problem but would surely going to help you save mobile data.
Google updated this feature in Mid 2015 for Android Application and in December 2015 for iOS application, which lets users to see live map offline. You may also see now the near by Gas station on Map. Both Search and direction Navigation feature would be supported even after having no internet connection if the Location Map area is downloaded. Below are the steps to know how to download offline Google Map in Android and iOS user.
You may also be interested to see following Google Map tips:
2.) If not signed in, then log in to the application. Click on mobile navigation button, to open up side bar.
3.) Check Offline area in the slidder. If offline Area option is not found, then click on Your Places and scroll down to bottom where it says to download the map area.
Download Save Offline Google Map
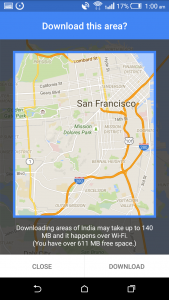
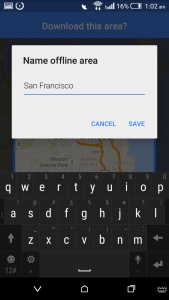
4.) Choose the area and click on download button to save the viewable area of Map. Enter the name of the Offline Map.
Note: You cannot select too large area. If you are attempting to do so, then app will ask you to further zoom in to reduce the area.
5.) Let download to get finished. You can see your offline map at “Your Places” option or at “Offline Area” option.
Once downloaded, you can view the saved area of map without internet connection.
Download Save Offline Google Map – Some Important points to keep in Mind
Following are some conditions which you need to keep in mind while downloading and using Google Map offline:
The biggest size which can be downloaded for an offline area is 120,000 square kilometer. This area is more than enough to acquire a single city.
Downloading offline area may not be available in some area or region due to some limitation as per Google.
Data downloaded will be expired after 30 days
Offline area is free to download, but your mobile data charges will apply.
You would get the options to rename, update or delete the offline Map saved, at “Your location” or “Offline Area” Panel. What you think about this Offline Google Map feature? Do comment below with your views.
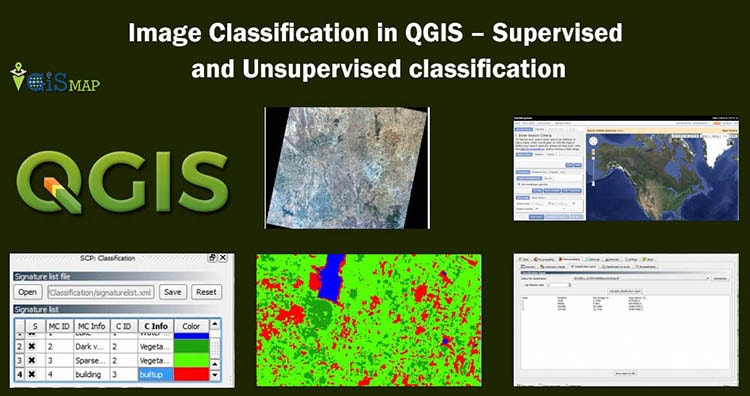
Image Classification in QGIS: Image classification is one of the most important tasks in image processing and analysis. It is used to analyze land use and land cover classes. With the help of remote sensing we get satellite images such as landsat satellite images. But these images are not enough to analyze, we need to do some processing on them. So to use these images for analysis we need image classification. In this post we will see how to download a Landsat satellite image and image classification in QGIS.
There are many software tools available for image classification such as ArcGIS, ERDAS IMAGIN, but these are not open source software. QGIS(Quantum GIS) is very powerful and useful open source software for image classification. QGIS 3.2.1 for beginners
The basic requirement for image classification is image itself but the other important thing is knowledge of the region for which we are going to classify the image. For this either you need to do manual survey or else you can use google earth. Definitely Manual survey leads to better result.
There are two types of image classification methods..
Supervised classification
Unsupervised classification
Unsupervised classification is not preferred because results are completely based on software’s knowledge of recognizing the pixel. For unsupervised classification you can use KMeansclassification. In this post we will see Supervised classification only.
Download the Sample Image data for classification
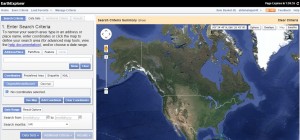
Let us see how to download a satellite image first to take out sample image. One of the source is Earth Explorer and register. If you already have an account then sign in.
Note: Please read terms and condition and usages of data.
Here you will see search criteria tab on your left hand side, select it. Enter date and month in the options provided, so that if you want to download image for specific season we can get that image. In rainy season cloud cover is more so it is recommended that we download a image free from cloud cover and mostly of summer of winter season to yield good results.
After zooming in to the location of interest on map click on data sets. And then search for landsat archive. Expand landsat archive option. Depending on our criteria of image we can select more than one option here. We can also set additional criteria based on our requirement.
After setting the criteria click on results. It may take some time to get the results.
Image classification in QGIS
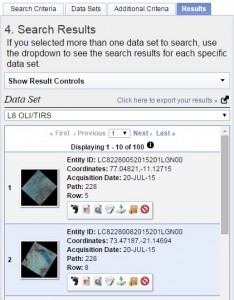
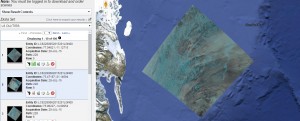
Now analyze the results available on your screen. There are some options given for our convenience. Click on show browse overlay and check if your location comes within the image or not. An image on your screen will appear. It will take some time to display depending on your internet speed as shown below in image.
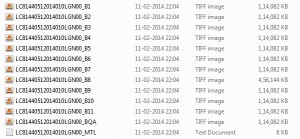
When you find image of your choice click on download button. Click on the download button of the file which have largest size. Don’t download other data. The download file in the folder is with extension .tar. extract that file and you will get a folder containing all the images and a text document.
Image classification in QGIS
You can see there are 12 images and one MTL text document. This text file is very necessary if this file is not downloaded then image classification will not be possible. We need only 7 images B1 to B7 for image classification, however we can use all the images but it will be very bulky for QGIS to handle and as you start image classification you will understand why we have used 7 images only. You may also consider to look more tutorial on QGIS.
Image Classification in QGIS :
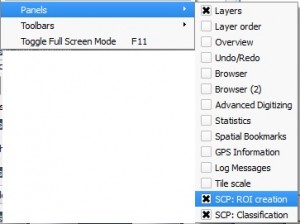
1.) Now open QGIS and install SEMI AUTOMATIC CLASSIFICATION plug-in from the plugin option. After installation of the plugin if toolbox on the screen of the same is not showing by default then, then click view and click panels. And Check both the panels SCP: ROI creation and SCP: classification.
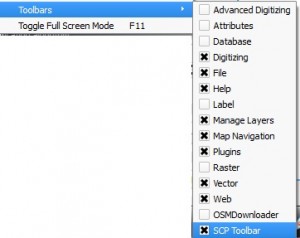
2.) Now click toolbar and activate SCP toolbar.
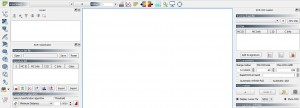
3.) Your Desktop QGIS screen will look like this below image.
Image classification in QGIS
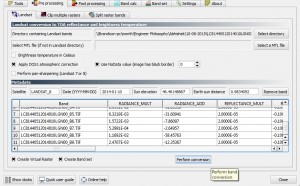
4.) Now Click on pre-processing tool and Select the folder in which all the images and MTL file is present.
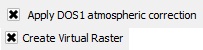
5.) Check these two options i.e Apply DOS1 Atmospheric Correction and Create Virtual Raster as shown below.
6.) Now click on perform conversion. The processing may take too much time. Be patient
Image classification in QGIS
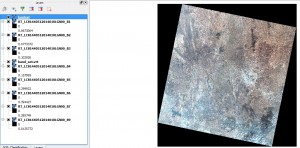
7.) All the images are loaded into Layers and virtual raster with name landsat.vrt is also created.
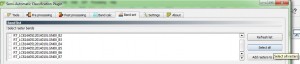
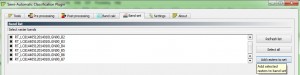
8.) We can remove image 8,9, 10 and 11. Click on band set icon and select all raster.
9.) Add rasters to band set.
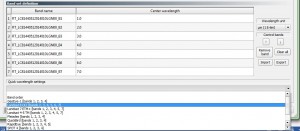
10.) Select landsat 8 only because we have downloaded a landsat 8 image.
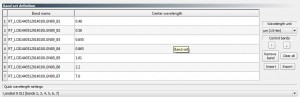
11.) Observe the changes in center wavelength.
Image classification in QGIS
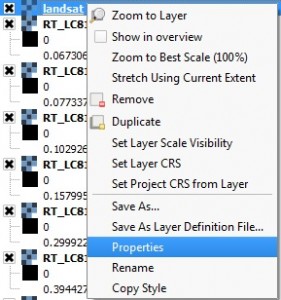
12.) Click close. Now Right click on landsat virtual raster and click properties.
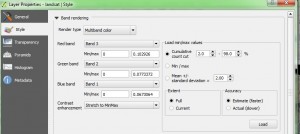
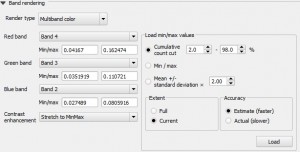
13.) Switch to style tab.
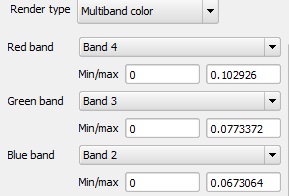
14.) Change the band set as shown in the image.
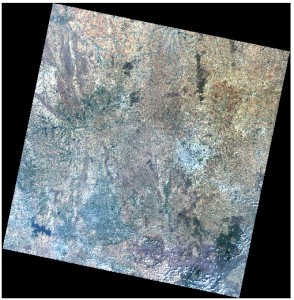
15.) Click apply and observe the changes in the image.
Image classification in QGIS
16.) You can set band set as per your convenience. Set the band set such that you can easily identify land cover and land use classes. For this example we are selecting the above band set. You may also set band set by zooming into your desired location and then load current value of canvas and then click apply. We can do this until we get proper colour for our image.
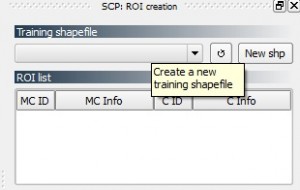
17.) Now in SCP: ROI creation panel click on new shp. ROI means Region of Interest.
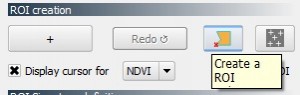
18.) Create a shape file in the same folder with name roi or as per your wish. Click on ‘+’ sign and then Click on create a ROI.
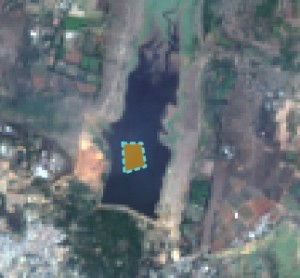
19.) Now as per your knowledge of the location zoom in and create a polygon. We are creating polygon because it will take pixels of same colour with slightly difference in the value. Right click to end the polygon.
Image classification in QGIS
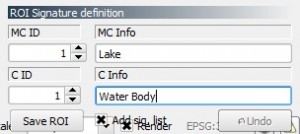
20.) Give Macroclass name and class name.
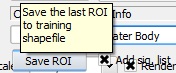
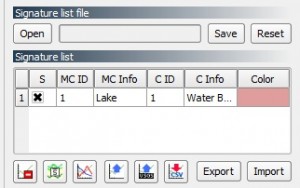
21.) Click on save ROI and check add sigg. List.
22.) The roi is added to the signature list.
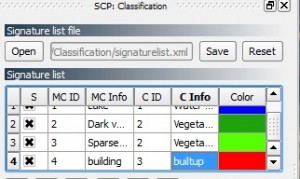
23.) Save this signature list in the same folder, and create new ROI’s for different classes. You can also change the color. Within same class you can have different Macroclass so that you can classify precisely. You can see the color convention for classes that are used generally on internet.
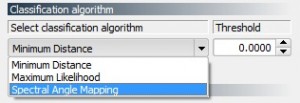
24.) Save all the roi. Select algorithm for classification.
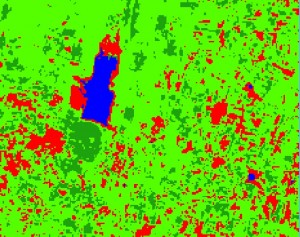
25.) Before going for classification you can see a preview with the option provided as classification preview. Now Click on the plus sign and click on the area where you want to see the preview.
Image classification in QGIS
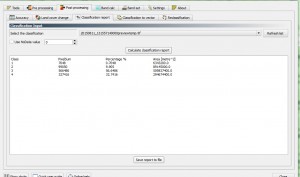
26.) Take a look at the preview. If this is the output you want you can go for final classification or you can make other ROI. Click on perform classification for final classification. This process will take time for classification. After the classification is done. Click on post processing tool icon and generate classification report.
Explore this plugin for more option. You will have a good classified image after practicing. Hope this tutorial helps you to explore the tool for classification with the help of QGIS software. If you want to share or have doubts or facing difficulty in implementing the steps, do comment below in the space provided below.
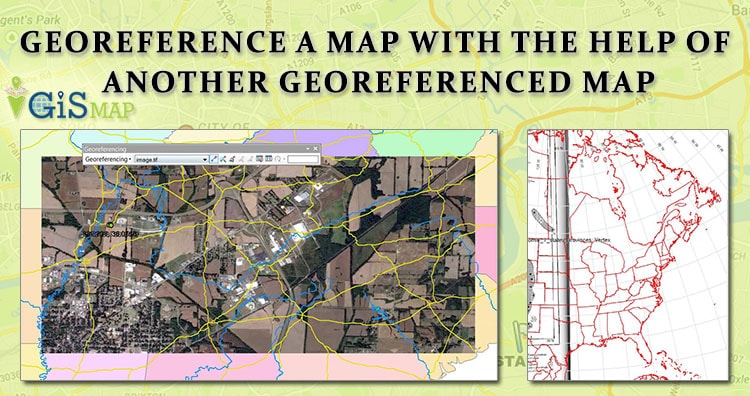
Here we will see how to georeference a map with the help of another georeferenced map in QGIS (Quantum GIS). Georeference is a process to associate geographic location coordinates to any kind of physical object which is physically present over a Raster image map or to a physical map, with help of other georeferenced data or with know location coordinates of some points of image which is effectively called as control points. It is one of the important concept of GIS (Geographical Information System). We have already discussed about how to Georeference Map with the help of know control points.
Georeference a map with the help of another georeferenced map:
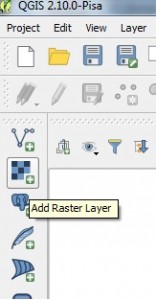
1.) Open QGIS and Load the georeferenced map, by selecting Layer -> Add Layer -> Add Raster Layer or by directly selecting Add Raster Layer from Layer panel as shown below.
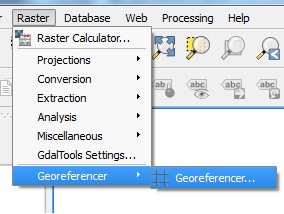
2.) After loading the file, from the menu select Raster and click on Georeferencer to select Georeferencer.
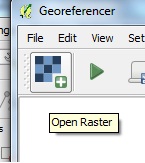
3.) In the Georeferencer window which is open up by above step, select Add Raster Layer icon to load non georeference map.
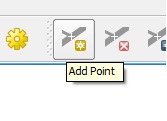
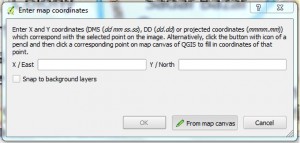
4.) Click add point and select a point on your map. In the pop up window click from map canvas.
Georeference a map with the help of another georeferenced map
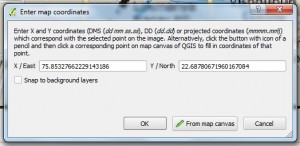
5.) Select location in the georeferenced map same as the location you selected in non-georeferenced map. You will see it will load the coordinates.
6.) Click ok.
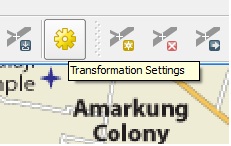
7.) Likewise select at least four points in different direction. Click transformation setting icon button as shown below in image.
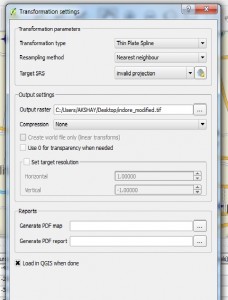
8.) Select any one Transformation Type and provide your output raster name.
Georeference a map with the help of another georeferenced map
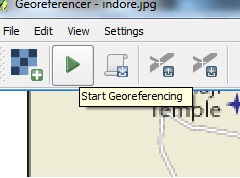
9.) Click start Georeferencing button from the Georeferencer window.
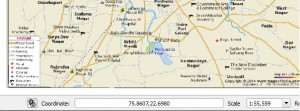
10.) Select CRS same as the georeferenced map. In our case it is WGS 84. Close georeferencer. You will see georeferenced image in canvas. Note the coordinates.
Georeference a map with the help of another georeferenced map
I hope this article would be helpful for you to know the basics of how to georeference raster image with the help of another georeferenced map. If you are facing problem in implementing the process do comment below, so that we can discuss over it.
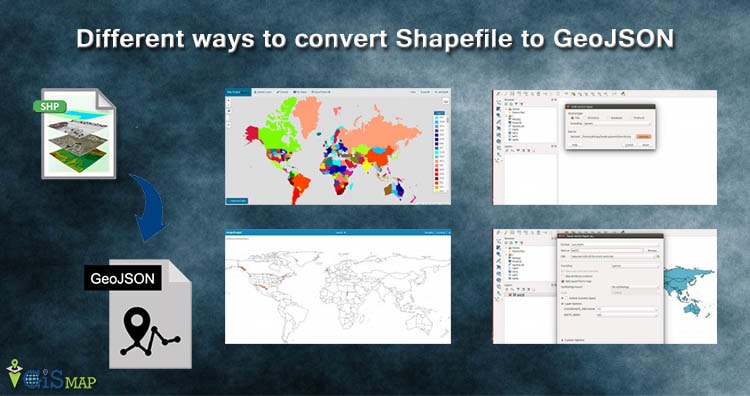
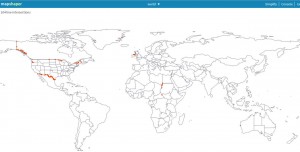
Convert Shapefile to GeoJSON. Shapefile, ESRI made a standard vector file format which is largely adopted in the field of GIS by programmers and geographers . While GeoJSON is also an open standard format designed for Web which largely supported with GIS JavaScript API, other programming API and with GIS (Geographic Information System) software tools too, for easily rendering. GeoJSON is based on JavaScript Object Notation. Here we will explore different methods to convert the files online, or offline or with the help of API which programmers can make use of.
You may be interested to refer following articles:
The simplest and fast way to access the internet is through the online method, as you don’t need to install and configure any tool on your PC. Just drag the Shapefile files, one click on button and convert to GeoJSON. There are many website which provides the tool to convert the files by browsing them to server side and convert and also some client side conversion too. Lets explore the list, which is only client side as client side conversion will secure your file and doesn’t take your data pack for uploading the file:
If you are already registered then login otherwise sign up.
Once get register tap on Converter Button Shown in figure.
Upload the Shapefile from data set or Google Drive or Drop Box or already added in drive then choose the file. Lets we want to convert already uploaded file from My Drive then select the file.
Tap the file and new window will appear shown below.
Select the desired Output in our case choose Geojson. You can also change CRS. Now tap on Convert file button.
It will so the table in the next step. You can directly download the converted file or you can check it through clicking on publish button.
Below is the screen of published Geojson file.
Whole process is same from new uploaded file from data set or from google drive or from drop box. If you face any problem ping us at website.
You might be interested in Query on Geojson data file then try our tool IGIS Map tool.
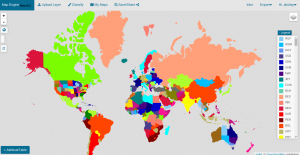
This is presented by Engineer Philosophy pvt. ltd, working in GIS Sector an IT company. What you need to do is to just Register, login and upload only .shp and .dbf file and then export the uploaded layer to GeoJSONfile by just selecting the option which appear at upper right corner in Navigation bar. You can also explore the attribute table from the website directly and filter the same which no other online tool provides.
different ways to convert Shapefile to Geojson – Online or Offline or API
Not only this, but you can classify the Map according to the shapefile dbf attributes and automatically classify and color it. The classified map can be exported as Scalable Vector Graphics i.e svg file.
Disclaimer: The above project is handled by me and my team and the project is in beta phase while you can definetly convert the shapefile to GeoJSON at client side securing your shapefile data. I would welcome your suggestion to improve the tool by commenting below or contacting me.
Map Shapper is the best tool which we should refer first. It is the best online tool which also handles large shapefiles and renders it quickly. Its an open source project and is licensed under MPL 2.0. Just drag the shapefile or zipped shapefile which will render the shapefile on map and can be further exported as geojson file with the option provided in tool itself.
With No doubt Map Shaper is much more better than any other tool for now, while the only reason why I placed this tool in second place just because the first tool was my own tool which provides more option for classifying the map, see all attributes in the data table and also exported as svg file.
2.) Offline Method – Convert Shapefile to GeoJSON in QGIS:
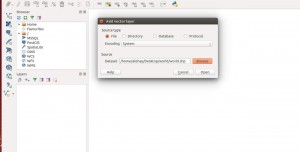
1.) Open QGIS Desktop and Select Layer -> Add Layer -> Add Vector Layer or click on Add Vector layer icon appears at the upper left in the application.
different ways to convert Shapefile to Geojson – Online or Offline or API
2.) Select the zipped shapefile or any of file i.e .shp or .dbf or .shx by browing the folder. Note, that all the three files i.e .shp, .dbf and .shx file should be present in the same foder with same name.
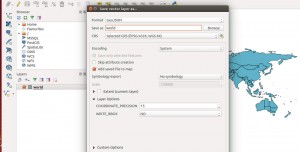
3.) Once uploaded, the map will be rendered and showed in QGIS application. Now navigate to Layer menu and select Save As option or just from the layers panel select the layer and right click from it to select Save As option.
4.) A window pop up will opne up. From the window just select the GeoJSON format and provide the name of the file in the input box as shown in the image provided below. Save the file. It will export the file in GeoJSON format.
3.) Offline Method – Convert Shapefile to GeoJSON with command line ogr2ogr tool:
Firstly you need to install an ogr2ogr tool of GDAL which is a GIS utlitly command line tool so as to convert one file to another. Now if the ogr2ogr is installed globally check by simple tying the ogr2ogr in command line if it is working or not. Or if it residing in some file system you need to navigate to ogr2ogr file and type in the same in command line. Now Just type in the following:
To get more option list and format you may see this gdal org link.
This tool will be helpful if you want to convert bulk files from shapefile to geojson. You can refer the .sh script found at github.
4.) Convert Shapefile to GeoJSON -API or library:
Shapefile is a binary file and cannot be viewed directly in notepad or textpad as like with GeoJSON file. So if you want to create your own API, to convert Shapefile to GeoJSON you should first have a knowledge of how to read the binary shapefile. You may refer to some of the articles which I have written some post which would help you to get the basic knowledge to know the format of files and read.
https://github.com/gipong/shp2geojson.js : This library is also MIT Licensed and is inspired by the above wavded library which uploads zipped file of shapefile. The library provided an example to use with leaflet js.
https://github.com/mbloch/mapshaper : Map Shaper as desricbed above is licensed under MPL 2.0 and can be very useful if you want to convert to GeoJSON as well as TopoJSON.
Hope this article helped you. If are facing some problem in converting the shapefile to geojson do comment below with the problem statement. We will definitely look over that. Also you can provide your valuable comment below if you are using any other library or tool to cover the same.
News Map Website – News, a new information either event, accident, social work, terrorists, sports, technical, launches, new innovation or election or in any form has some link with physical geographic location. How you filter latest news for a particular area or location? It would be really easy, nice and great way to filter the location based news from the interactive world map.
This news map website is really useful when you want to narrow down the data of location of which you are interested in. Not only this, but you can easily analyze new happening either good or bad around the world by seeing those sticky icons, or with cluster size or with colors.
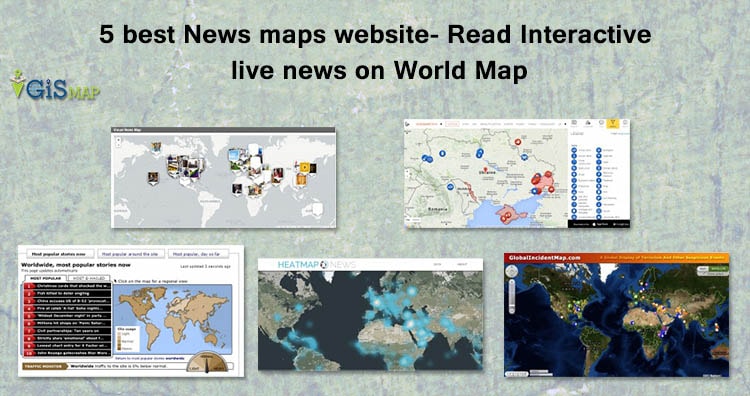
Here are the 5 best News Map Website – Read live news on World Map
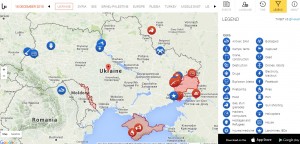
Liveuamap is opendata-driven media platform that change the way you receive latest news with Map. Liveuamap supports Multi-language and provides current data from various sources and social media websites. Not only it fetches the data and shows you map but it also analyse the category of news and indicate the icon as shown below i.e like Anti-air, SAM Biohazard, Camps, tents, Captured Crane, construction Dead, Destruction Drones, robots, Drugs, Electricity, blackout, Explosion, blasts, Facebook, Firebombs, Fires etc.
Liveuamap – News maps website
If you missed news from previous dates, you may select that date and grab the news easily. With website liveuamap also available in both android and iOS app. It is really an awesome and that why I have placed it on first position from all news map website.
2.) GDELT project:
GDELT project is taking feeds from various websites like Google Ideas, Google and Google News, Yahoo Fellowship, BBC monitoring etc covering over 100 languages and identifies the people, locations, organizations, counts, themes, sources, emotions, counts, quotes and events driving our global society every second of every day.
You may see their two projects one which uses CartoDB platform. You can explore the dotted map from here.
And the other which shows you live trend with image over icon on maps. With map you can also explore the advance analytics data.
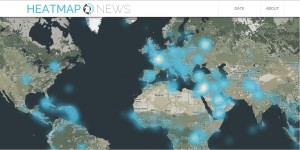
Heat Map News is another website which takes out news from Google News and is currently running 3.1 version and is been updated since 2014. You can view hotspots over world map and click over desired area to get the current news headline over up maker popup with link to the source of news.
http://www.heatmapnews.com
We can filter out the news according to last hour, today, this week or even by selecting the date.
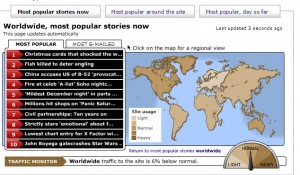
BBC news is one of the most popular news network. They provided a very simple news map website. Just click over the regional view i.e continent of world and get the latest top 10 most popular news or top 10 most e-mailed news.
5.) There are many map news website which are live on internet. Let us list out two more:
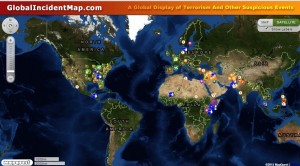
It provides global display of terrorism and other suspicious events. They provide free as well as subscription based news. While free version of map is time delayed for 24-48 Hours. Its sub domain points to other news categories also which can be seen over map viz Amber-Alert Map, HAZMAT Situation Map, Forest Fire Map, Disease Outbreaks Map, Gang Activity, Border Security issue etc.
global incident map
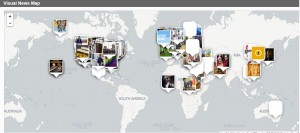
b.) Newseum:
This map fetches and display various newspaper front page around the world. You can explore this map from here.
You may also see an example of ABC news which was created with the help of Google Map Engine or my Google maps. While this map is not providing live feeds, but one can take a look over it to find the solution for how to create the map news website easily and quickly. Knowing about location of the news is really important to analyze the situation. What you think about the News and map association? Do comment below if you know any other news website displayed over map or if you want to share any important views related to this post.
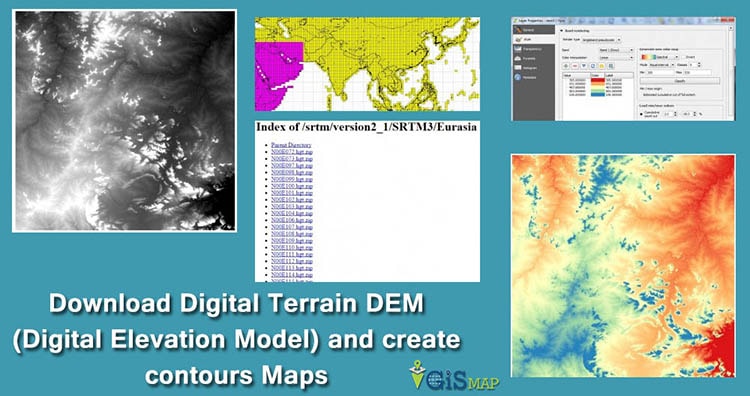
Digital Elevation Model is a 3D representation of a terrain. It is generated by collecting elevation points of terrain. We don’t have to do hectic work like this as webgis provides us with ready-made digital elevation data. WebGIS is where you can find all the leading information and resources for Geographical Information Systems. Here you will find how to download Digital Terrain Data and create contour map.
2.) Digital Terrain data is all we need. You can explore the links given. We will download from SRTM. You can read the documentation for information. Click on SRTM 3.
3.) Click on large map.
Digital Terrain Data create contour map
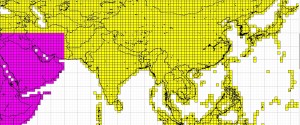
4.) Here you can determine the coordinates of the tile in which your location is lying. You must know where your location is on earth i.e. North East or North West etc. As you determine the coordinates of tile, go to previous page and Click on the map where your location is.
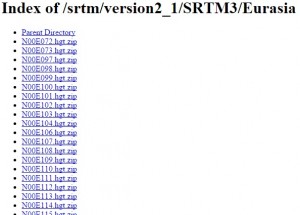
5.) Now click the tile from the index you determined from the large map. It will automatically downloaded to your computer after clicking the link.
Extract DEM and create contour Map:
Contour map shows contour lines with relative space indicating the relative slope of the surface. Here we will open DEM in QGIS and create the contour Map. Here are the steps:
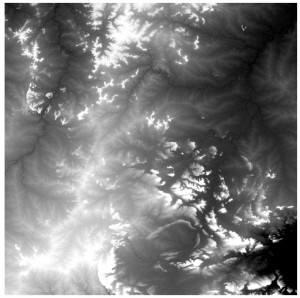
1.) After opening QGIS, we first need to extract the downloaded file, and import the .hgt file using add raster layer tool in QGIS, where you will see a singleband gray image as shown below.
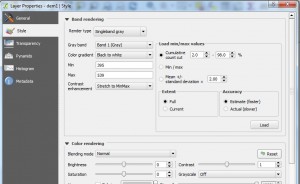
2.) Go to layer properties and click style. Notice the minimum and maximum value. These values are in meters.
Digital Terrain Data create contour map
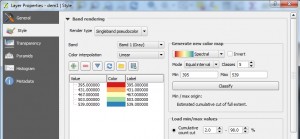
3.) In render type dropdown select singleband pseudocolor and click classify.
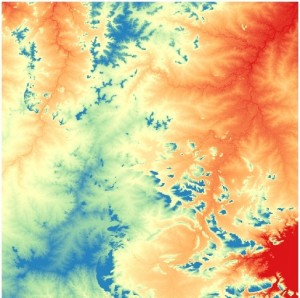
4.) Click apply and ok.
Digital Terrain Data create contour map
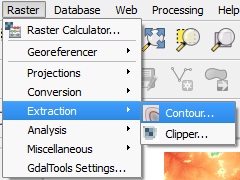
5.) Now we will extract contours from this image. Go to Raster-> Extraction-> Contour as shown.
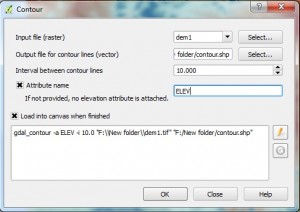
6.) Set the pop up as shown below.
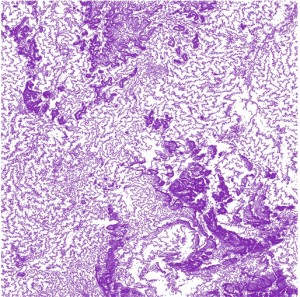
7.) Click ok. The contour file is loaded into your canvas.
Digital Terrain Data create contour map
You may also be interested in QGIS tutorial. Now you can easily analyze the surface by seeing the contour map. Hope this tutorials helped you. If you want to share some suggestion or want to ask some question do comment below.
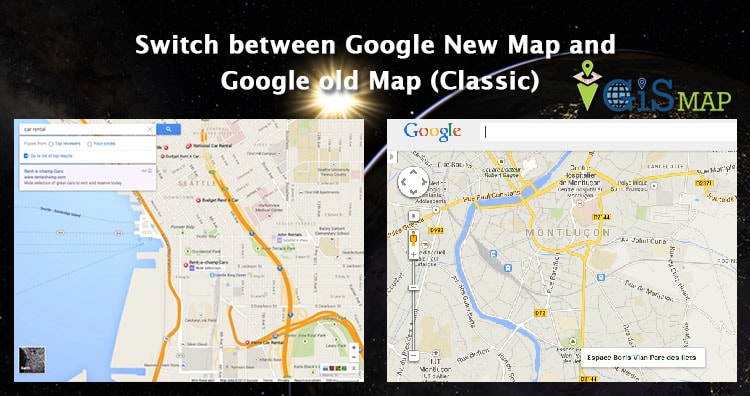
Switch between Google New Map and Google old Map (Classic). Google Map is a web mapping service which offers satellite imagery, street view and street map with many other functionality. Google introduced their New map in mid of 2013, with new User Interface and other improved features. While people are used to old user interface, which makes them to think again of using old (Classic Map) interface of Google Map. Google always thinks and create their product with reference to common people perspective, and that would be a reason why they have given to revert to switch to Classic Google Map. Here are the steps to revert back to classic map:
Update: (As of April 29, 2015) The steps provided below to switch back to classic map, may not work, but you can still try to use any of the link provided, for some days may be, as it will soon be updated to Google New map:
Switch between Google New Map and Google old Map (Classic)
1.) Open Google Map.
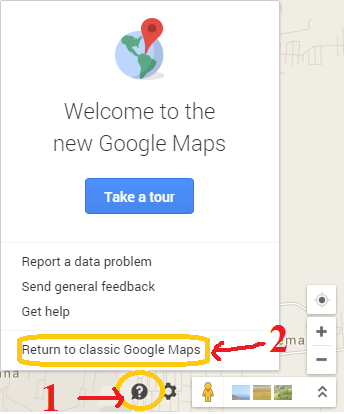
2.) Click Help icon, which you may find in bottom right corner of map.
Switch between Google New Map and Google old Map (Classic)
3.) Click return to classic old Google map.
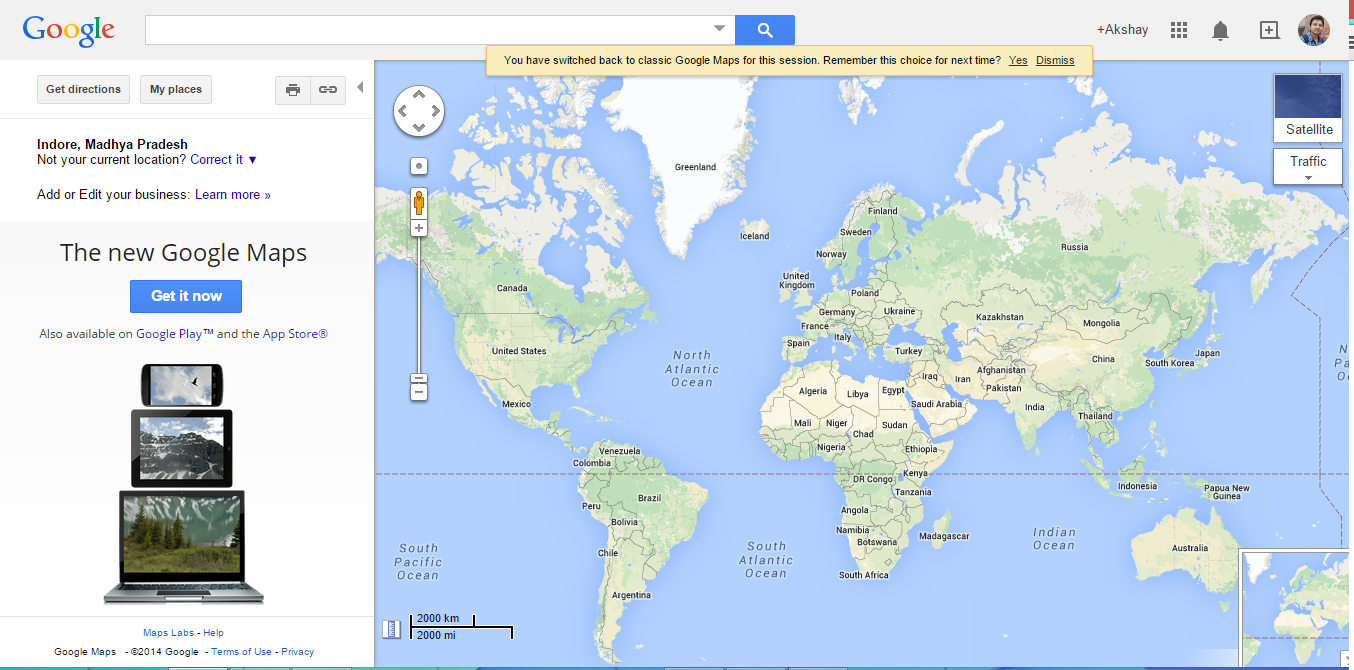
4.) You can write feedback about the new map for the improvement, and again click to revert to classic map, which finally returns you to Google classic old map.
Switch between Google New Map and Google old Map (Classic)
Here is the direct link to switch back to Google Classic map from new map:
You can also switch back to new version of Google Map. By default when you open up maps.google.com, it will response with new Google map. If you getting any problem with Switching back from Google new map to Classic map, do comment below, so that we could discuss and reslove the issue. Thank you.
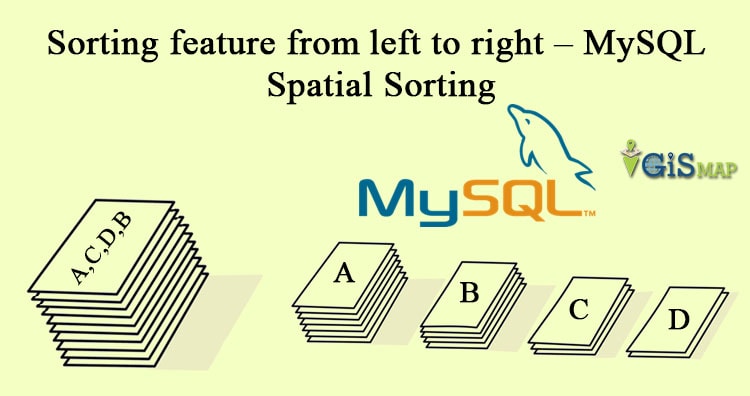
MySQL Spatial Sorting. Let’s think of the situation where you want to color the map in such a way, that no adjacent group of features should have the same color, where group of feature is more than the number of colors you can draw. Obviously this problem can be solved if we sort feature group from left to right and assign the color in the same order. The above described situation has to be solved by us where we need to restrict our technology to only to, GeoJSON, Leaflet, Php and MySQL and no server side API or any GIS server as per the Client requirement.
MySQL Spatial Sorting from left to right
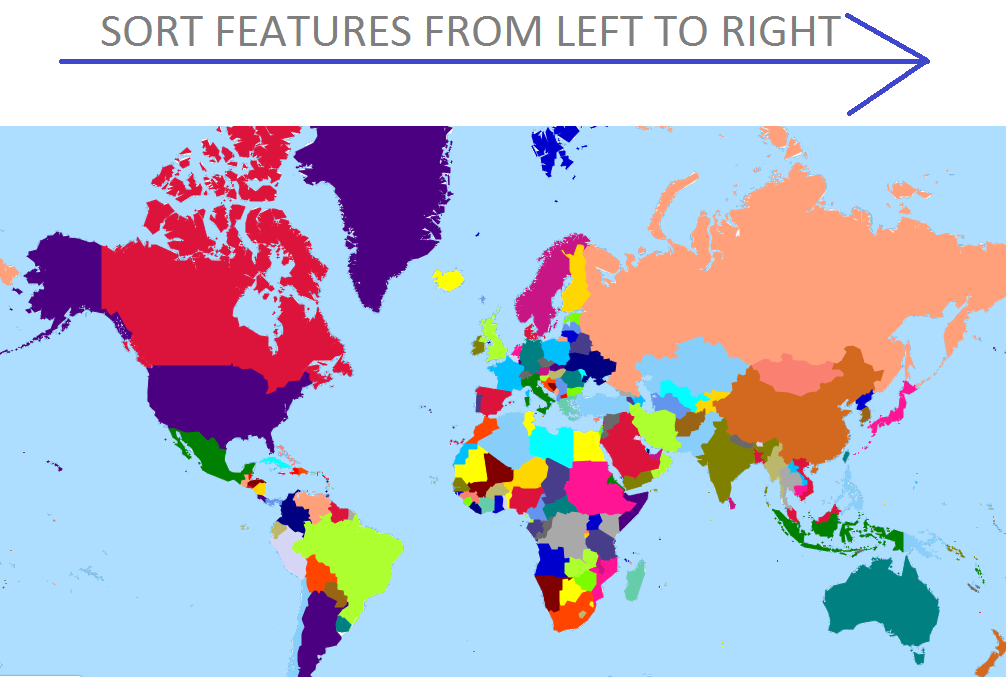
Now as the task is assigned to us, we need to identify and solve the same maintaining the time complexity and load at both client as well as server end. Here we need to sort the feature according to upper left latitude longitude values of each feature bounding box and not with an area or length or with any other attribute in ascending or descending order. Someone can think to sort the features by finding the center latitude longitude point of the features and then sort feature according to the center, but this will only work, when all features are of same size which is not in real world case.
Sorting the features with known bounding box from left to right can be performed with the array of geoJSON feature and leaflet alone at client side, but this will definitely increase the time complexity and load on the browser when spatial data file is very big. The last and the final option we have, is to store the Shapefile or GeoJSON file in MySQL Spatial Database and perform the spatial operation in MySQL to get selected feature in sorted order. Sorting feature from left to right order means we need to work with longitude values of bounding box of feature. If you want to perform sorting the features from top down then use latitude values.
If you understand the store procedure easily then you may navigate to bottom of the page else you can follow the tutorial to know what steps are taken to make the complete stored procedure to sort the features in MySQL.
Note: The tutorial given here for the GI S person who don’t know to operate on database. To make them understand every step is detailed clearly. If you are expert in database, do navigate to bottom of the post and find the stored procedure.
MySQL Spatial Sorting – Steps Performed to Sort the features in MySQL:
1.) First step is to import the shapefile in the Database using ogr2ogr command tool and check whether every feature is inserted correctly in the desired table. Once inserted the next step we need to perform is to calculate MBR(minimum bounding rectangle) for each feature and only select the longitude values of the first starting point, as the first point is the upper left corner point of MBR.
2.) Let’s start our task by finding the MBR for the entire features. We can also call MBR as bounding box of the feature. If you noticed after importing the shapefile in MySQL all the features are saved in a column named SHAPE with a datatype GEOMETRY which makes us eligible to perform spatial query on this column. To find the bounding box of the feature there is a spatial function envelope(g) which returns the MBR for the geometry
SELECT ASTEXT( ENVELOPE( `SHAPE` ) ) FROM `feature`
In the above query ‘feature’ is the name of the table.
ASTEXT() function returns as text the result returned by the ENVELOPE().
Using this query you will get the MBR but we don’t need all the coordinates we only need the longitude of the first point of the result. So we need to take out that longitude and save it to the new column which will ultimately make very easy to sort feature in ascending order.
Unfortunately, we cannot save the result of the select query to the same table so we have to go little further and have to save the result into a new table or a view. Make a new table with two columns, one column for saving the longitude value having data type as text and one for foreign key referenced to the ID column in the main table. Don’t insert any other values or column in the table.
Above query take out the longitude of the starting point and save it into stpoint in the new_feature table and at same time save the same value of the id from feature table to the id in the new_feature table.
SUBSTRING_INDEX() function will take out the text before the first comma that appears in the result given by ASTEXT( ENVELOPE( `SHAPE` ) ).
SUBSTRING() will give us the required longitude value. 10 in this function represents the starting value and 9 represent the length of the value that we want.
If you analyse the result of the query i.e by
SELECT ASTEXT( ENVELOPE( `SHAPE` ) ) FROM `feature`
You will find that the result is in the form POLYGON((long lat,long lat…)).
From this result 10 and 9 came characters to be used in SUBSTRING(). Now we can join the two table using id column in both table and get the desired result. But the sorted result we get is wrong.
If you noticed during the process we get the result as text and we apply all the operation on the text and our stpoint column have data type as text. So the sorting will be done as text sorting so any longitude value starting with 1 will come first and values starting with 9 will come last. To avoid this problem we have to change the data type of the stpoint column to decimal.
ALTER TABLE new_feature MODIFY stpoint DECIMAL( 7, 4 )
In DECIMAL( 7, 4 ) 7 represent the length of the number. That we need and 4 represent the numbers after the decimal so the result be something like 23.4567 or 123.4567.
3.) Now we will join the two table and simultaneously sort the result:
SELECT feature.*, new_feature.stpoint FROM feature INNER JOIN new_feature ON feature.OGR_FID = new_feature.OGR_FID ORDER BY stpoint
We want all the columns from the main table and only stpoint from new_feature. The above query by default will sort the feature in ascending order. Save the result. MySQL will export the result as excel file.
MySQL Spatial Sorting from left to right
You can also write a stored procedure for this process. In stored procedure you don’t have to create a new table instead you just need to create a temporary table which will destroy after the end of the session. Here is the Stored procedure:
MySQL Spatial Sorting from left to right – Stored Procedure:
CREATE DEFINER=`root`@`localhost` PROCEDURE `SortFeature`() MODIFIES SQL DATA COMMENT ‘sort feature in ascending order(long of 1st co. of mbr)’ begin
CREATE TEMPORARY TABLE longitude(OGR_FID int(4) not null , stpoint text(10));
ALTER TABLE longitude MODIFY stpoint DECIMAL(7,4);
SELECT feature.*, longitude.stpoint FROM feature INNER JOIN longitude ON feature.OGR_FID = longitude.OGR_FID ORDER BY stpoint ASC;
end
I hope the above lengthier post might helped you to find a way to sort the features from left direction to right direction with MySQL Spatial Sorting query.
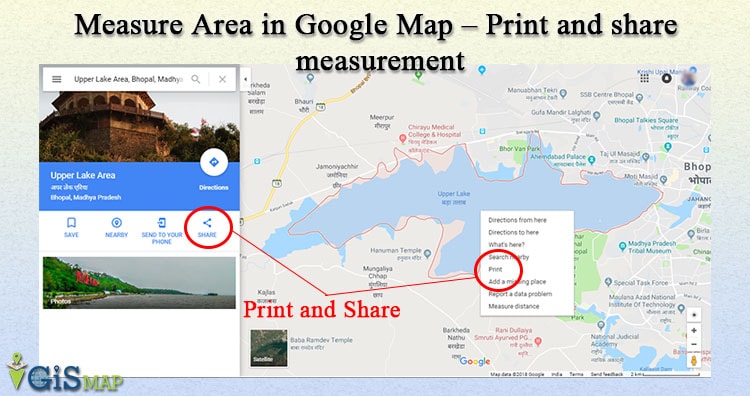
Google Maps, a web mapping service of Google provides a very easy way to calculate and measure Area in google Map along with distance measurement. This would let you measure an area of any geographic location viz home, buildings, Grounds, city, etc from any where without visiting the location with just few clicks with Google Maps.
Measuring area is of the most important part of GIS analysis before coming to a conclusion of any project of construction or any other industries. Yes, as a fact to show to your customer or client, you need to provide a printed or soft-copy version of area and its measurement. Google Map provide the feature to print and save soft copy of the map after performing operation, which can be performed with the steps written below.
Steps to Measure Area in Google Maps:
1.) Open Google Map and check whether you are not in a Lite Mode Google Map, as Lite Mode does not provide an option to calculate and measure area. If you are in Lite mode than switch back to Full mode of Google Maps.
2.) Navigate to area in a Map of which you want to calculate the area.
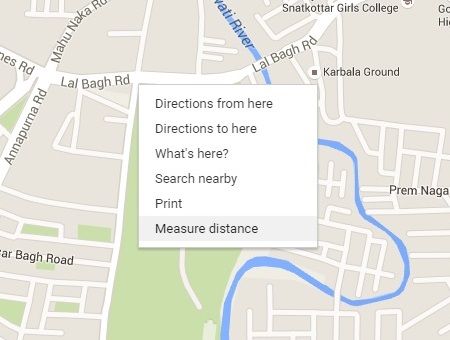
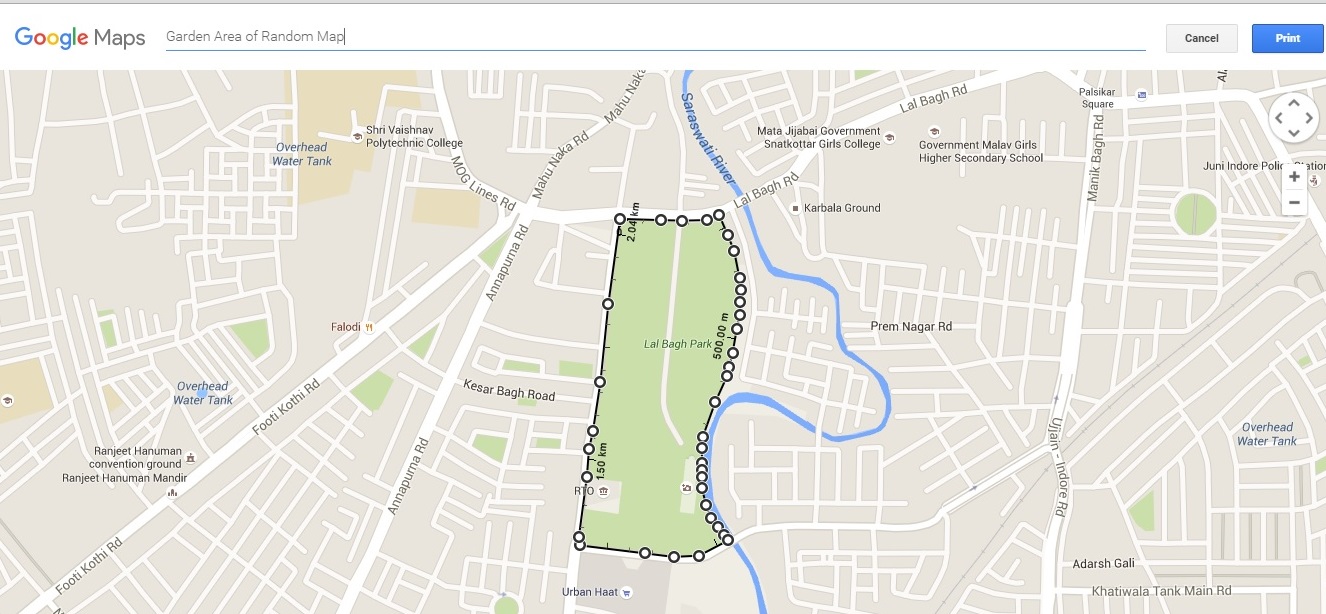
3.) Right click on Map from the starting point of the area and select Measure Distance as shown below. (Don’t worry and continue the process as it will calculate area also along with distance.)
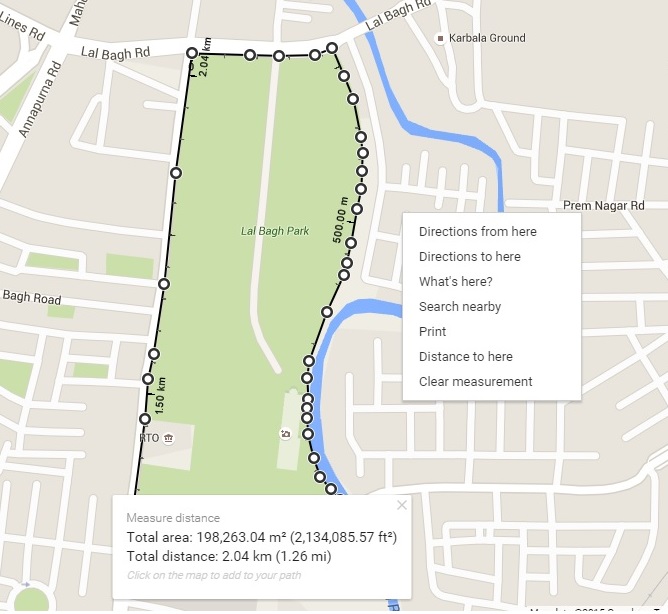
4.) Click on the map to create points so as to create an appropriate area. If you want to get the correct and good result, you should zoom in the map and click along the points to make an area. Remember to get the result in area, you need to connect the last point with the first point on Google Map other wise the measured unit will always be length and not area. Once you connect last and first point, you will get the measurement in distance as well as area.
measure area in Google map
If you find any point to be incorrect you may drag the point to get in the correct position or you may again click the point to remove the same. You may also clear measurement with the option provided with the right click on map.
Note : Both English and Metric unit System is supported in Google map depending upon your location. If your map is zoomed out and you are measuring a large area, the distance unit will appear in square miles (sq m) or square kilometers (sq km) while if the distance measured in Zoomed in map, then the area unit appear to be in the square feet (sq ft) or square meters (sq m).
You can explore Google Map more feature with the following articles listed:
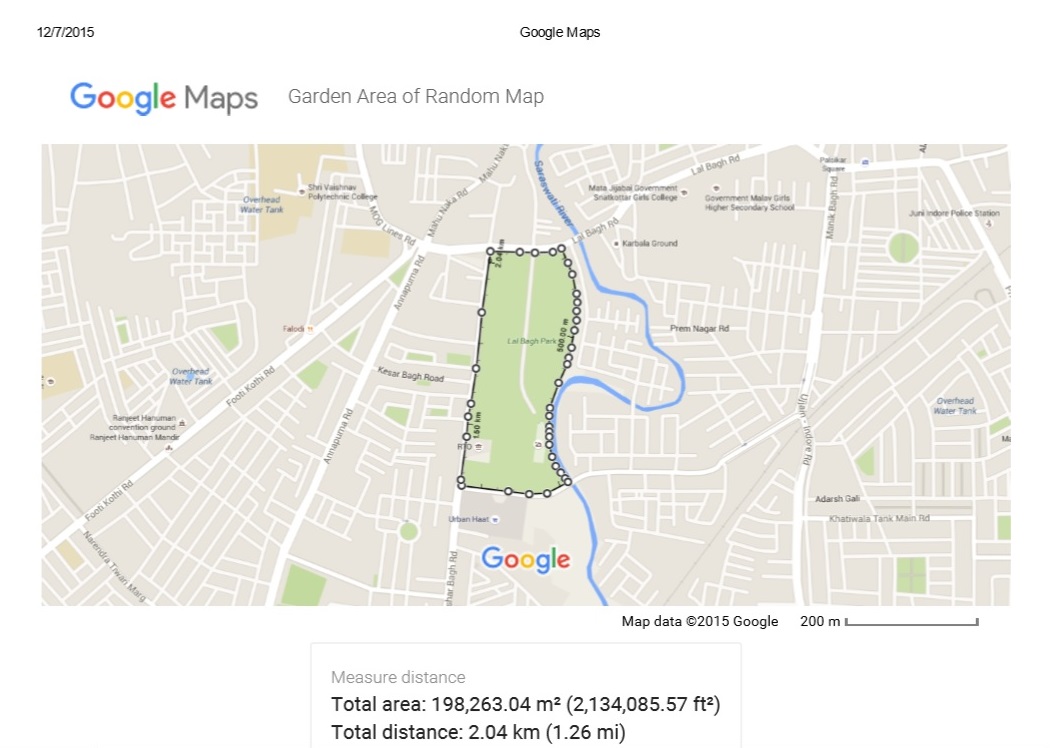
You can easily make a print of the area along with the measured unit, the area covered and the title of the map shown. After performing the above steps. Right click on Google map and select print option. It will take to print section where you can also put up your notes which will appear on just above the maps and the measurement units just below the map.
Now you can easily share the printed or soft copy of the measured area on the map. A sample example of the image generated by google map is shown below.
Print measure area in Google map
Comment below if you are getting any problem in performing the above steps. You may also list the tools which provide the same solution and which you prefer by commenting on the section provided below.
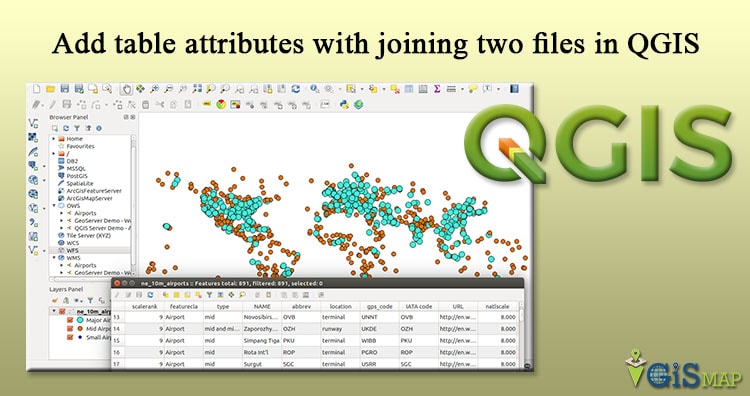
Want to add more attributes in your Shapefile to respective feature? QGIS an open source tool, which I recommend to every Geographer for use, can give you direct solution. Sometimes we need to join more attribute to a GIS vector files which ultimately provide more power to you for analysis with more attributes. For joining two file to add more attribute you need to have a common attribute field in both the files, same as like you need to have primary and foreign key to join two table data in SQL. QGIS provide us the facility to Add more table attributes with joining two files .
Steps to Add table attributes with joining two files in QGIS:
We are performing this steps with Shapefile and csv file, while you can also perform the same steps with other GIS vector file and csv file.
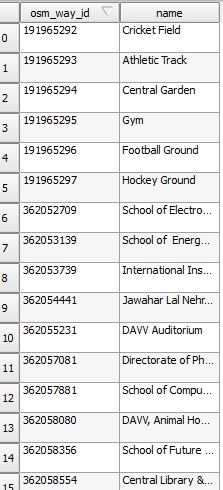
1.) Open QGIS and add a shapefile and observe its attribute table.
Here we have two columns.
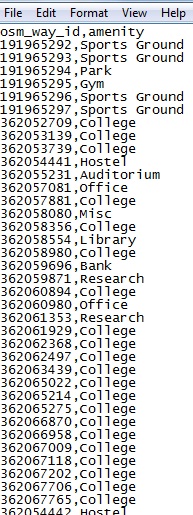
2.) Now We have a comma separated file(.csv) which has to be added. Having two columns i.e osm_way_id and amenity as shown below.
Add table attributes with joining two files
Note : Both the field will store in String format as we have not defined the field type. To define field type, create a new file with the same name of that of csv file but with csvt format in the same folder. For above instance the content should be written as :
“Integer”,”String”
in the file. We can see that osm_way_id is the column which is common in attribute table of shapefile and .csv file. So we can join this two using the same.
3.) First we have to import this file in QGIS. QGIS provide us the facility of importing files which do not have any geographic information also. While importing .csv file we have to take care that default type for .csv file is string if .csvt file is not present in the folder.
QGIS will look for .csvt file for data type in the same folder of same name. If not found all the data would be imported as default type i.e String. Now here all the columns are string so we are not creating a .csvt file.
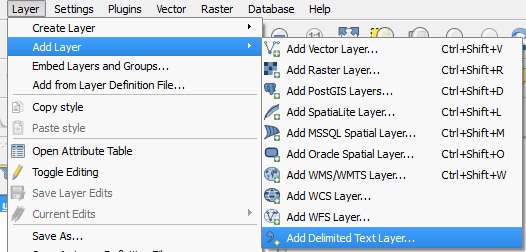
4.) Lets import this file in QGIS. Click layer than Add Layer and select Add Delimited Text Layer.
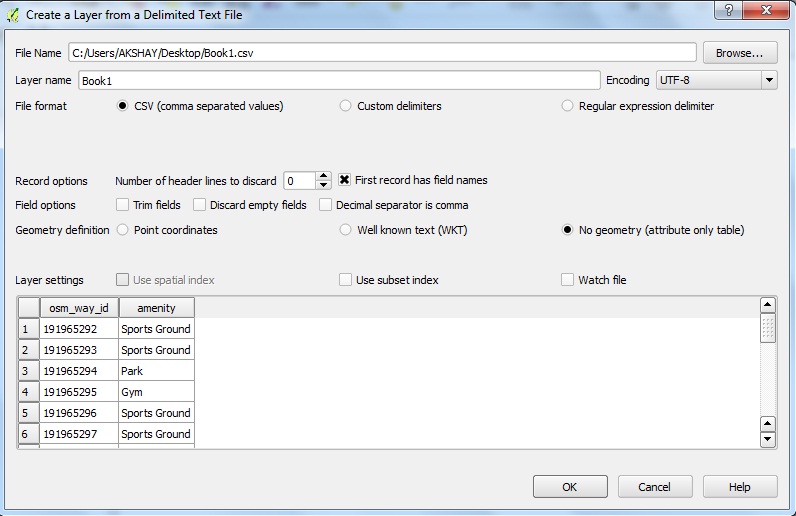
5.) Select csv radio button and then select no geometry radio button.
Add table attributes with joining two files
6.) Click ok. The file is imported.
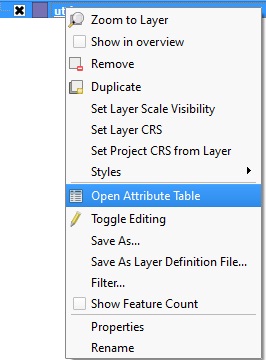
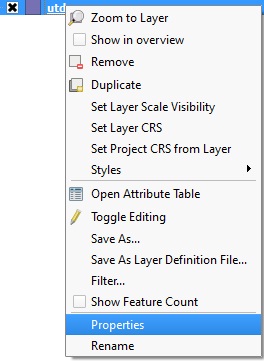
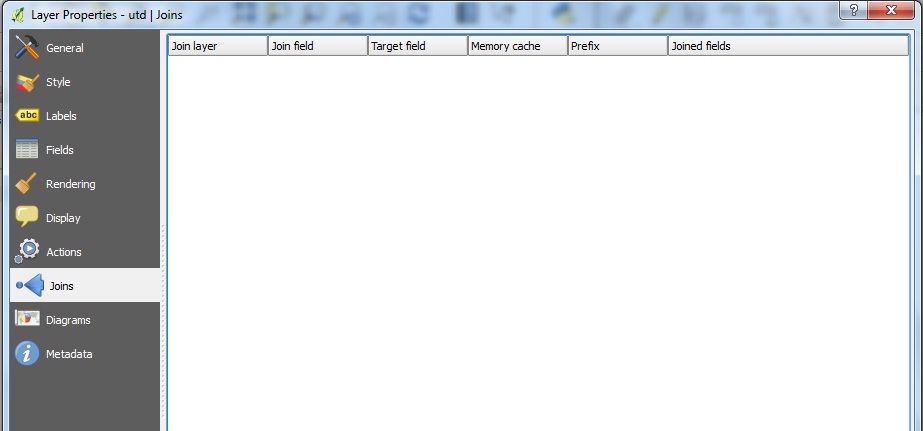
7.) Let’s join both tables. Open properties dialog box of the layer for which we want to perform join.
8.) Click on join.
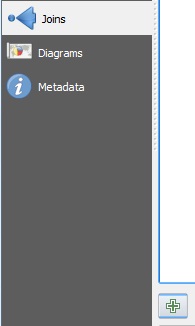
9.) Click on plus sign.
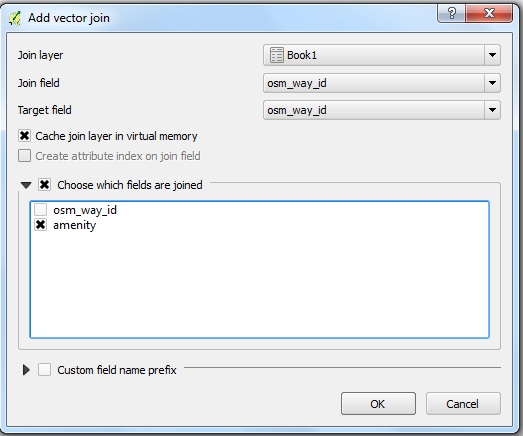
10.) Set the dialog box as in the image. We have chosen the field according to which we want to join and the field which we want to join with the table. By default all the fields are added.
Add table attributes with joining two files
11.) Click ok.
12.) Click ok for properties dialog box.
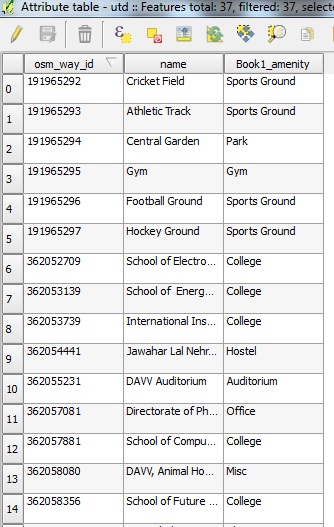
13.) The tables are joined. Open the attribute table for the layer for which you performed join. The column name Book1_amenity shows that it was imported from Book1.
Add table attributes with joining two files
Comment below if you are facing any problem in adding attributes data to respective features in QGIs with Join function.
We use cookies to ensure that we give you the best experience on our website. If you continue to use this site we will assume that you are happy with it.Ok


 3.) Your Desktop QGIS screen will look like this below image.